
|
|||||
|
 | |
| |
| |
| |
| |
| |
|
Gene: RUVBL2 |
Gene summary for RUVBL2 |
| Gene information | Species | Human | Gene symbol | RUVBL2 | Gene ID | 10856 |
| Gene name | RuvB like AAA ATPase 2 | |
| Gene Alias | CGI-46 | |
| Cytomap | 19q13.33 | |
| Gene Type | protein-coding | GO ID | GO:0000491 | UniProtAcc | B3KNL2 |
Top |
Malignant transformation analysis |
| Identification of the aberrant gene expression in precancerous and cancerous lesions by comparing the gene expression of stem-like cells in diseased tissues with normal stem cells |
| Entrez ID | Symbol | Replicates | Species | Organ | Tissue | Adj P-value | Log2FC | Malignancy |
| 10856 | RUVBL2 | LZE2T | Human | Esophagus | ESCC | 2.79e-04 | 7.88e-01 | 0.082 |
| 10856 | RUVBL2 | LZE4T | Human | Esophagus | ESCC | 1.04e-18 | 5.46e-01 | 0.0811 |
| 10856 | RUVBL2 | LZE5T | Human | Esophagus | ESCC | 8.00e-08 | 4.66e-01 | 0.0514 |
| 10856 | RUVBL2 | LZE7T | Human | Esophagus | ESCC | 6.05e-19 | 6.92e-01 | 0.0667 |
| 10856 | RUVBL2 | LZE8T | Human | Esophagus | ESCC | 2.18e-12 | 4.43e-01 | 0.067 |
| 10856 | RUVBL2 | LZE20T | Human | Esophagus | ESCC | 4.86e-11 | 3.58e-01 | 0.0662 |
| 10856 | RUVBL2 | LZE22D1 | Human | Esophagus | HGIN | 1.97e-02 | 1.14e-01 | 0.0595 |
| 10856 | RUVBL2 | LZE22T | Human | Esophagus | ESCC | 8.64e-07 | 6.56e-01 | 0.068 |
| 10856 | RUVBL2 | LZE24T | Human | Esophagus | ESCC | 6.25e-37 | 8.43e-01 | 0.0596 |
| 10856 | RUVBL2 | LZE21T | Human | Esophagus | ESCC | 3.38e-12 | 6.17e-01 | 0.0655 |
| 10856 | RUVBL2 | LZE6T | Human | Esophagus | ESCC | 5.14e-10 | 4.97e-01 | 0.0845 |
| 10856 | RUVBL2 | P1T-E | Human | Esophagus | ESCC | 1.39e-19 | 6.47e-01 | 0.0875 |
| 10856 | RUVBL2 | P2T-E | Human | Esophagus | ESCC | 3.44e-40 | 8.03e-01 | 0.1177 |
| 10856 | RUVBL2 | P4T-E | Human | Esophagus | ESCC | 2.49e-49 | 1.13e+00 | 0.1323 |
| 10856 | RUVBL2 | P5T-E | Human | Esophagus | ESCC | 1.36e-38 | 8.04e-01 | 0.1327 |
| 10856 | RUVBL2 | P8T-E | Human | Esophagus | ESCC | 1.73e-77 | 1.47e+00 | 0.0889 |
| 10856 | RUVBL2 | P9T-E | Human | Esophagus | ESCC | 4.15e-29 | 5.09e-01 | 0.1131 |
| 10856 | RUVBL2 | P10T-E | Human | Esophagus | ESCC | 2.78e-61 | 1.20e+00 | 0.116 |
| 10856 | RUVBL2 | P11T-E | Human | Esophagus | ESCC | 5.88e-32 | 9.09e-01 | 0.1426 |
| 10856 | RUVBL2 | P12T-E | Human | Esophagus | ESCC | 2.01e-51 | 1.01e+00 | 0.1122 |
| Page: 1 2 3 4 5 6 7 |
| Tissue | Expression Dynamics | Abbreviation |
| Esophagus | 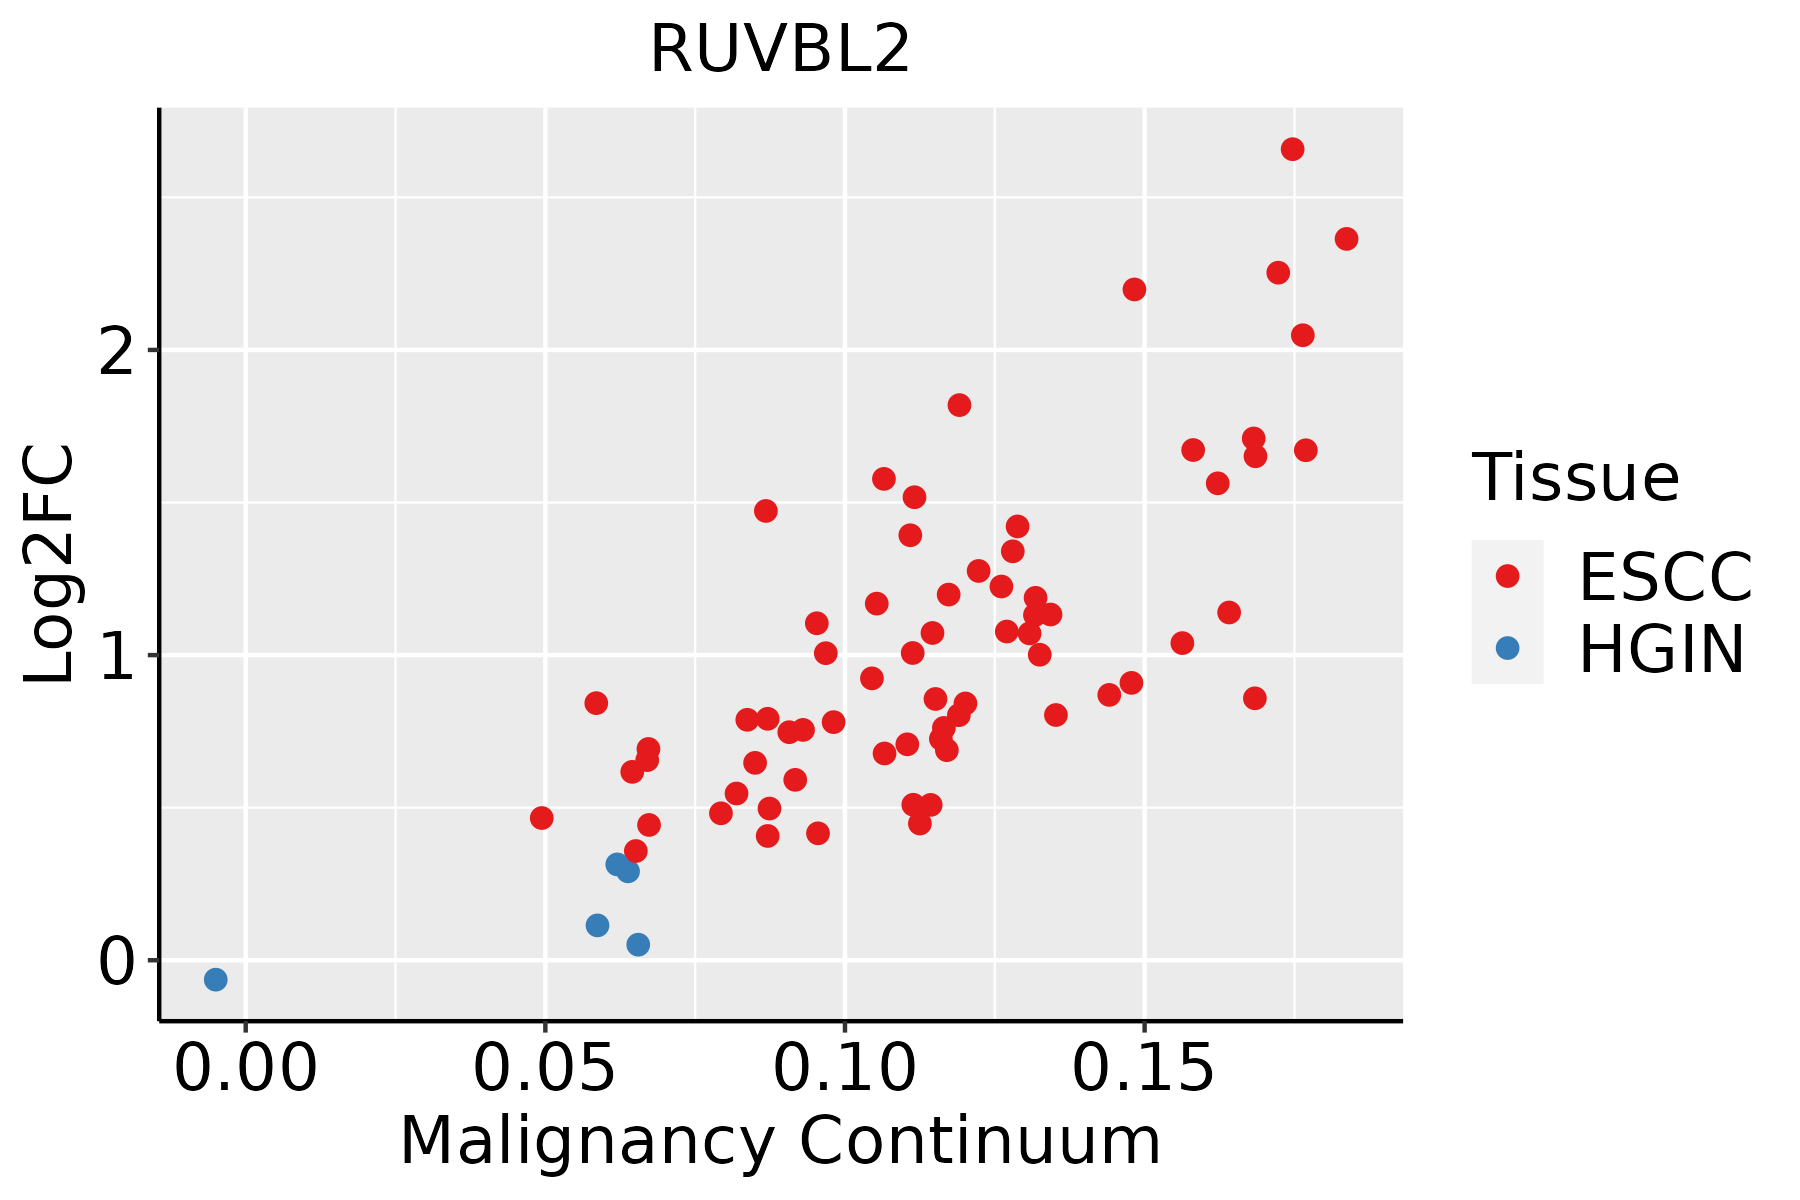 | ESCC: Esophageal squamous cell carcinoma |
| HGIN: High-grade intraepithelial neoplasias | ||
| LGIN: Low-grade intraepithelial neoplasias | ||
| Liver |  | HCC: Hepatocellular carcinoma |
| NAFLD: Non-alcoholic fatty liver disease | ||
| Oral Cavity | 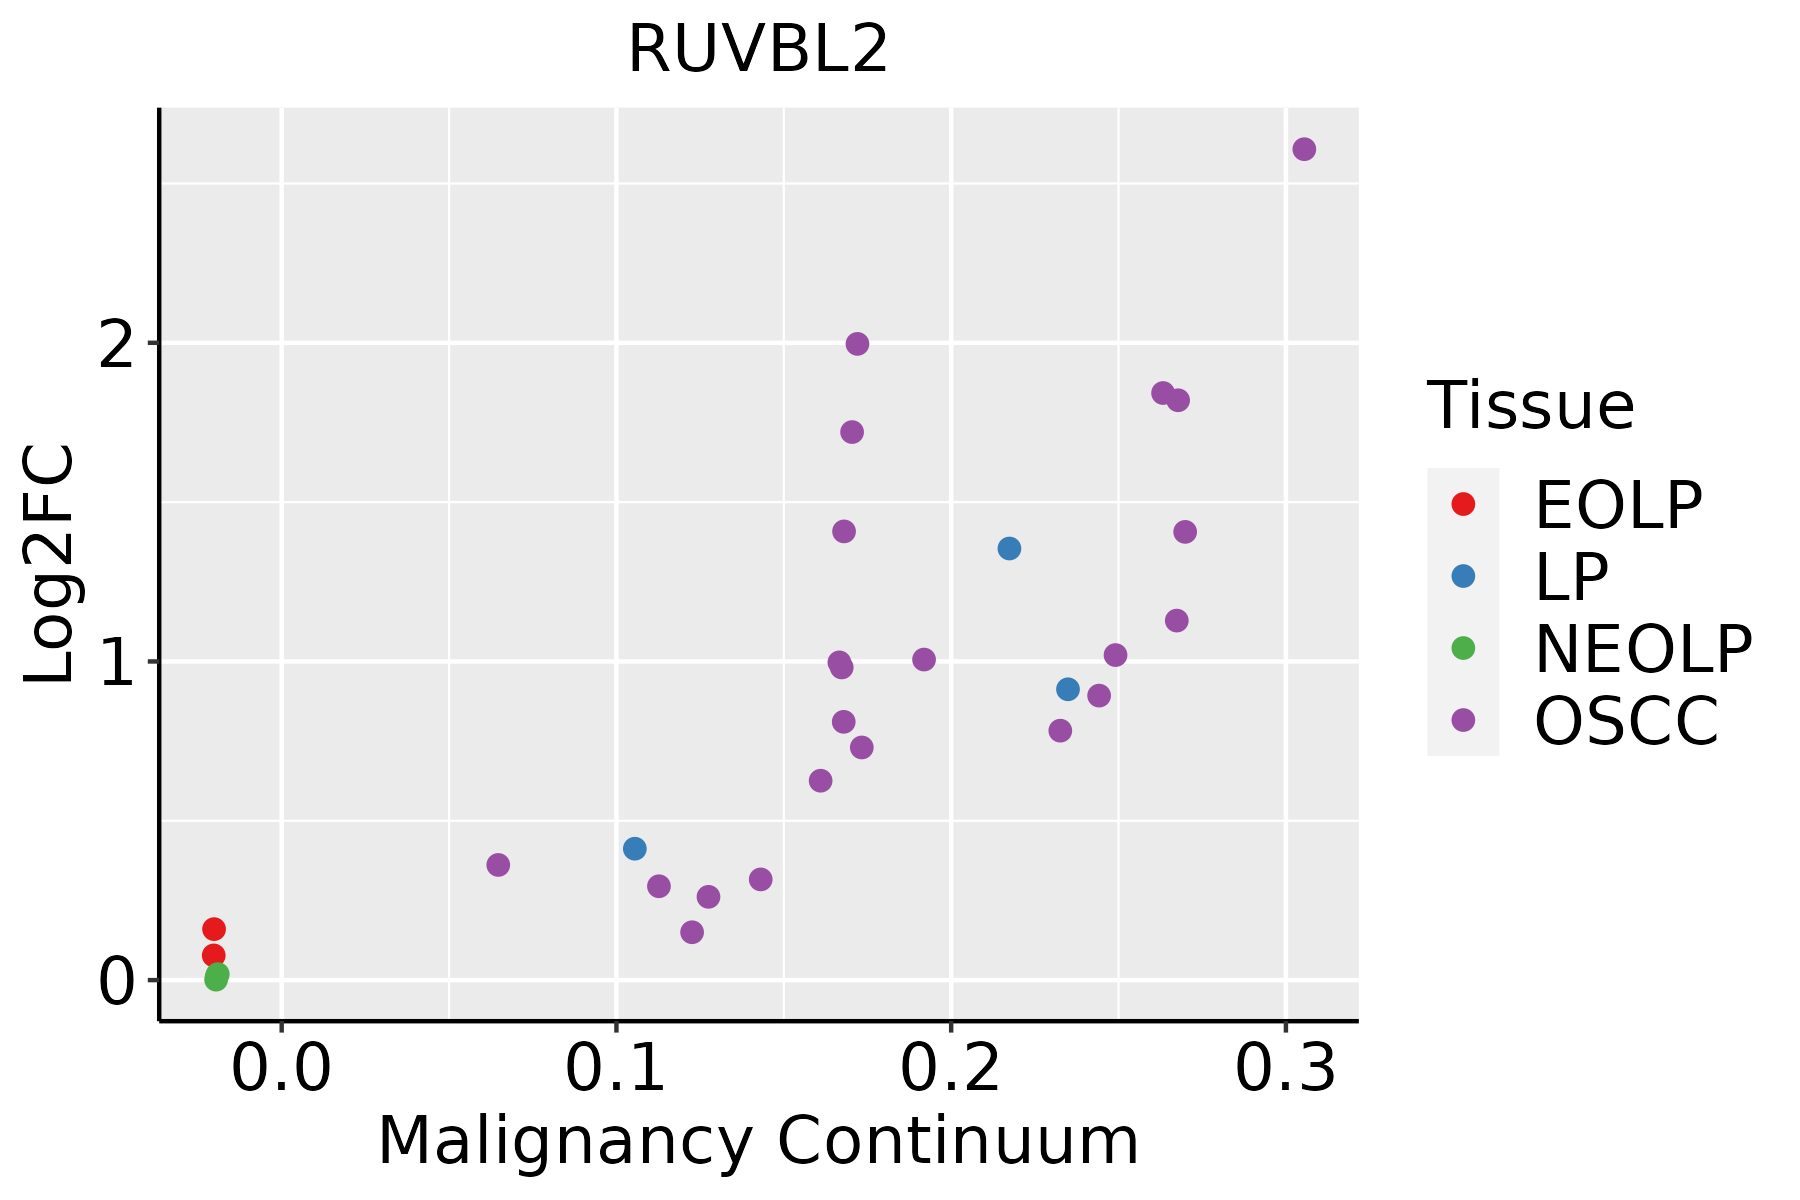 | EOLP: Erosive Oral lichen planus |
| LP: leukoplakia | ||
| NEOLP: Non-erosive oral lichen planus | ||
| OSCC: Oral squamous cell carcinoma | ||
| Skin |  | AK: Actinic keratosis |
| cSCC: Cutaneous squamous cell carcinoma | ||
| SCCIS:squamous cell carcinoma in situ | ||
| Thyroid | 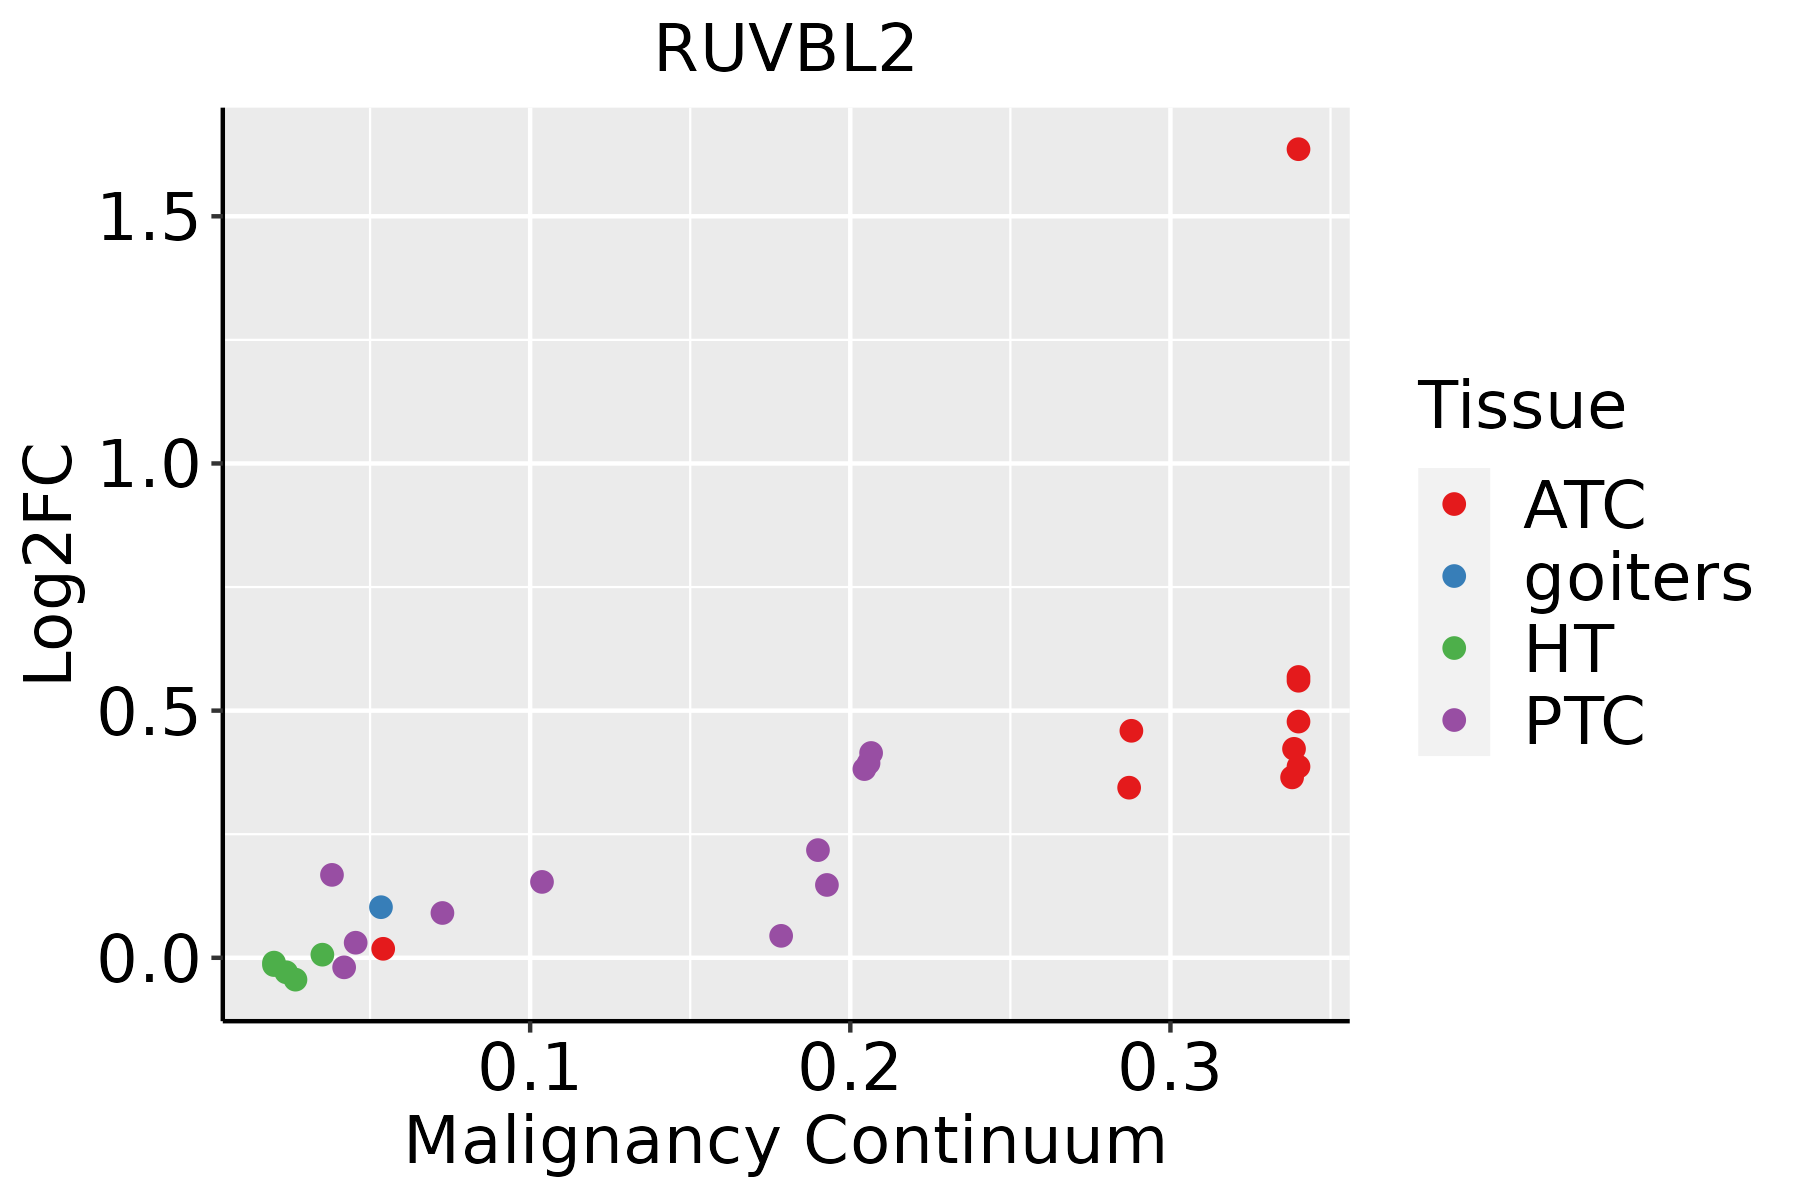 | ATC: Anaplastic thyroid cancer |
| HT: Hashimoto's thyroiditis | ||
| PTC: Papillary thyroid cancer |
| ∗log2FC in expression of this searched gene in stem-like cells from each diseased tissue sample relative to stem-like cells in normal samples in each tissue plotted against the malignancy continuum. Samples are colored based on if they are from different disease stage. |
Top |
Malignant transformation related pathway analysis |
| Find out the enriched GO biological processes and KEGG pathways involved in transition from healthy to precancer to cancer |
| Tissue | Disease Stage | Enriched GO biological Processes |
| Colorectum | AD |  |
| Colorectum | SER |  |
| Colorectum | MSS |  |
| Colorectum | MSI-H |  |
| Colorectum | FAP |  |
| ∗Top 15 enriched GO BP terms are showed in the bar plot of each disease state in each tissue. Each row represents a significant GO biological process which is colored according to the -log10(p.adjust). |
| Page: 1 2 3 4 5 6 7 8 9 |
| GO ID | Tissue | Disease Stage | Description | Gene Ratio | Bg Ratio | pvalue | p.adjust | Count |
| GO:002261327 | Esophagus | HGIN | ribonucleoprotein complex biogenesis | 158/2587 | 463/18723 | 2.61e-29 | 5.23e-26 | 158 |
| GO:007182627 | Esophagus | HGIN | ribonucleoprotein complex subunit organization | 84/2587 | 227/18723 | 1.34e-18 | 5.37e-16 | 84 |
| GO:002261827 | Esophagus | HGIN | ribonucleoprotein complex assembly | 82/2587 | 220/18723 | 2.07e-18 | 7.36e-16 | 82 |
| GO:000645720 | Esophagus | HGIN | protein folding | 75/2587 | 212/18723 | 1.61e-15 | 3.86e-13 | 75 |
| GO:007259420 | Esophagus | HGIN | establishment of protein localization to organelle | 120/2587 | 422/18723 | 1.73e-15 | 4.00e-13 | 120 |
| GO:000640320 | Esophagus | HGIN | RNA localization | 66/2587 | 201/18723 | 4.06e-12 | 5.41e-10 | 66 |
| GO:00182057 | Esophagus | HGIN | peptidyl-lysine modification | 88/2587 | 376/18723 | 2.99e-07 | 1.39e-05 | 88 |
| GO:000632516 | Esophagus | HGIN | chromatin organization | 92/2587 | 409/18723 | 1.05e-06 | 4.16e-05 | 92 |
| GO:19048747 | Esophagus | HGIN | positive regulation of telomerase RNA localization to Cajal body | 9/2587 | 15/18723 | 4.11e-05 | 1.01e-03 | 9 |
| GO:00165708 | Esophagus | HGIN | histone modification | 92/2587 | 463/18723 | 1.70e-04 | 3.30e-03 | 92 |
| GO:00701996 | Esophagus | HGIN | establishment of protein localization to chromosome | 11/2587 | 25/18723 | 2.35e-04 | 4.24e-03 | 11 |
| GO:19048727 | Esophagus | HGIN | regulation of telomerase RNA localization to Cajal body | 9/2587 | 18/18723 | 2.70e-04 | 4.67e-03 | 9 |
| GO:00323926 | Esophagus | HGIN | DNA geometric change | 25/2587 | 90/18723 | 3.77e-04 | 5.85e-03 | 25 |
| GO:00906707 | Esophagus | HGIN | RNA localization to Cajal body | 9/2587 | 19/18723 | 4.50e-04 | 6.62e-03 | 9 |
| GO:00906717 | Esophagus | HGIN | telomerase RNA localization to Cajal body | 9/2587 | 19/18723 | 4.50e-04 | 6.62e-03 | 9 |
| GO:00906727 | Esophagus | HGIN | telomerase RNA localization | 9/2587 | 19/18723 | 4.50e-04 | 6.62e-03 | 9 |
| GO:00906857 | Esophagus | HGIN | RNA localization to nucleus | 9/2587 | 19/18723 | 4.50e-04 | 6.62e-03 | 9 |
| GO:00064735 | Esophagus | HGIN | protein acetylation | 45/2587 | 201/18723 | 6.17e-04 | 8.58e-03 | 45 |
| GO:000931418 | Esophagus | HGIN | response to radiation | 88/2587 | 456/18723 | 6.26e-04 | 8.65e-03 | 88 |
| GO:00310568 | Esophagus | HGIN | regulation of histone modification | 36/2587 | 152/18723 | 7.06e-04 | 9.52e-03 | 36 |
| Page: 1 2 3 4 5 6 7 8 9 10 11 12 13 14 15 16 17 18 19 20 21 22 |
| Pathway ID | Tissue | Disease Stage | Description | Gene Ratio | Bg Ratio | pvalue | p.adjust | qvalue | Count |
| Page: 1 |
Top |
Cell-cell communication analysis |
| Identification of potential cell-cell interactions between two cell types and their ligand-receptor pairs for different disease states |
| Ligand | Receptor | LRpair | Pathway | Tissue | Disease Stage |
| Page: 1 |
Top |
Single-cell gene regulatory network inference analysis |
| Find out the significant the regulons (TFs) and the target genes of each regulon across cell types for different disease states |
| TF | Cell Type | Tissue | Disease Stage | Target Gene | RSS | Regulon Activity |
| ∗The dot plots of a searched regulon are shown for all cell subpopulations in each disease state of each tissue based on the regulon specific score inferred using pySCENIC and by calculating the average expression. |
| Page: 1 |
Top |
Somatic mutation of malignant transformation related genes |
| Annotation of somatic variants for genes involved in malignant transformation |
| Hugo Symbol | Variant Class | Variant Classification | dbSNP RS | HGVSc | HGVSp | HGVSp Short | SWISSPROT | BIOTYPE | SIFT | PolyPhen | Tumor Sample Barcode | Tissue | Histology | Sex | Age | Stage | Therapy Types | Drugs | Outcome |
| RUVBL2 | SNV | Missense_Mutation | c.634N>A | p.Ala212Thr | p.A212T | Q9Y230 | protein_coding | deleterious(0.03) | benign(0.125) | TCGA-AN-A0AK-01 | Breast | breast invasive carcinoma | Female | >=65 | I/II | Unknown | Unknown | SD | |
| RUVBL2 | deletion | Frame_Shift_Del | novel | c.71delN | p.His25ThrfsTer38 | p.H25Tfs*38 | Q9Y230 | protein_coding | TCGA-D8-A27V-01 | Breast | breast invasive carcinoma | Female | <65 | I/II | Hormone Therapy | tamoxiphen | SD | ||
| RUVBL2 | SNV | Missense_Mutation | c.388N>T | p.Arg130Cys | p.R130C | Q9Y230 | protein_coding | deleterious(0) | probably_damaging(0.986) | TCGA-2W-A8YY-01 | Cervix | cervical & endocervical cancer | Female | <65 | I/II | Chemotherapy | cisplatin | CR | |
| RUVBL2 | SNV | Missense_Mutation | c.1054N>A | p.Asp352Asn | p.D352N | Q9Y230 | protein_coding | deleterious(0) | probably_damaging(0.989) | TCGA-AA-3660-01 | Colorectum | colon adenocarcinoma | Female | <65 | I/II | Unknown | Unknown | SD | |
| RUVBL2 | SNV | Missense_Mutation | c.1006C>T | p.Arg336Trp | p.R336W | Q9Y230 | protein_coding | deleterious(0) | probably_damaging(1) | TCGA-AA-3864-01 | Colorectum | colon adenocarcinoma | Male | >=65 | I/II | Unknown | Unknown | SD | |
| RUVBL2 | SNV | Missense_Mutation | c.634G>A | p.Ala212Thr | p.A212T | Q9Y230 | protein_coding | deleterious(0.03) | benign(0.125) | TCGA-AA-A010-01 | Colorectum | colon adenocarcinoma | Female | <65 | I/II | Chemotherapy | folinic | CR | |
| RUVBL2 | SNV | Missense_Mutation | rs767467214 | c.1198N>T | p.Arg400Cys | p.R400C | Q9Y230 | protein_coding | deleterious(0) | probably_damaging(1) | TCGA-CK-4951-01 | Colorectum | colon adenocarcinoma | Female | >=65 | I/II | Unknown | Unknown | PD |
| RUVBL2 | SNV | Missense_Mutation | c.599N>T | p.Gly200Val | p.G200V | Q9Y230 | protein_coding | deleterious(0) | probably_damaging(0.998) | TCGA-G4-6304-01 | Colorectum | colon adenocarcinoma | Female | >=65 | I/II | Chemotherapy | fluorouracil | PD | |
| RUVBL2 | SNV | Missense_Mutation | rs761782658 | c.272N>T | p.Ala91Val | p.A91V | Q9Y230 | protein_coding | deleterious(0) | probably_damaging(0.976) | TCGA-EI-6507-01 | Colorectum | rectum adenocarcinoma | Male | <65 | I/II | Unknown | Unknown | SD |
| RUVBL2 | SNV | Missense_Mutation | c.517N>A | p.Asp173Asn | p.D173N | Q9Y230 | protein_coding | tolerated(0.05) | probably_damaging(0.986) | TCGA-EI-6507-01 | Colorectum | rectum adenocarcinoma | Male | <65 | I/II | Unknown | Unknown | SD |
| Page: 1 2 3 4 5 |
Top |
Related drugs of malignant transformation related genes |
| Identification of chemicals and drugs interact with genes involved in malignant transfromation |
| (DGIdb 4.0) |
| Entrez ID | Symbol | Category | Interaction Types | Drug Claim Name | Drug Name | PMIDs |
| Page: 1 |

Copyright 2023-Present -The University of Texas Health Science Center at Houston |