
|
|||||
|
 | |
| |
| |
| |
| |
| |
|
Gene: RUSC1 |
Gene summary for RUSC1 |
| Gene information | Species | Human | Gene symbol | RUSC1 | Gene ID | 23623 |
| Gene name | RUN and SH3 domain containing 1 | |
| Gene Alias | NESCA | |
| Cytomap | 1q22 | |
| Gene Type | protein-coding | GO ID | GO:0000209 | UniProtAcc | Q9BVN2 |
Top |
Malignant transformation analysis |
| Identification of the aberrant gene expression in precancerous and cancerous lesions by comparing the gene expression of stem-like cells in diseased tissues with normal stem cells |
| Entrez ID | Symbol | Replicates | Species | Organ | Tissue | Adj P-value | Log2FC | Malignancy |
| 23623 | RUSC1 | HTA11_2487_2000001011 | Human | Colorectum | SER | 5.55e-07 | 4.59e-01 | -0.1808 |
| 23623 | RUSC1 | HTA11_1938_2000001011 | Human | Colorectum | AD | 5.82e-04 | 2.76e-01 | -0.0811 |
| 23623 | RUSC1 | HTA11_78_2000001011 | Human | Colorectum | AD | 1.14e-02 | 2.97e-01 | -0.1088 |
| 23623 | RUSC1 | HTA11_347_2000001011 | Human | Colorectum | AD | 1.16e-09 | 3.33e-01 | -0.1954 |
| 23623 | RUSC1 | HTA11_411_2000001011 | Human | Colorectum | SER | 3.14e-04 | 5.86e-01 | -0.2602 |
| 23623 | RUSC1 | HTA11_83_2000001011 | Human | Colorectum | SER | 2.50e-04 | 3.44e-01 | -0.1526 |
| 23623 | RUSC1 | HTA11_696_2000001011 | Human | Colorectum | AD | 2.63e-05 | 3.10e-01 | -0.1464 |
| 23623 | RUSC1 | HTA11_1391_2000001011 | Human | Colorectum | AD | 4.28e-10 | 4.44e-01 | -0.059 |
| 23623 | RUSC1 | HTA11_2992_2000001011 | Human | Colorectum | SER | 4.78e-06 | 4.91e-01 | -0.1706 |
| 23623 | RUSC1 | HTA11_5212_2000001011 | Human | Colorectum | AD | 1.52e-04 | 5.10e-01 | -0.2061 |
| 23623 | RUSC1 | HTA11_99999971662_82457 | Human | Colorectum | MSS | 1.53e-02 | 2.84e-01 | 0.3859 |
| 23623 | RUSC1 | LZE2T | Human | Esophagus | ESCC | 3.97e-04 | 6.43e-01 | 0.082 |
| 23623 | RUSC1 | LZE4T | Human | Esophagus | ESCC | 2.69e-11 | 2.42e-01 | 0.0811 |
| 23623 | RUSC1 | LZE7T | Human | Esophagus | ESCC | 3.79e-12 | 6.56e-01 | 0.0667 |
| 23623 | RUSC1 | LZE8T | Human | Esophagus | ESCC | 1.27e-05 | 2.33e-01 | 0.067 |
| 23623 | RUSC1 | LZE20T | Human | Esophagus | ESCC | 2.07e-05 | 1.57e-01 | 0.0662 |
| 23623 | RUSC1 | LZE22T | Human | Esophagus | ESCC | 2.02e-06 | 6.63e-01 | 0.068 |
| 23623 | RUSC1 | LZE24T | Human | Esophagus | ESCC | 1.92e-23 | 6.34e-01 | 0.0596 |
| 23623 | RUSC1 | LZE21T | Human | Esophagus | ESCC | 1.73e-05 | 2.93e-01 | 0.0655 |
| 23623 | RUSC1 | LZE6T | Human | Esophagus | ESCC | 3.44e-05 | 4.97e-01 | 0.0845 |
| Page: 1 2 3 4 5 6 7 |
| Tissue | Expression Dynamics | Abbreviation |
| Colorectum (GSE201348) |  | FAP: Familial adenomatous polyposis |
| CRC: Colorectal cancer | ||
| Colorectum (HTA11) | 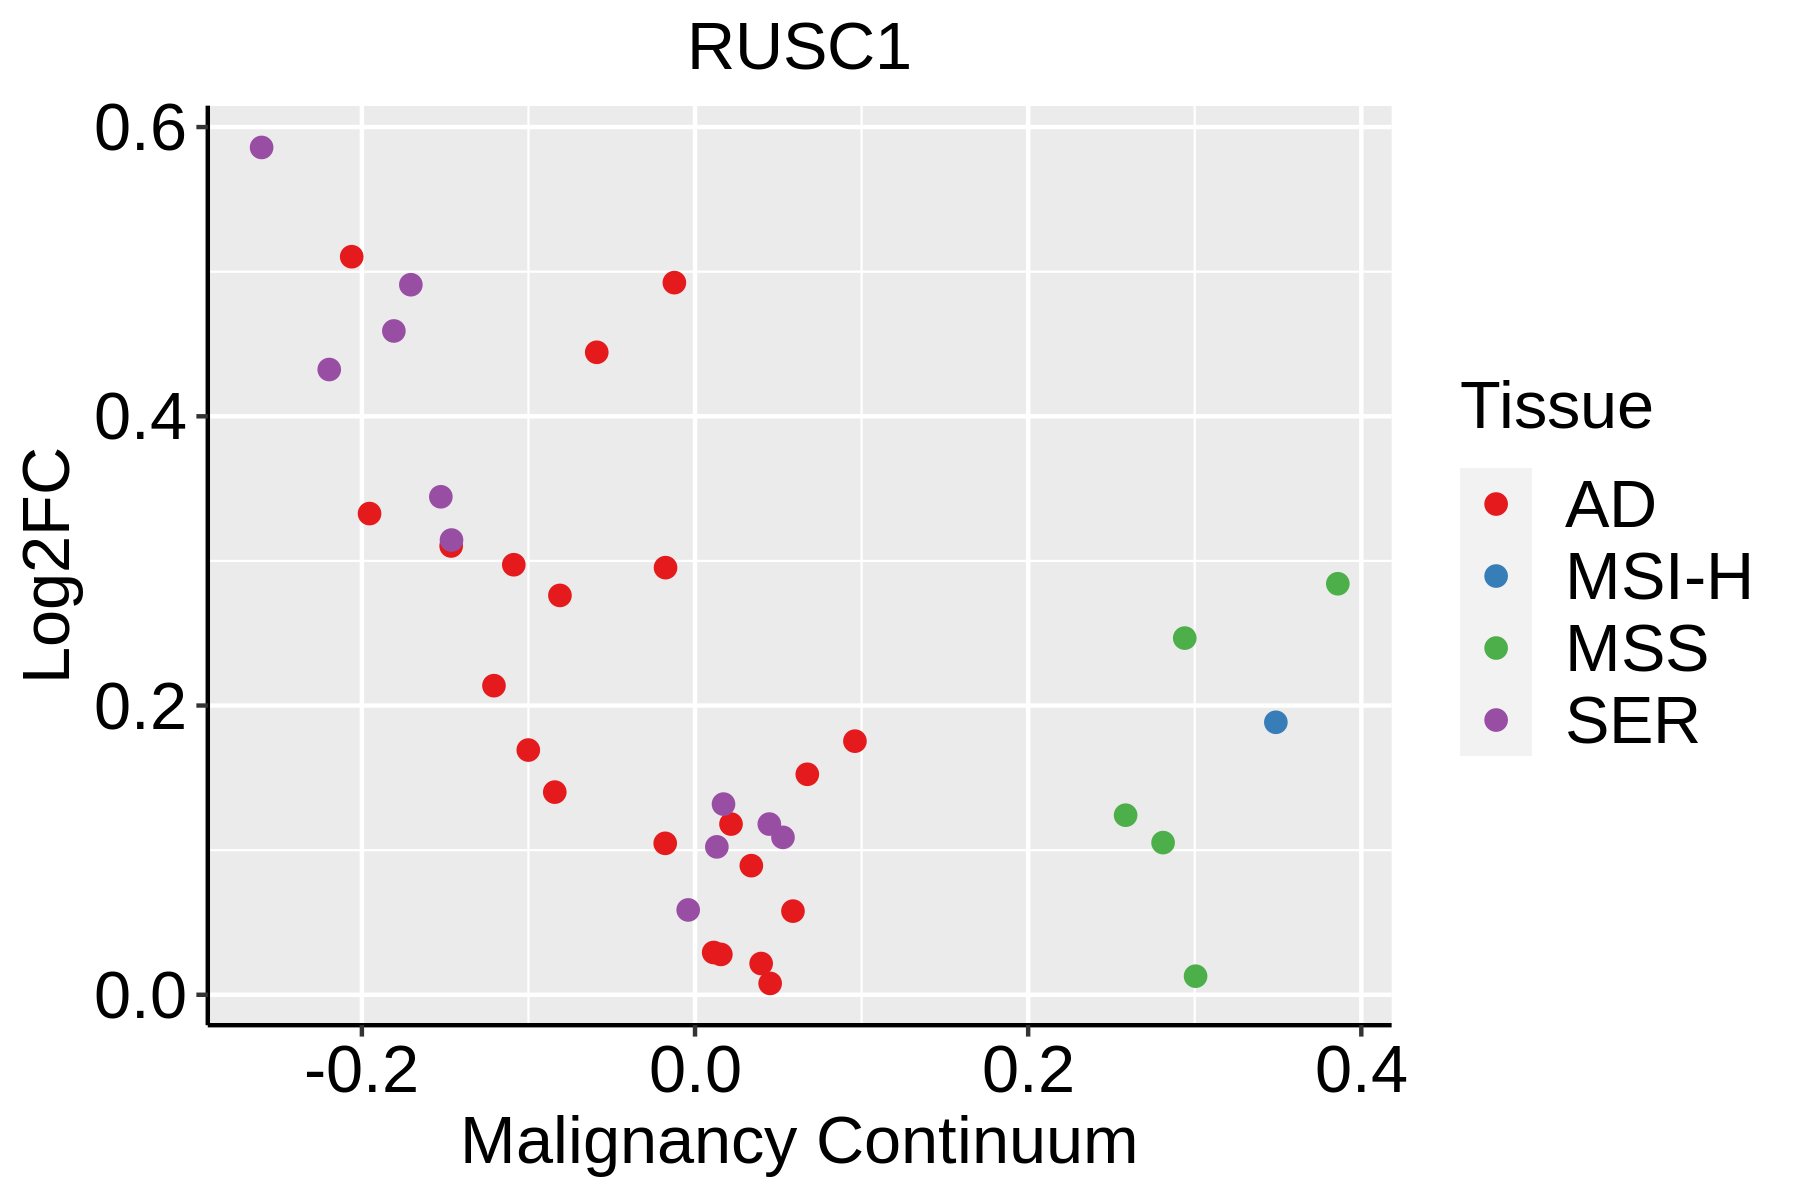 | AD: Adenomas |
| SER: Sessile serrated lesions | ||
| MSI-H: Microsatellite-high colorectal cancer | ||
| MSS: Microsatellite stable colorectal cancer | ||
| Esophagus | 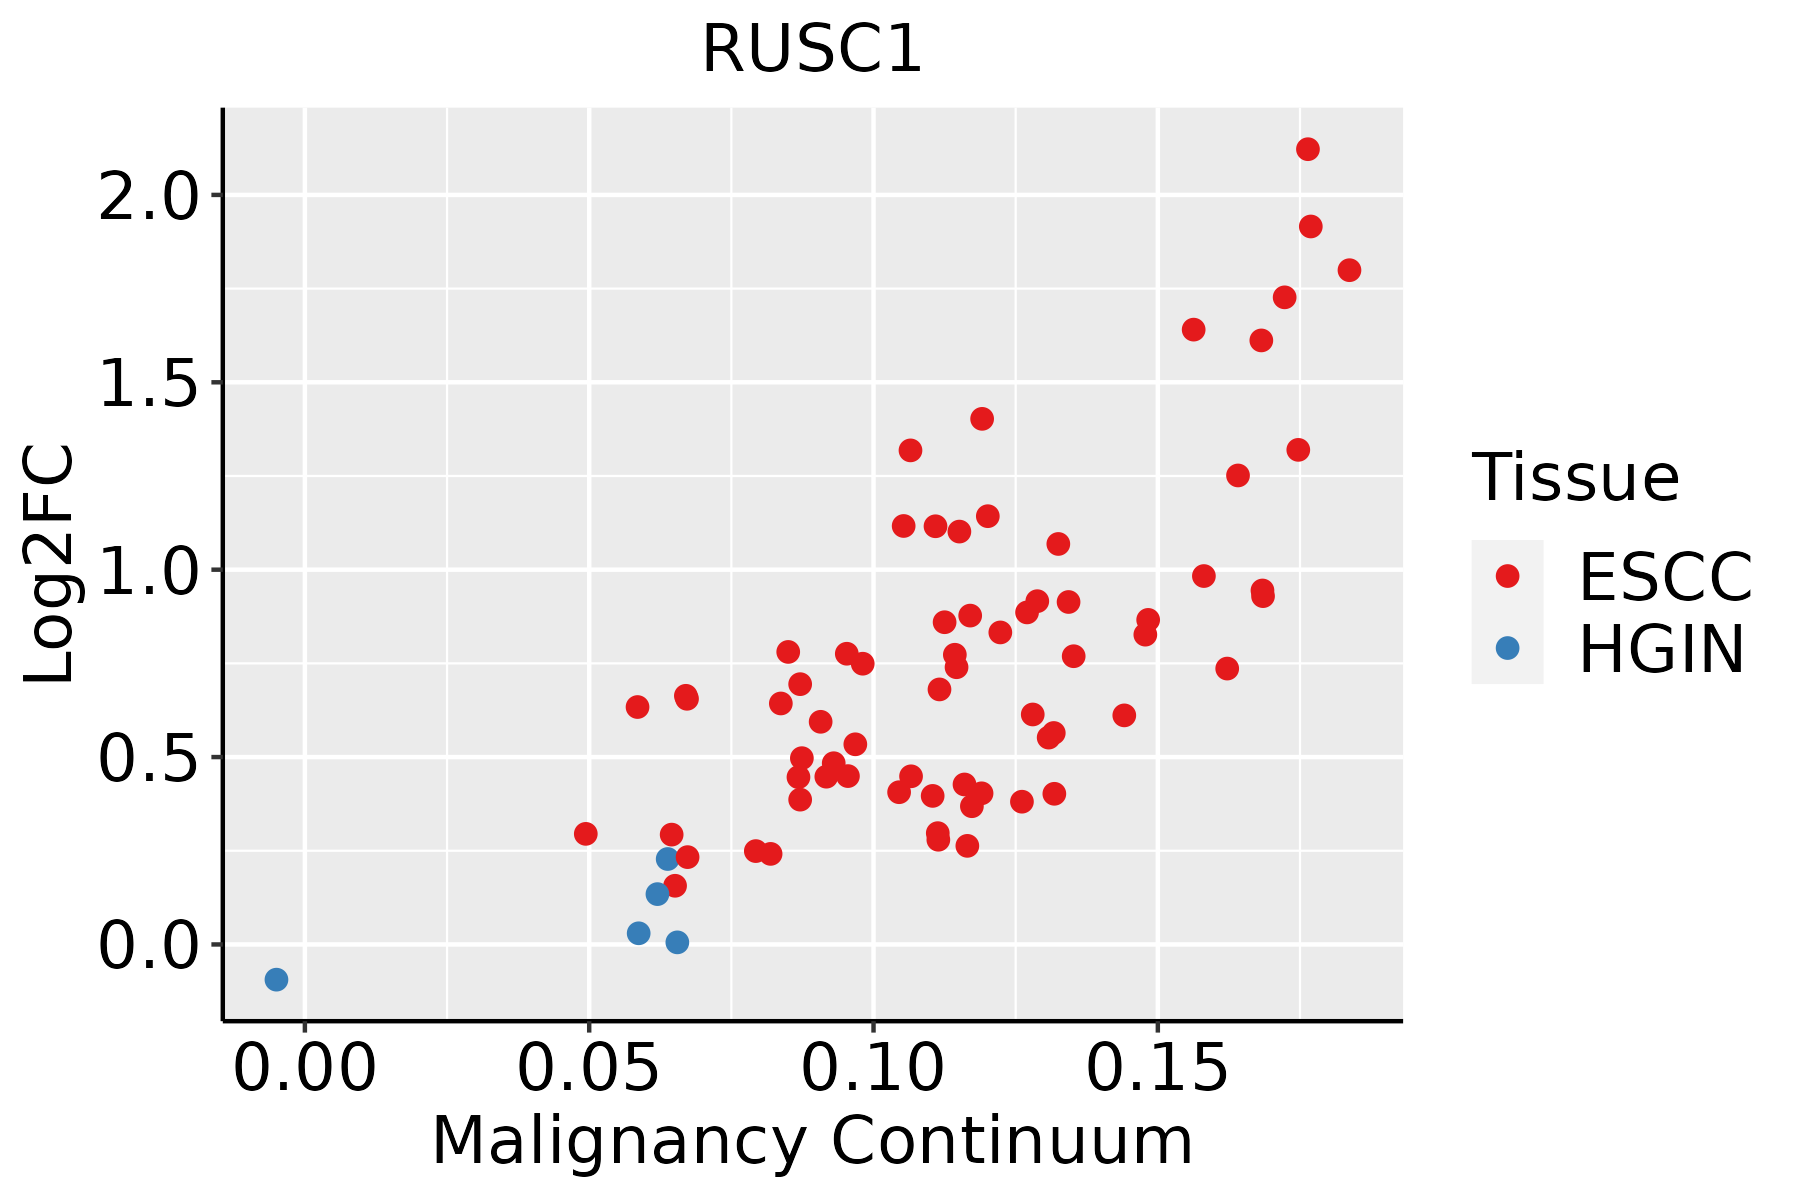 | ESCC: Esophageal squamous cell carcinoma |
| HGIN: High-grade intraepithelial neoplasias | ||
| LGIN: Low-grade intraepithelial neoplasias | ||
| Liver | 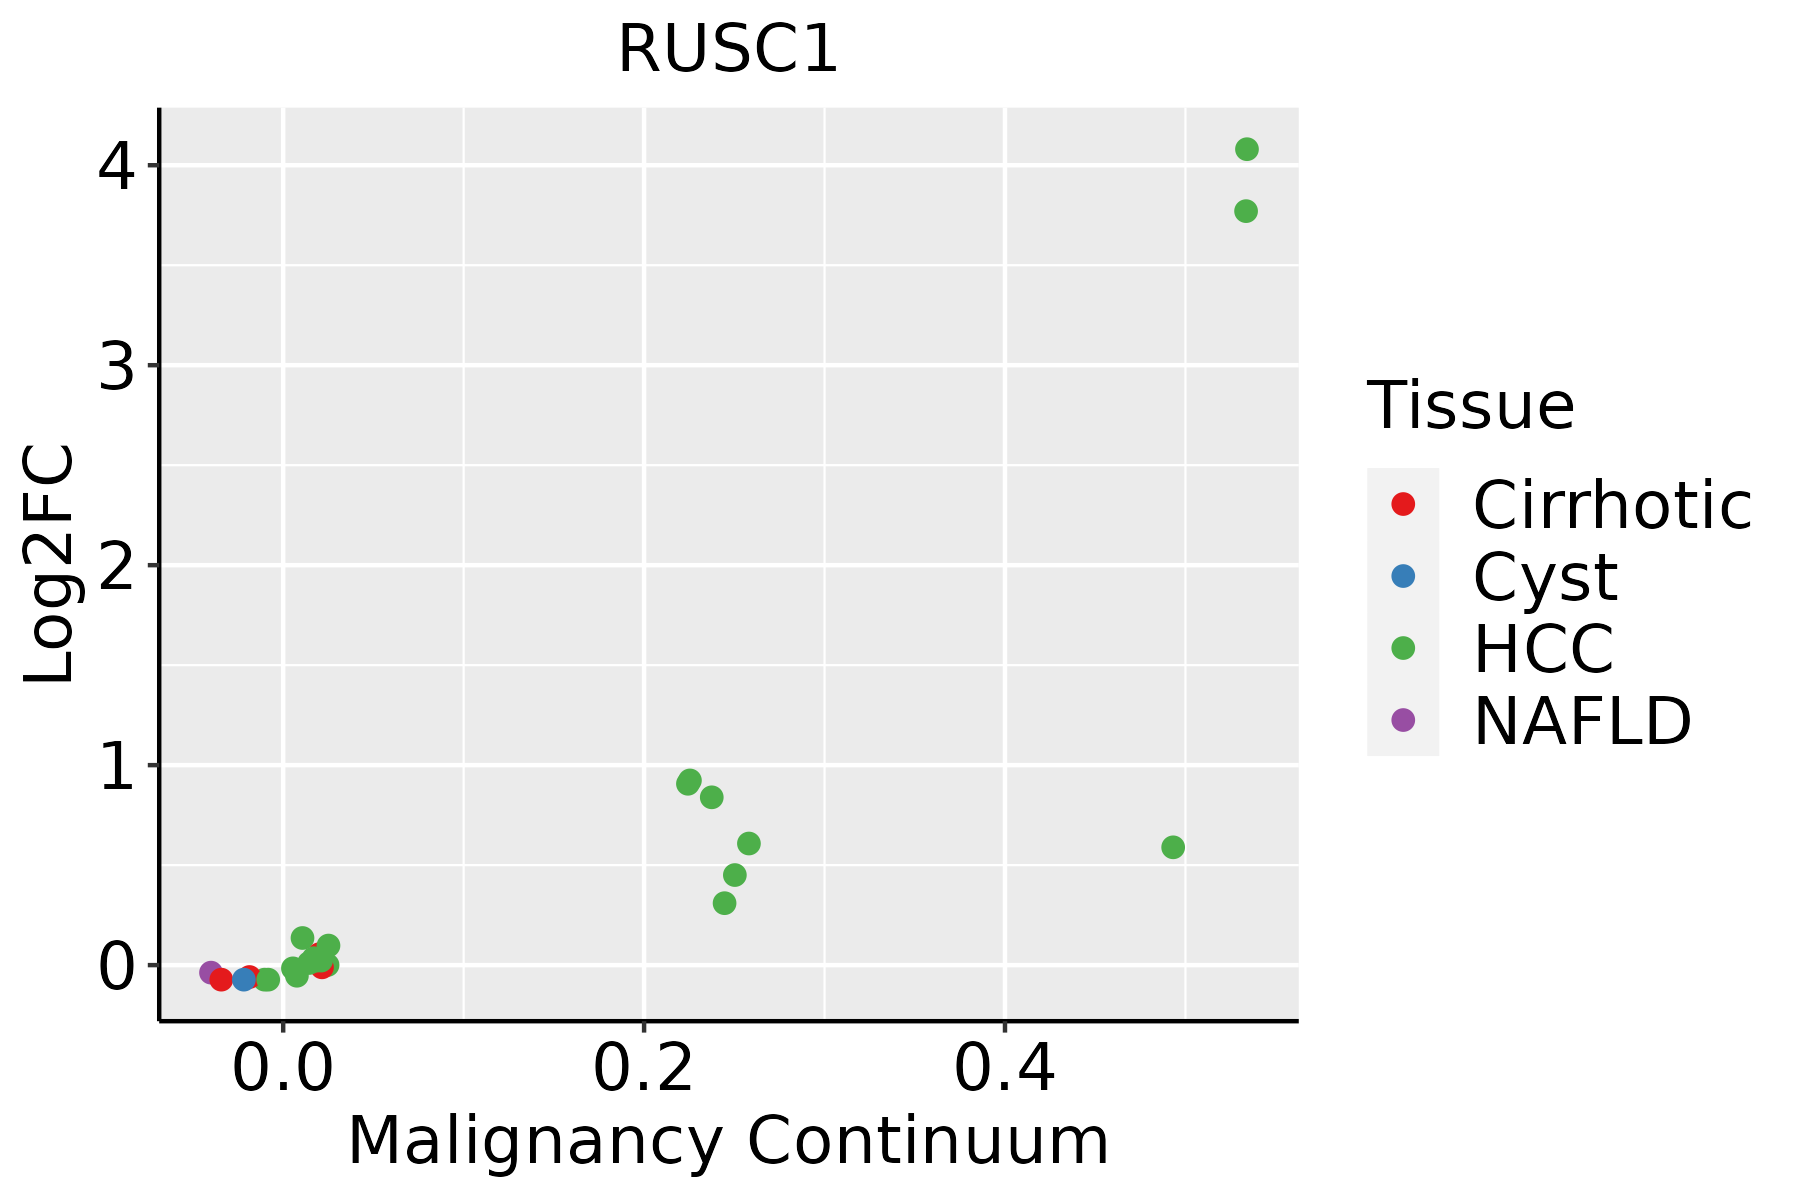 | HCC: Hepatocellular carcinoma |
| NAFLD: Non-alcoholic fatty liver disease | ||
| Oral Cavity | 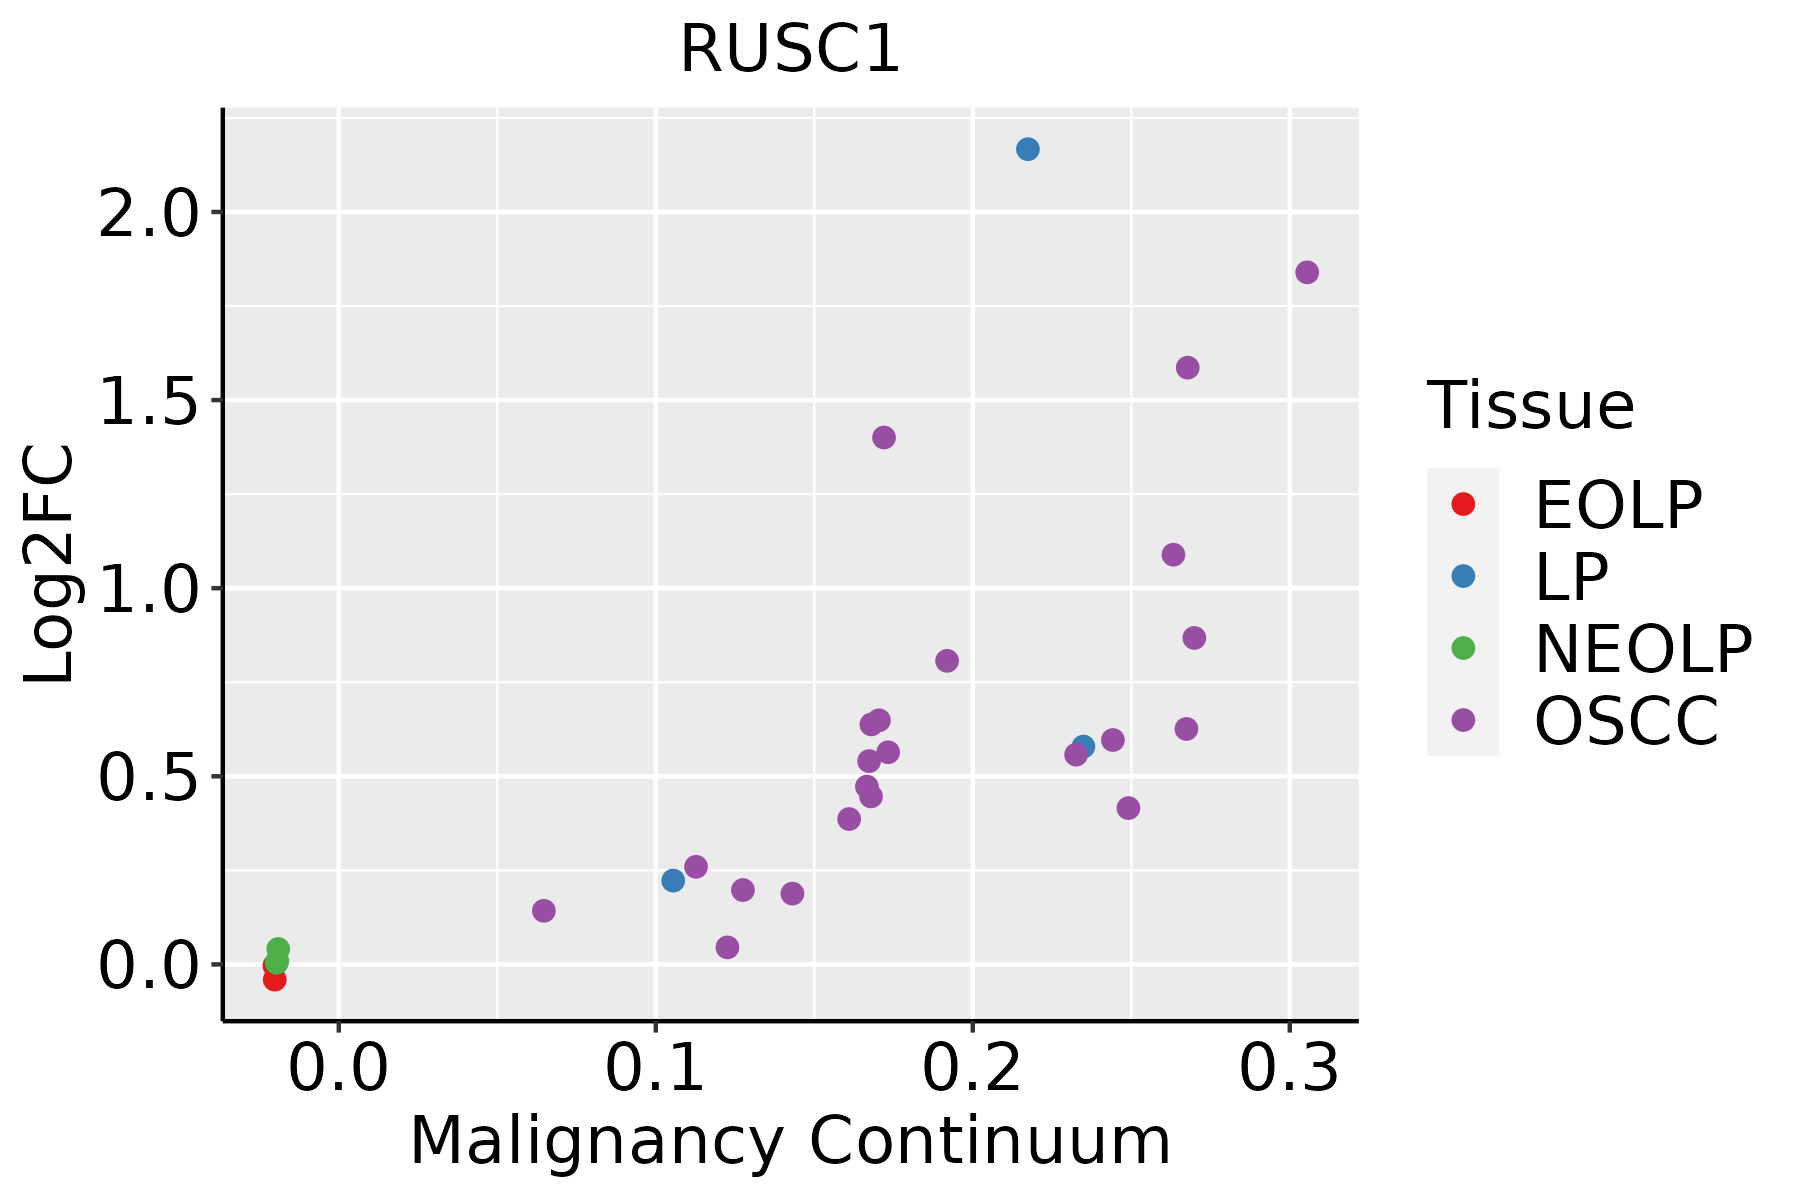 | EOLP: Erosive Oral lichen planus |
| LP: leukoplakia | ||
| NEOLP: Non-erosive oral lichen planus | ||
| OSCC: Oral squamous cell carcinoma | ||
| Prostate |  | BPH: Benign Prostatic Hyperplasia |
| Skin | 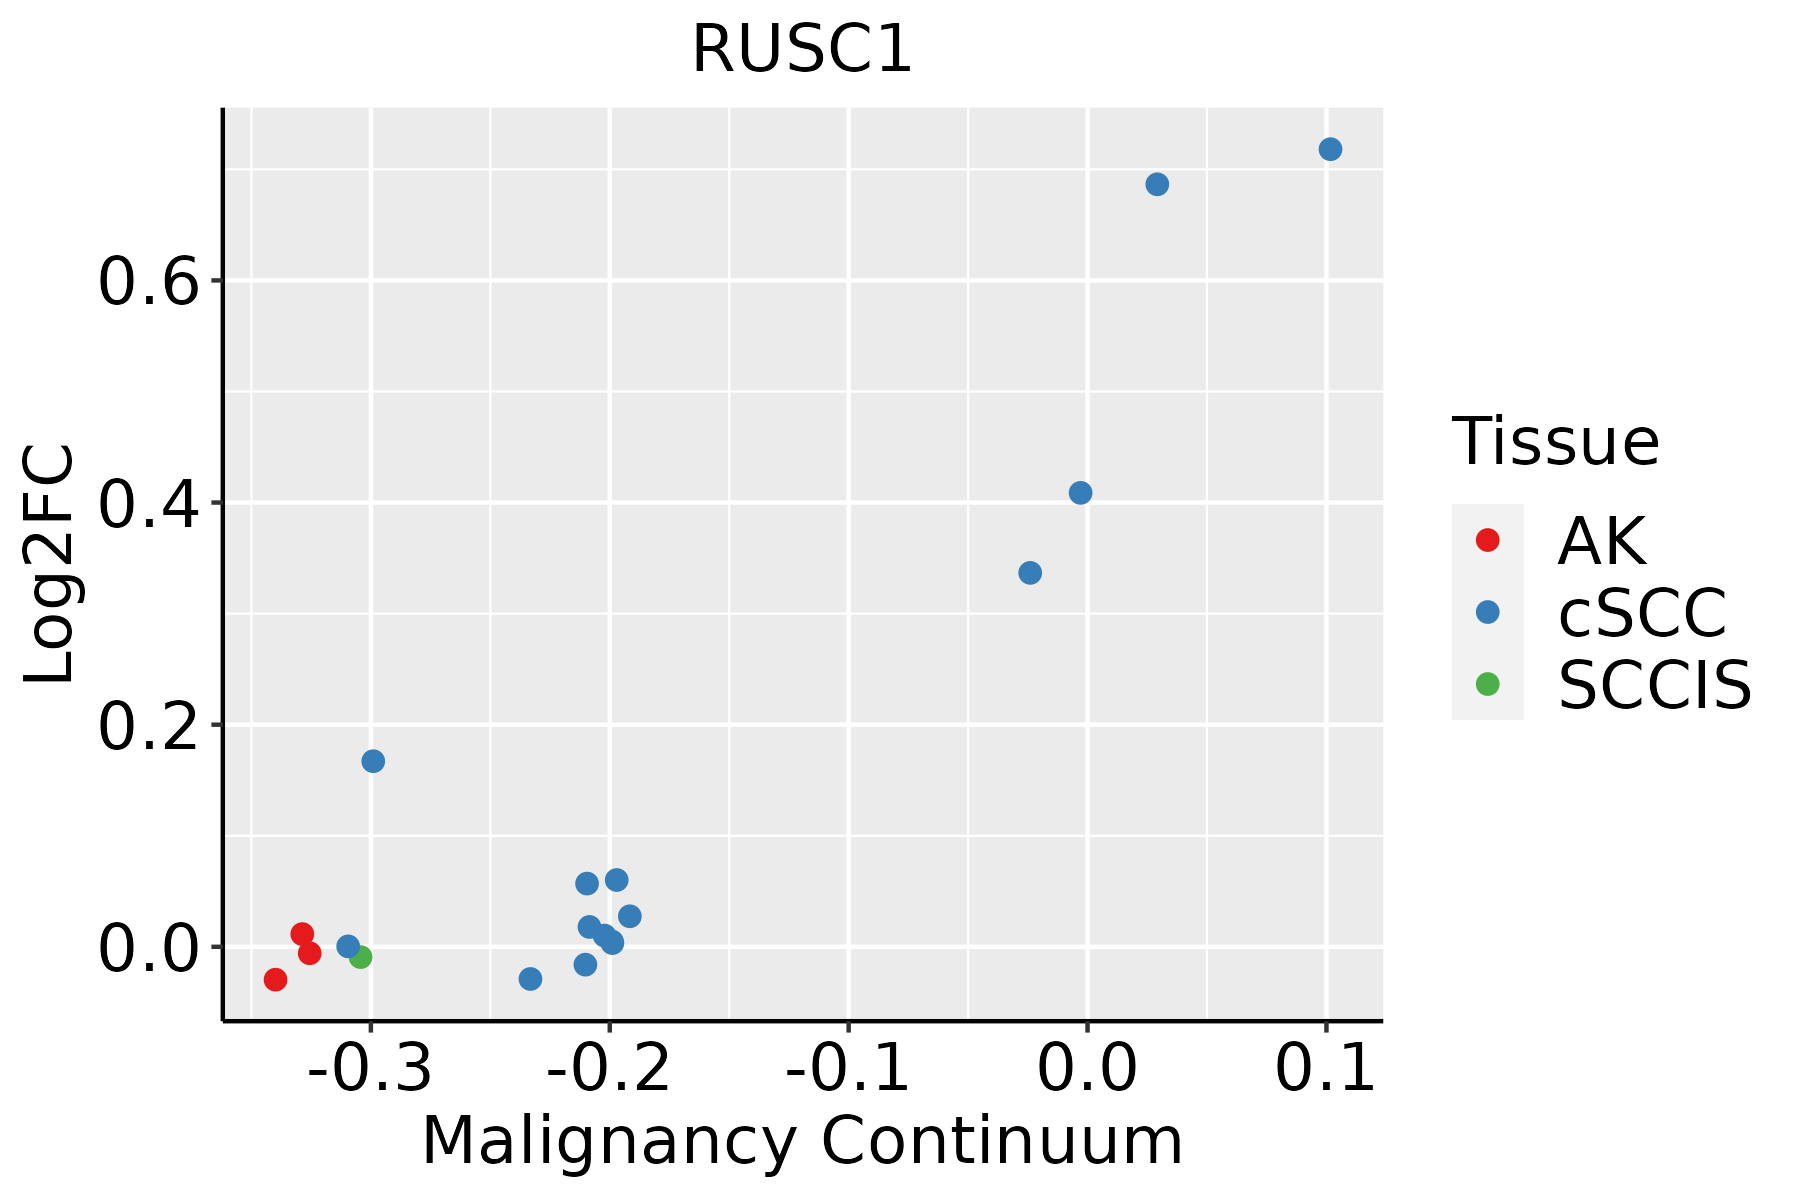 | AK: Actinic keratosis |
| cSCC: Cutaneous squamous cell carcinoma | ||
| SCCIS:squamous cell carcinoma in situ | ||
| Thyroid |  | ATC: Anaplastic thyroid cancer |
| HT: Hashimoto's thyroiditis | ||
| PTC: Papillary thyroid cancer |
| ∗log2FC in expression of this searched gene in stem-like cells from each diseased tissue sample relative to stem-like cells in normal samples in each tissue plotted against the malignancy continuum. Samples are colored based on if they are from different disease stage. |
Top |
Malignant transformation related pathway analysis |
| Find out the enriched GO biological processes and KEGG pathways involved in transition from healthy to precancer to cancer |
| Tissue | Disease Stage | Enriched GO biological Processes |
| Colorectum | AD |  |
| Colorectum | SER |  |
| Colorectum | MSS |  |
| Colorectum | MSI-H |  |
| Colorectum | FAP |  |
| ∗Top 15 enriched GO BP terms are showed in the bar plot of each disease state in each tissue. Each row represents a significant GO biological process which is colored according to the -log10(p.adjust). |
| Page: 1 2 3 4 5 6 7 8 9 |
| GO ID | Tissue | Disease Stage | Description | Gene Ratio | Bg Ratio | pvalue | p.adjust | Count |
| GO:0000209 | Colorectum | AD | protein polyubiquitination | 78/3918 | 236/18723 | 8.71e-06 | 2.06e-04 | 78 |
| GO:00002091 | Colorectum | SER | protein polyubiquitination | 58/2897 | 236/18723 | 1.69e-04 | 3.18e-03 | 58 |
| GO:00002092 | Colorectum | MSS | protein polyubiquitination | 72/3467 | 236/18723 | 5.19e-06 | 1.42e-04 | 72 |
| GO:000020917 | Esophagus | ESCC | protein polyubiquitination | 170/8552 | 236/18723 | 1.40e-16 | 1.09e-14 | 170 |
| GO:000020921 | Liver | HCC | protein polyubiquitination | 151/7958 | 236/18723 | 1.90e-11 | 7.59e-10 | 151 |
| GO:000020910 | Oral cavity | OSCC | protein polyubiquitination | 150/7305 | 236/18723 | 1.59e-14 | 9.27e-13 | 150 |
| GO:000020915 | Oral cavity | LP | protein polyubiquitination | 82/4623 | 236/18723 | 3.23e-04 | 3.26e-03 | 82 |
| GO:000020914 | Prostate | Tumor | protein polyubiquitination | 64/3246 | 236/18723 | 1.08e-04 | 1.03e-03 | 64 |
| GO:000020924 | Skin | cSCC | protein polyubiquitination | 103/4864 | 236/18723 | 2.57e-09 | 9.09e-08 | 103 |
| GO:000020920 | Thyroid | PTC | protein polyubiquitination | 128/5968 | 236/18723 | 7.81e-13 | 3.65e-11 | 128 |
| GO:0000209110 | Thyroid | ATC | protein polyubiquitination | 134/6293 | 236/18723 | 1.86e-13 | 9.20e-12 | 134 |
| Page: 1 |
| Pathway ID | Tissue | Disease Stage | Description | Gene Ratio | Bg Ratio | pvalue | p.adjust | qvalue | Count |
| Page: 1 |
Top |
Cell-cell communication analysis |
| Identification of potential cell-cell interactions between two cell types and their ligand-receptor pairs for different disease states |
| Ligand | Receptor | LRpair | Pathway | Tissue | Disease Stage |
| Page: 1 |
Top |
Single-cell gene regulatory network inference analysis |
| Find out the significant the regulons (TFs) and the target genes of each regulon across cell types for different disease states |
| TF | Cell Type | Tissue | Disease Stage | Target Gene | RSS | Regulon Activity |
| ∗The dot plots of a searched regulon are shown for all cell subpopulations in each disease state of each tissue based on the regulon specific score inferred using pySCENIC and by calculating the average expression. |
| Page: 1 |
Top |
Somatic mutation of malignant transformation related genes |
| Annotation of somatic variants for genes involved in malignant transformation |
| Hugo Symbol | Variant Class | Variant Classification | dbSNP RS | HGVSc | HGVSp | HGVSp Short | SWISSPROT | BIOTYPE | SIFT | PolyPhen | Tumor Sample Barcode | Tissue | Histology | Sex | Age | Stage | Therapy Types | Drugs | Outcome |
| RUSC1 | SNV | Missense_Mutation | novel | c.939N>G | p.Ile313Met | p.I313M | Q9BVN2 | protein_coding | deleterious_low_confidence(0) | benign(0.144) | TCGA-A1-A0SN-01 | Breast | breast invasive carcinoma | Female | <65 | I/II | Chemotherapy | ac | SD |
| RUSC1 | SNV | Missense_Mutation | novel | c.2614C>T | p.Arg872Cys | p.R872C | Q9BVN2 | protein_coding | deleterious(0.01) | probably_damaging(0.986) | TCGA-AN-A0FN-01 | Breast | breast invasive carcinoma | Female | <65 | I/II | Unknown | Unknown | SD |
| RUSC1 | SNV | Missense_Mutation | c.1906G>A | p.Ala636Thr | p.A636T | Q9BVN2 | protein_coding | deleterious(0.04) | probably_damaging(0.93) | TCGA-BH-A18G-01 | Breast | breast invasive carcinoma | Female | >=65 | I/II | Unknown | Unknown | SD | |
| RUSC1 | insertion | Nonsense_Mutation | novel | c.973_974insCCTGGCCTAGAATCAGTTCTTAACCCTAGCAGCACCCTAGTTTCACCT | p.Arg325delinsProTrpProArgIleSerSerTerProTerGlnHisProSerPheThrTrp | p.R325delinsPWPRISS*P*QHPSFTW | Q9BVN2 | protein_coding | TCGA-A8-A079-01 | Breast | breast invasive carcinoma | Female | >=65 | III/IV | Chemotherapy | 5-fluorouracil | SD | ||
| RUSC1 | insertion | In_Frame_Ins | novel | c.2615_2616insGCTCTTTAATGGCTTGAGATACTCTCTAGTGGCCAT | p.Arg872_Val873insLeuPheAsnGlyLeuArgTyrSerLeuValAlaIle | p.R872_V873insLFNGLRYSLVAI | Q9BVN2 | protein_coding | TCGA-AN-A0FN-01 | Breast | breast invasive carcinoma | Female | <65 | I/II | Unknown | Unknown | SD | ||
| RUSC1 | insertion | Frame_Shift_Ins | novel | c.1039_1040insGCAGCCAGCAGATG | p.Ser347CysfsTer79 | p.S347Cfs*79 | Q9BVN2 | protein_coding | TCGA-B6-A0IA-01 | Breast | breast invasive carcinoma | Female | <65 | I/II | Unknown | Unknown | SD | ||
| RUSC1 | insertion | Nonsense_Mutation | novel | c.1041_1042insGAGTTGACAAGCTGACGGCTGCT | p.Pro348GlufsTer5 | p.P348Efs*5 | Q9BVN2 | protein_coding | TCGA-B6-A0IA-01 | Breast | breast invasive carcinoma | Female | <65 | I/II | Unknown | Unknown | SD | ||
| RUSC1 | SNV | Missense_Mutation | c.321N>G | p.Ser107Arg | p.S107R | Q9BVN2 | protein_coding | deleterious_low_confidence(0) | probably_damaging(0.942) | TCGA-C5-A7UH-01 | Cervix | cervical & endocervical cancer | Female | <65 | III/IV | Chemotherapy | cisplatin | SD | |
| RUSC1 | SNV | Missense_Mutation | c.323N>T | p.Ser108Phe | p.S108F | Q9BVN2 | protein_coding | deleterious_low_confidence(0) | possibly_damaging(0.694) | TCGA-C5-A7UH-01 | Cervix | cervical & endocervical cancer | Female | <65 | III/IV | Chemotherapy | cisplatin | SD | |
| RUSC1 | SNV | Missense_Mutation | novel | c.380N>G | p.Pro127Arg | p.P127R | Q9BVN2 | protein_coding | deleterious_low_confidence(0) | probably_damaging(0.942) | TCGA-MA-AA41-01 | Cervix | cervical & endocervical cancer | Female | <65 | I/II | Unknown | Unknown | SD |
| Page: 1 2 3 4 5 6 7 8 |
Top |
Related drugs of malignant transformation related genes |
| Identification of chemicals and drugs interact with genes involved in malignant transfromation |
| (DGIdb 4.0) |
| Entrez ID | Symbol | Category | Interaction Types | Drug Claim Name | Drug Name | PMIDs |
| Page: 1 |

Copyright 2023-Present -The University of Texas Health Science Center at Houston |