
|
|||||
|
 | |
| |
| |
| |
| |
| |
|
Gene: RUNX2 |
Gene summary for RUNX2 |
| Gene information | Species | Human | Gene symbol | RUNX2 | Gene ID | 860 |
| Gene name | RUNX family transcription factor 2 | |
| Gene Alias | AML3 | |
| Cytomap | 6p21.1 | |
| Gene Type | protein-coding | GO ID | GO:0001501 | UniProtAcc | Q13950 |
Top |
Malignant transformation analysis |
| Identification of the aberrant gene expression in precancerous and cancerous lesions by comparing the gene expression of stem-like cells in diseased tissues with normal stem cells |
| Entrez ID | Symbol | Replicates | Species | Organ | Tissue | Adj P-value | Log2FC | Malignancy |
| 860 | RUNX2 | LZE6T | Human | Esophagus | ESCC | 7.09e-07 | 2.89e-01 | 0.0845 |
| 860 | RUNX2 | P1T-E | Human | Esophagus | ESCC | 6.63e-04 | 2.65e-01 | 0.0875 |
| 860 | RUNX2 | P2T-E | Human | Esophagus | ESCC | 1.80e-08 | 1.00e-01 | 0.1177 |
| 860 | RUNX2 | P5T-E | Human | Esophagus | ESCC | 1.25e-19 | 3.59e-01 | 0.1327 |
| 860 | RUNX2 | P8T-E | Human | Esophagus | ESCC | 2.02e-10 | 1.63e-01 | 0.0889 |
| 860 | RUNX2 | P11T-E | Human | Esophagus | ESCC | 1.67e-06 | 4.73e-01 | 0.1426 |
| 860 | RUNX2 | P15T-E | Human | Esophagus | ESCC | 6.91e-03 | 1.04e-01 | 0.1149 |
| 860 | RUNX2 | P17T-E | Human | Esophagus | ESCC | 5.74e-06 | 1.41e-01 | 0.1278 |
| 860 | RUNX2 | P19T-E | Human | Esophagus | ESCC | 3.40e-09 | 5.06e-01 | 0.1662 |
| 860 | RUNX2 | P21T-E | Human | Esophagus | ESCC | 1.24e-08 | 6.58e-02 | 0.1617 |
| 860 | RUNX2 | P22T-E | Human | Esophagus | ESCC | 3.47e-02 | 1.24e-01 | 0.1236 |
| 860 | RUNX2 | P24T-E | Human | Esophagus | ESCC | 1.78e-04 | 2.49e-01 | 0.1287 |
| 860 | RUNX2 | P26T-E | Human | Esophagus | ESCC | 2.10e-05 | 3.29e-02 | 0.1276 |
| 860 | RUNX2 | P32T-E | Human | Esophagus | ESCC | 6.89e-19 | 4.21e-01 | 0.1666 |
| 860 | RUNX2 | P36T-E | Human | Esophagus | ESCC | 1.01e-05 | 1.03e-01 | 0.1187 |
| 860 | RUNX2 | P37T-E | Human | Esophagus | ESCC | 4.08e-17 | 3.51e-01 | 0.1371 |
| 860 | RUNX2 | P40T-E | Human | Esophagus | ESCC | 3.38e-07 | 1.67e-01 | 0.109 |
| 860 | RUNX2 | P44T-E | Human | Esophagus | ESCC | 4.84e-05 | 2.62e-01 | 0.1096 |
| 860 | RUNX2 | P47T-E | Human | Esophagus | ESCC | 1.56e-17 | 2.68e-01 | 0.1067 |
| 860 | RUNX2 | P48T-E | Human | Esophagus | ESCC | 3.71e-07 | 7.98e-03 | 0.0959 |
| Page: 1 2 3 |
| Tissue | Expression Dynamics | Abbreviation |
| Endometrium |  | AEH: Atypical endometrial hyperplasia |
| EEC: Endometrioid Cancer | ||
| Esophagus |  | ESCC: Esophageal squamous cell carcinoma |
| HGIN: High-grade intraepithelial neoplasias | ||
| LGIN: Low-grade intraepithelial neoplasias | ||
| Prostate | 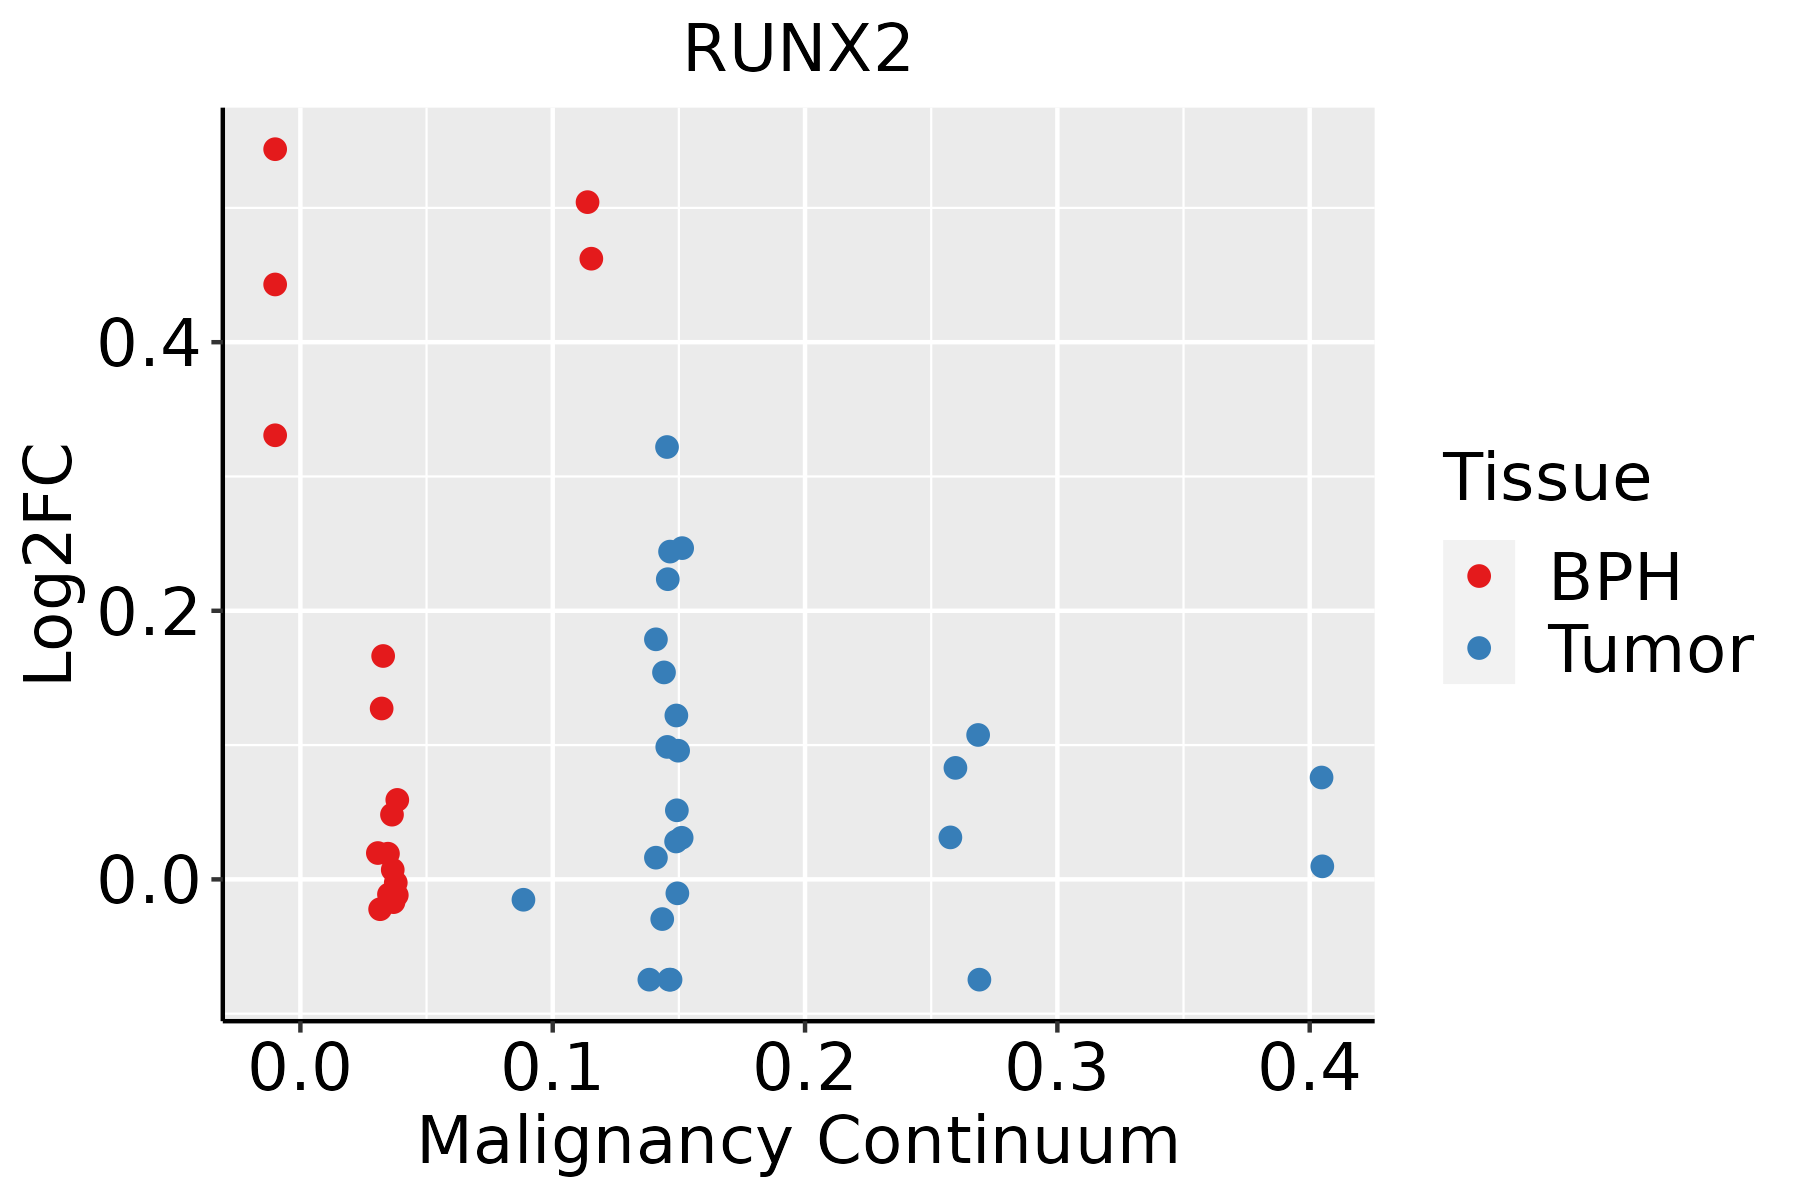 | BPH: Benign Prostatic Hyperplasia |
| Thyroid |  | ATC: Anaplastic thyroid cancer |
| HT: Hashimoto's thyroiditis | ||
| PTC: Papillary thyroid cancer |
| ∗log2FC in expression of this searched gene in stem-like cells from each diseased tissue sample relative to stem-like cells in normal samples in each tissue plotted against the malignancy continuum. Samples are colored based on if they are from different disease stage. |
Top |
Malignant transformation related pathway analysis |
| Find out the enriched GO biological processes and KEGG pathways involved in transition from healthy to precancer to cancer |
| Tissue | Disease Stage | Enriched GO biological Processes |
| Colorectum | AD |  |
| Colorectum | SER |  |
| Colorectum | MSS |  |
| Colorectum | MSI-H |  |
| Colorectum | FAP |  |
| ∗Top 15 enriched GO BP terms are showed in the bar plot of each disease state in each tissue. Each row represents a significant GO biological process which is colored according to the -log10(p.adjust). |
| Page: 1 2 3 4 5 6 7 8 9 |
| GO ID | Tissue | Disease Stage | Description | Gene Ratio | Bg Ratio | pvalue | p.adjust | Count |
| GO:000164918 | Esophagus | ESCC | osteoblast differentiation | 140/8552 | 229/18723 | 1.63e-06 | 1.95e-05 | 140 |
| GO:000150317 | Esophagus | ESCC | ossification | 232/8552 | 408/18723 | 3.00e-06 | 3.40e-05 | 232 |
| GO:00488638 | Esophagus | ESCC | stem cell differentiation | 122/8552 | 206/18723 | 5.95e-05 | 4.59e-04 | 122 |
| GO:000717810 | Esophagus | ESCC | transmembrane receptor protein serine/threonine kinase signaling pathway | 195/8552 | 355/18723 | 2.58e-04 | 1.58e-03 | 195 |
| GO:19015225 | Esophagus | ESCC | positive regulation of transcription from RNA polymerase II promoter involved in cellular response to chemical stimulus | 18/8552 | 22/18723 | 5.69e-04 | 3.10e-03 | 18 |
| GO:00485687 | Esophagus | ESCC | embryonic organ development | 228/8552 | 427/18723 | 7.28e-04 | 3.79e-03 | 228 |
| GO:004211018 | Esophagus | ESCC | T cell activation | 256/8552 | 487/18723 | 1.18e-03 | 5.87e-03 | 256 |
| GO:19031317 | Esophagus | ESCC | mononuclear cell differentiation | 226/8552 | 426/18723 | 1.20e-03 | 5.88e-03 | 226 |
| GO:00603485 | Esophagus | ESCC | bone development | 115/8552 | 205/18723 | 1.67e-03 | 7.72e-03 | 115 |
| GO:00487367 | Esophagus | ESCC | appendage development | 98/8552 | 172/18723 | 1.83e-03 | 8.37e-03 | 98 |
| GO:00601737 | Esophagus | ESCC | limb development | 98/8552 | 172/18723 | 1.83e-03 | 8.37e-03 | 98 |
| GO:00456675 | Esophagus | ESCC | regulation of osteoblast differentiation | 77/8552 | 132/18723 | 2.28e-03 | 1.00e-02 | 77 |
| GO:00456695 | Esophagus | ESCC | positive regulation of osteoblast differentiation | 43/8552 | 69/18723 | 3.93e-03 | 1.59e-02 | 43 |
| GO:00487052 | Esophagus | ESCC | skeletal system morphogenesis | 120/8552 | 220/18723 | 4.90e-03 | 1.89e-02 | 120 |
| GO:20000274 | Esophagus | ESCC | regulation of animal organ morphogenesis | 71/8552 | 125/18723 | 7.97e-03 | 2.84e-02 | 71 |
| GO:00302176 | Esophagus | ESCC | T cell differentiation | 137/8552 | 257/18723 | 8.09e-03 | 2.87e-02 | 137 |
| GO:19048881 | Esophagus | ESCC | cranial skeletal system development | 41/8552 | 68/18723 | 1.07e-02 | 3.66e-02 | 41 |
| GO:00512161 | Esophagus | ESCC | cartilage development | 103/8552 | 190/18723 | 1.08e-02 | 3.67e-02 | 103 |
| GO:00300984 | Esophagus | ESCC | lymphocyte differentiation | 192/8552 | 374/18723 | 1.52e-02 | 4.93e-02 | 192 |
| GO:00020623 | Esophagus | ESCC | chondrocyte differentiation | 60/8552 | 106/18723 | 1.53e-02 | 4.94e-02 | 60 |
| Page: 1 2 3 4 5 |
| Pathway ID | Tissue | Disease Stage | Description | Gene Ratio | Bg Ratio | pvalue | p.adjust | qvalue | Count |
| hsa052028 | Esophagus | ESCC | Transcriptional misregulation in cancer | 116/4205 | 193/8465 | 2.08e-03 | 5.95e-03 | 3.05e-03 | 116 |
| hsa0492816 | Esophagus | ESCC | Parathyroid hormone synthesis, secretion and action | 66/4205 | 106/8465 | 5.86e-03 | 1.47e-02 | 7.51e-03 | 66 |
| hsa0520213 | Esophagus | ESCC | Transcriptional misregulation in cancer | 116/4205 | 193/8465 | 2.08e-03 | 5.95e-03 | 3.05e-03 | 116 |
| hsa0492817 | Esophagus | ESCC | Parathyroid hormone synthesis, secretion and action | 66/4205 | 106/8465 | 5.86e-03 | 1.47e-02 | 7.51e-03 | 66 |
| hsa052027 | Prostate | BPH | Transcriptional misregulation in cancer | 53/1718 | 193/8465 | 9.56e-03 | 2.92e-02 | 1.81e-02 | 53 |
| hsa0520212 | Prostate | BPH | Transcriptional misregulation in cancer | 53/1718 | 193/8465 | 9.56e-03 | 2.92e-02 | 1.81e-02 | 53 |
| hsa0520221 | Prostate | Tumor | Transcriptional misregulation in cancer | 59/1791 | 193/8465 | 1.22e-03 | 5.26e-03 | 3.26e-03 | 59 |
| hsa0492822 | Prostate | Tumor | Parathyroid hormone synthesis, secretion and action | 35/1791 | 106/8465 | 2.89e-03 | 1.07e-02 | 6.67e-03 | 35 |
| hsa0520231 | Prostate | Tumor | Transcriptional misregulation in cancer | 59/1791 | 193/8465 | 1.22e-03 | 5.26e-03 | 3.26e-03 | 59 |
| hsa0492832 | Prostate | Tumor | Parathyroid hormone synthesis, secretion and action | 35/1791 | 106/8465 | 2.89e-03 | 1.07e-02 | 6.67e-03 | 35 |
| Page: 1 |
Top |
Cell-cell communication analysis |
| Identification of potential cell-cell interactions between two cell types and their ligand-receptor pairs for different disease states |
| Ligand | Receptor | LRpair | Pathway | Tissue | Disease Stage |
| Page: 1 |
Top |
Single-cell gene regulatory network inference analysis |
| Find out the significant the regulons (TFs) and the target genes of each regulon across cell types for different disease states |
| TF | Cell Type | Tissue | Disease Stage | Target Gene | RSS | Regulon Activity |
| RUNX2 | NK | Cervix | CC | THEMIS,AC022126.1,GLT1D1, etc. | 2.36e-01 |  |
| RUNX2 | STM | Colorectum | CRC | TRPM3,KIZ,LAMA2, etc. | 3.40e-01 |  |
| RUNX2 | TUF | Colorectum | CRC | TRPM3,KIZ,LAMA2, etc. | 4.09e-02 | |
| RUNX2 | STM | Colorectum | FAP | TRPM3,KIZ,LAMA2, etc. | 2.03e-01 |  |
| RUNX2 | ICAF | Colorectum | AD | MCTP2,PSD3,ADAM28, etc. | 3.80e-01 |  |
| RUNX2 | VFIB | Colorectum | AD | MCTP2,PSD3,ADAM28, etc. | 2.92e-01 | |
| RUNX2 | VFIB | Colorectum | ADJ | MCTP2,PSD3,ADAM28, etc. | 1.87e-01 |  |
| RUNX2 | INCAF | Colorectum | CRC | MCTP2,PSD3,ADAM28, etc. | 4.91e-01 | |
| RUNX2 | VFIB | Colorectum | FAP | MCTP2,PSD3,ADAM28, etc. | 3.20e-01 | |
| RUNX2 | INCAF | Colorectum | FAP | MCTP2,PSD3,ADAM28, etc. | 1.26e-01 | |
| ∗The dot plots of a searched regulon are shown for all cell subpopulations in each disease state of each tissue based on the regulon specific score inferred using pySCENIC and by calculating the average expression. |
| Page: 1 2 3 4 5 6 |
Top |
Somatic mutation of malignant transformation related genes |
| Annotation of somatic variants for genes involved in malignant transformation |
| Hugo Symbol | Variant Class | Variant Classification | dbSNP RS | HGVSc | HGVSp | HGVSp Short | SWISSPROT | BIOTYPE | SIFT | PolyPhen | Tumor Sample Barcode | Tissue | Histology | Sex | Age | Stage | Therapy Types | Drugs | Outcome |
| RUNX2 | SNV | Missense_Mutation | c.557G>T | p.Arg186Ile | p.R186I | Q13950 | protein_coding | deleterious(0) | probably_damaging(0.988) | TCGA-AC-A23H-01 | Breast | breast invasive carcinoma | Female | >=65 | I/II | Unknown | Unknown | PD | |
| RUNX2 | SNV | Missense_Mutation | c.1118C>G | p.Pro373Arg | p.P373R | Q13950 | protein_coding | tolerated(0.09) | probably_damaging(0.993) | TCGA-AR-A24Q-01 | Breast | breast invasive carcinoma | Female | <65 | I/II | Chemotherapy | doxorubicin | SD | |
| RUNX2 | SNV | Missense_Mutation | rs104893995 | c.506N>A | p.Arg169Gln | p.R169Q | Q13950 | protein_coding | deleterious(0) | probably_damaging(0.962) | TCGA-EW-A1IZ-01 | Breast | breast invasive carcinoma | Female | <65 | III/IV | Chemotherapy | taxotere | SD |
| RUNX2 | insertion | Frame_Shift_Ins | novel | c.1348_1349insA | p.Ser450TyrfsTer40 | p.S450Yfs*40 | Q13950 | protein_coding | TCGA-EW-A2FS-01 | Breast | breast invasive carcinoma | Female | <65 | I/II | Hormone Therapy | goserelin | SD | ||
| RUNX2 | SNV | Missense_Mutation | c.464N>T | p.Thr155Ile | p.T155I | Q13950 | protein_coding | deleterious(0.01) | probably_damaging(1) | TCGA-EK-A3GM-01 | Cervix | cervical & endocervical cancer | Female | >=65 | I/II | Unknown | Unknown | SD | |
| RUNX2 | SNV | Missense_Mutation | c.935N>T | p.Ser312Phe | p.S312F | Q13950 | protein_coding | deleterious(0.01) | benign(0.352) | TCGA-FU-A3HZ-01 | Cervix | cervical & endocervical cancer | Female | <65 | I/II | Chemotherapy | cisplatin | CR | |
| RUNX2 | SNV | Missense_Mutation | novel | c.1273C>T | p.Pro425Ser | p.P425S | Q13950 | protein_coding | deleterious(0) | probably_damaging(0.98) | TCGA-VS-A9UJ-01 | Cervix | cervical & endocervical cancer | Female | <65 | I/II | Unknown | Unknown | PD |
| RUNX2 | insertion | Frame_Shift_Ins | novel | c.959dupC | p.Leu321AlafsTer17 | p.L321Afs*17 | Q13950 | protein_coding | TCGA-DS-A3LQ-01 | Cervix | cervical & endocervical cancer | Female | <65 | III/IV | Chemotherapy | cisplatin | SD | ||
| RUNX2 | SNV | Missense_Mutation | rs147009083 | c.607N>A | p.Val203Ile | p.V203I | Q13950 | protein_coding | tolerated(0.05) | probably_damaging(0.919) | TCGA-A6-3809-01 | Colorectum | colon adenocarcinoma | Female | >=65 | I/II | Unknown | Unknown | SD |
| RUNX2 | SNV | Missense_Mutation | c.1345N>G | p.Thr449Ala | p.T449A | Q13950 | protein_coding | tolerated(0.43) | benign(0.162) | TCGA-AA-3710-01 | Colorectum | colon adenocarcinoma | Female | >=65 | I/II | Unknown | Unknown | SD |
| Page: 1 2 3 4 5 6 7 8 |
Top |
Related drugs of malignant transformation related genes |
| Identification of chemicals and drugs interact with genes involved in malignant transfromation |
| (DGIdb 4.0) |
| Entrez ID | Symbol | Category | Interaction Types | Drug Claim Name | Drug Name | PMIDs |
| 860 | RUNX2 | CLINICALLY ACTIONABLE, TRANSCRIPTION FACTOR COMPLEX, TRANSCRIPTION FACTOR | ANTISENSE OLIGONUCLEOTIDES | 10722711 |
| Page: 1 |

Copyright 2023-Present -The University of Texas Health Science Center at Houston |