
|
|||||
|
 | |
| |
| |
| |
| |
| |
|
Gene: RUNX1 |
Gene summary for RUNX1 |
| Gene information | Species | Human | Gene symbol | RUNX1 | Gene ID | 861 |
| Gene name | RUNX family transcription factor 1 | |
| Gene Alias | AML1 | |
| Cytomap | 21q22.12 | |
| Gene Type | protein-coding | GO ID | GO:0000122 | UniProtAcc | Q01196 |
Top |
Malignant transformation analysis |
| Identification of the aberrant gene expression in precancerous and cancerous lesions by comparing the gene expression of stem-like cells in diseased tissues with normal stem cells |
| Entrez ID | Symbol | Replicates | Species | Organ | Tissue | Adj P-value | Log2FC | Malignancy |
| 861 | RUNX1 | GSM4909281 | Human | Breast | IDC | 2.12e-12 | -4.91e-01 | 0.21 |
| 861 | RUNX1 | GSM4909282 | Human | Breast | IDC | 5.79e-04 | -4.07e-01 | -0.0288 |
| 861 | RUNX1 | GSM4909285 | Human | Breast | IDC | 1.45e-02 | -2.38e-01 | 0.21 |
| 861 | RUNX1 | GSM4909286 | Human | Breast | IDC | 6.57e-07 | -2.44e-01 | 0.1081 |
| 861 | RUNX1 | GSM4909287 | Human | Breast | IDC | 3.72e-03 | -2.84e-01 | 0.2057 |
| 861 | RUNX1 | GSM4909290 | Human | Breast | IDC | 6.98e-07 | -3.88e-01 | 0.2096 |
| 861 | RUNX1 | GSM4909291 | Human | Breast | IDC | 5.72e-08 | -4.76e-01 | 0.1753 |
| 861 | RUNX1 | GSM4909293 | Human | Breast | IDC | 1.93e-09 | -4.85e-01 | 0.1581 |
| 861 | RUNX1 | GSM4909294 | Human | Breast | IDC | 2.58e-13 | -5.08e-01 | 0.2022 |
| 861 | RUNX1 | GSM4909296 | Human | Breast | IDC | 3.83e-05 | -2.33e-01 | 0.1524 |
| 861 | RUNX1 | GSM4909297 | Human | Breast | IDC | 2.69e-15 | -3.95e-01 | 0.1517 |
| 861 | RUNX1 | GSM4909298 | Human | Breast | IDC | 3.90e-03 | -3.47e-01 | 0.1551 |
| 861 | RUNX1 | GSM4909301 | Human | Breast | IDC | 5.26e-03 | -3.02e-01 | 0.1577 |
| 861 | RUNX1 | GSM4909302 | Human | Breast | IDC | 1.93e-02 | 3.50e-01 | 0.1545 |
| 861 | RUNX1 | GSM4909304 | Human | Breast | IDC | 2.47e-22 | 5.48e-01 | 0.1636 |
| 861 | RUNX1 | GSM4909309 | Human | Breast | IDC | 2.18e-02 | -2.80e-01 | 0.0483 |
| 861 | RUNX1 | GSM4909311 | Human | Breast | IDC | 3.92e-27 | -5.21e-01 | 0.1534 |
| 861 | RUNX1 | GSM4909312 | Human | Breast | IDC | 1.52e-07 | 1.83e-01 | 0.1552 |
| 861 | RUNX1 | GSM4909316 | Human | Breast | IDC | 6.03e-03 | -1.97e-01 | 0.21 |
| 861 | RUNX1 | GSM4909317 | Human | Breast | IDC | 1.02e-05 | -3.74e-01 | 0.1355 |
| Page: 1 2 3 4 5 6 7 8 9 10 |
| Tissue | Expression Dynamics | Abbreviation |
| Breast | 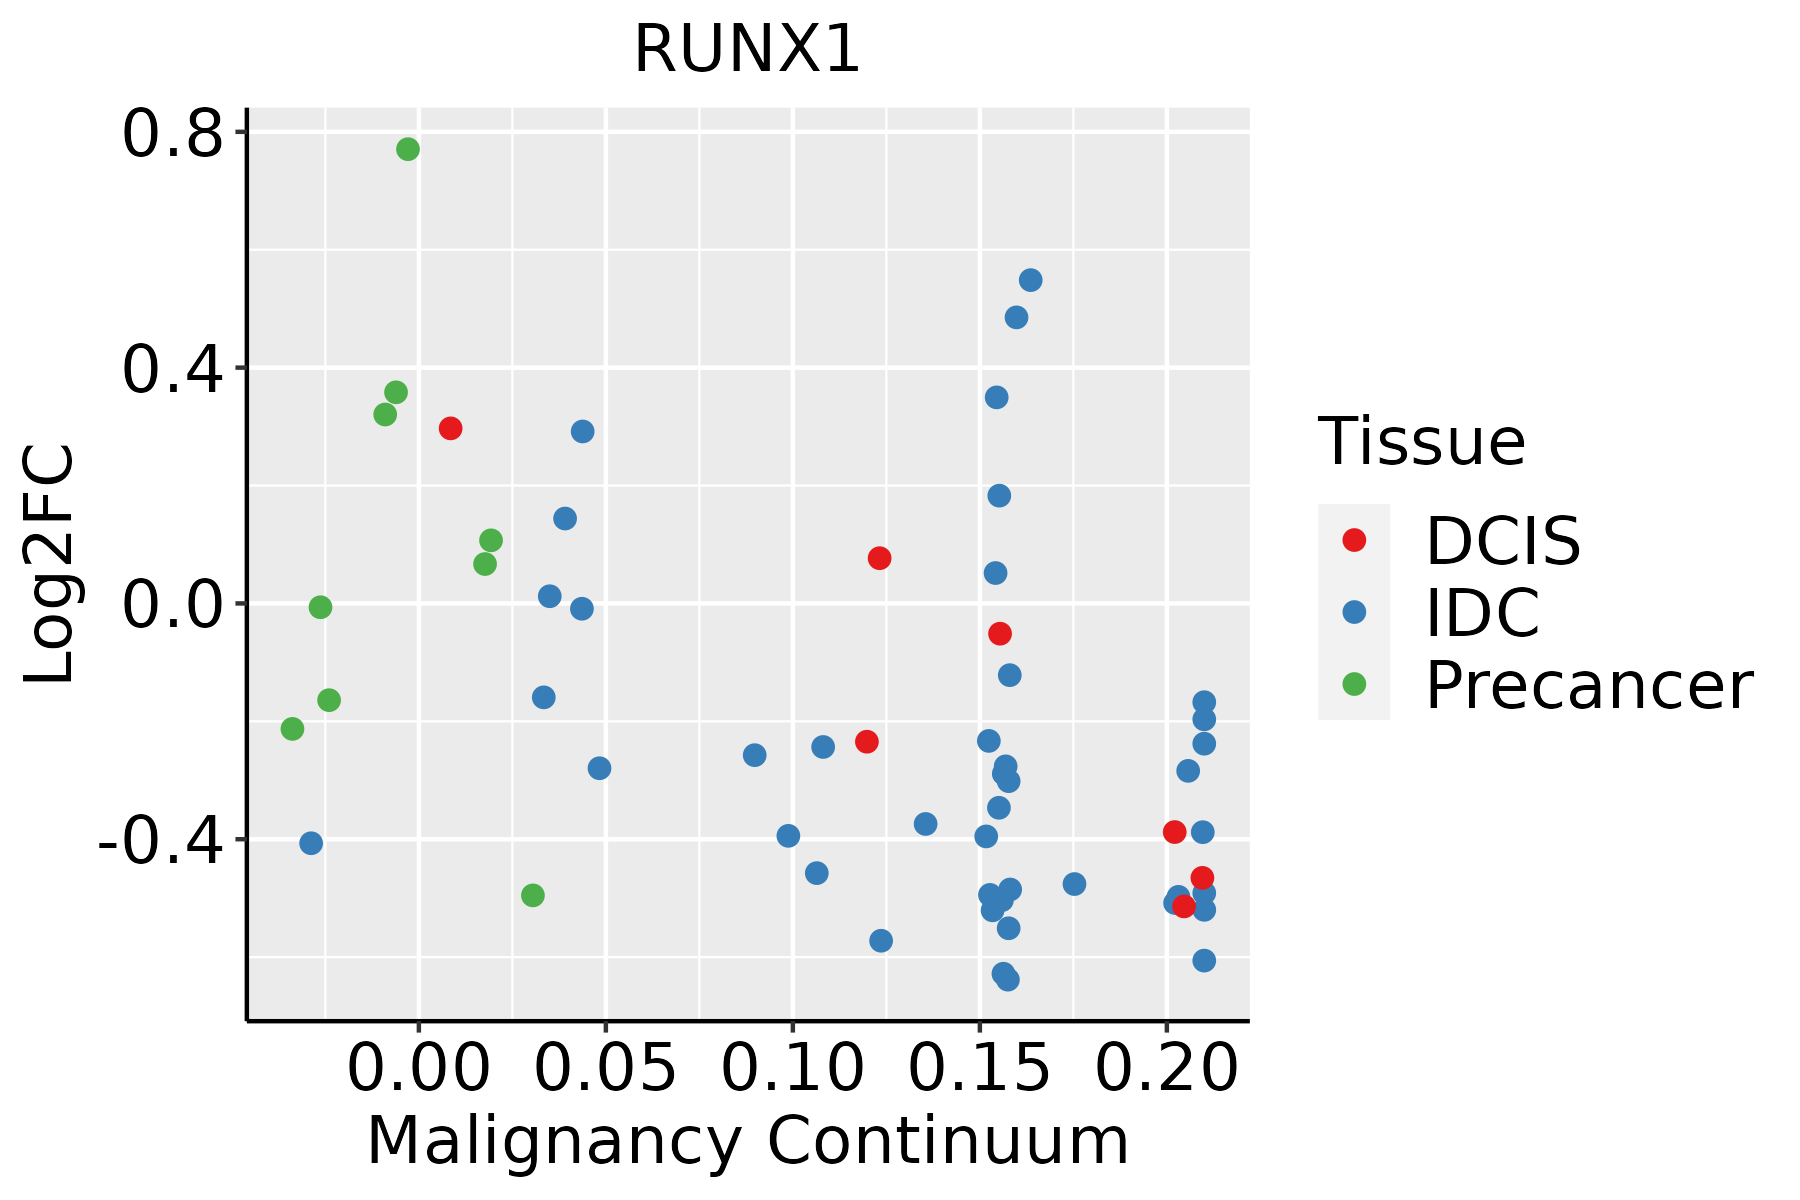 | IDC: Invasive ductal carcinoma |
| DCIS: Ductal carcinoma in situ | ||
| Precancer(BRCA1-mut): Precancerous lesion from BRCA1 mutation carriers | ||
| Cervix | 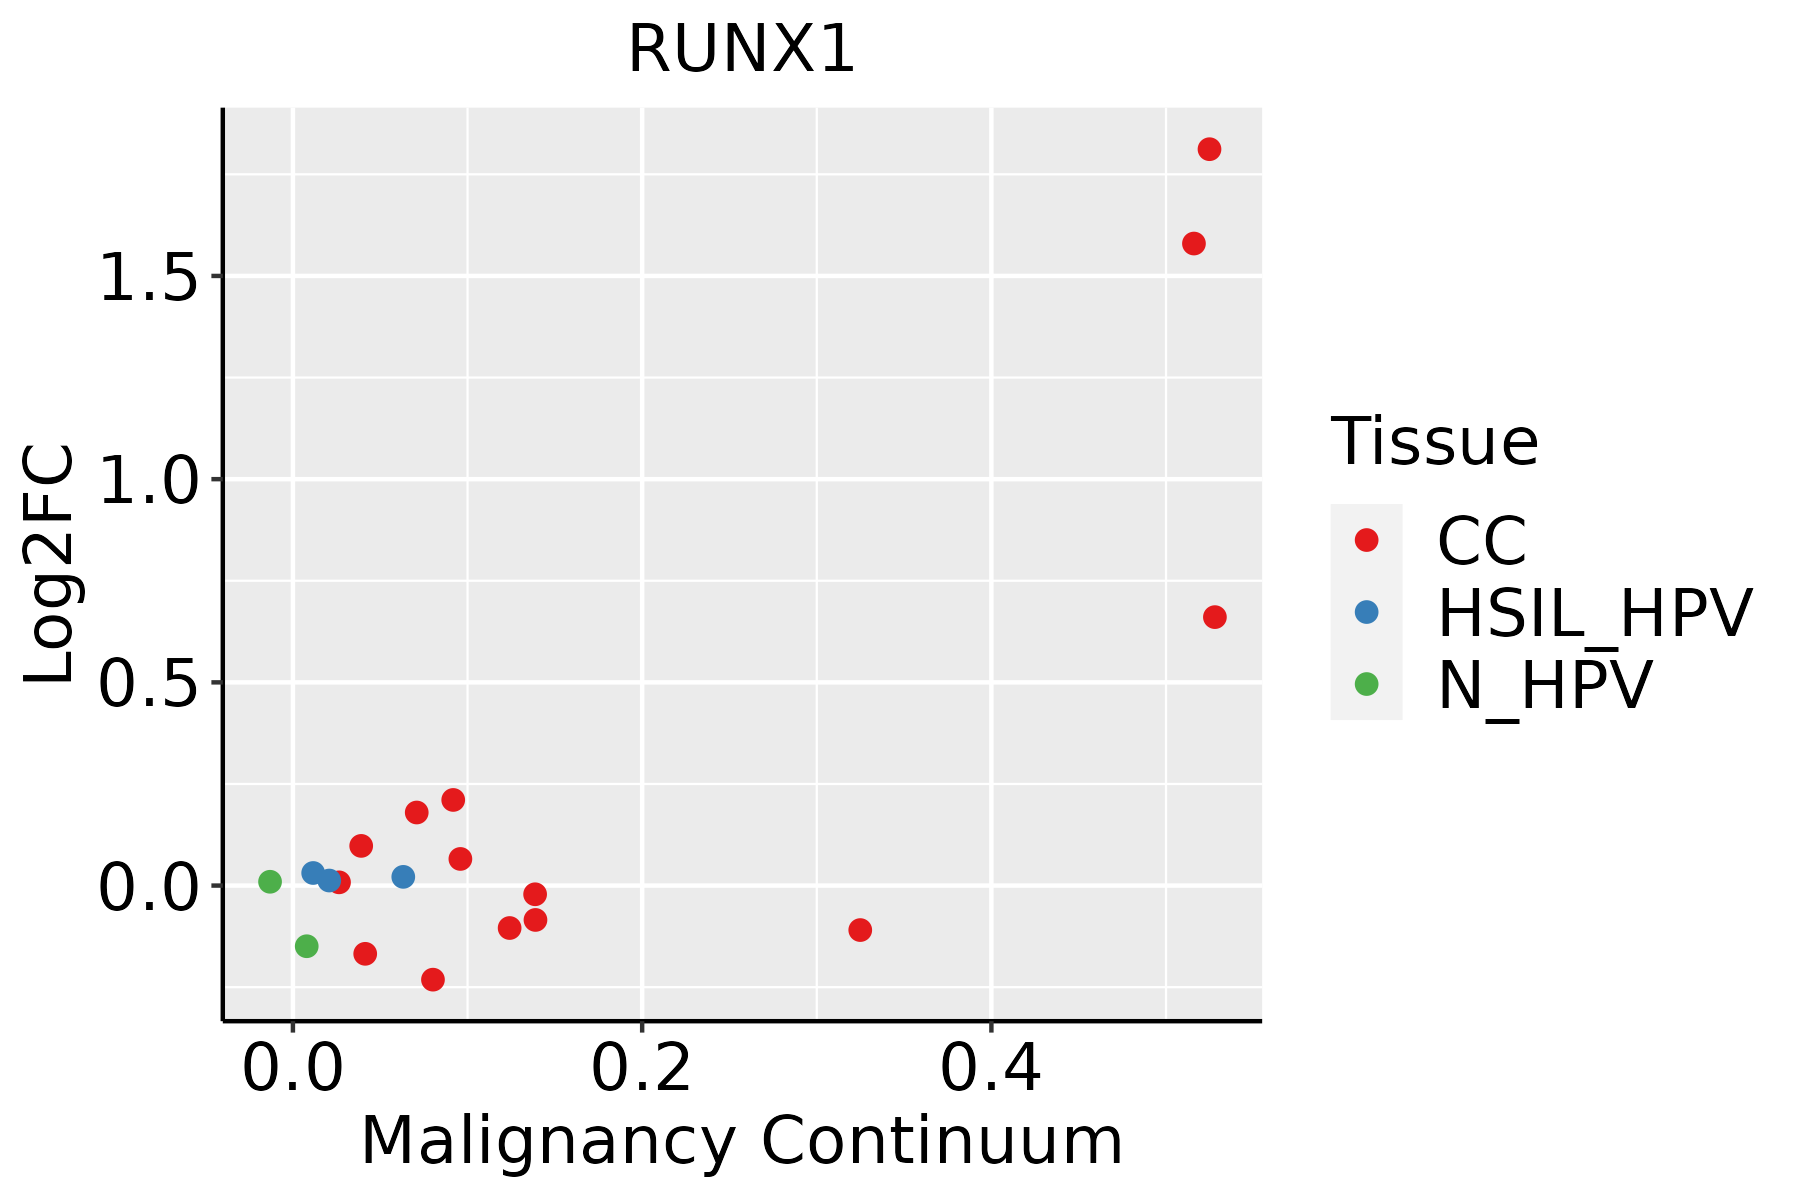 | CC: Cervix cancer |
| HSIL_HPV: HPV-infected high-grade squamous intraepithelial lesions | ||
| N_HPV: HPV-infected normal cervix | ||
| Colorectum (GSE201348) | 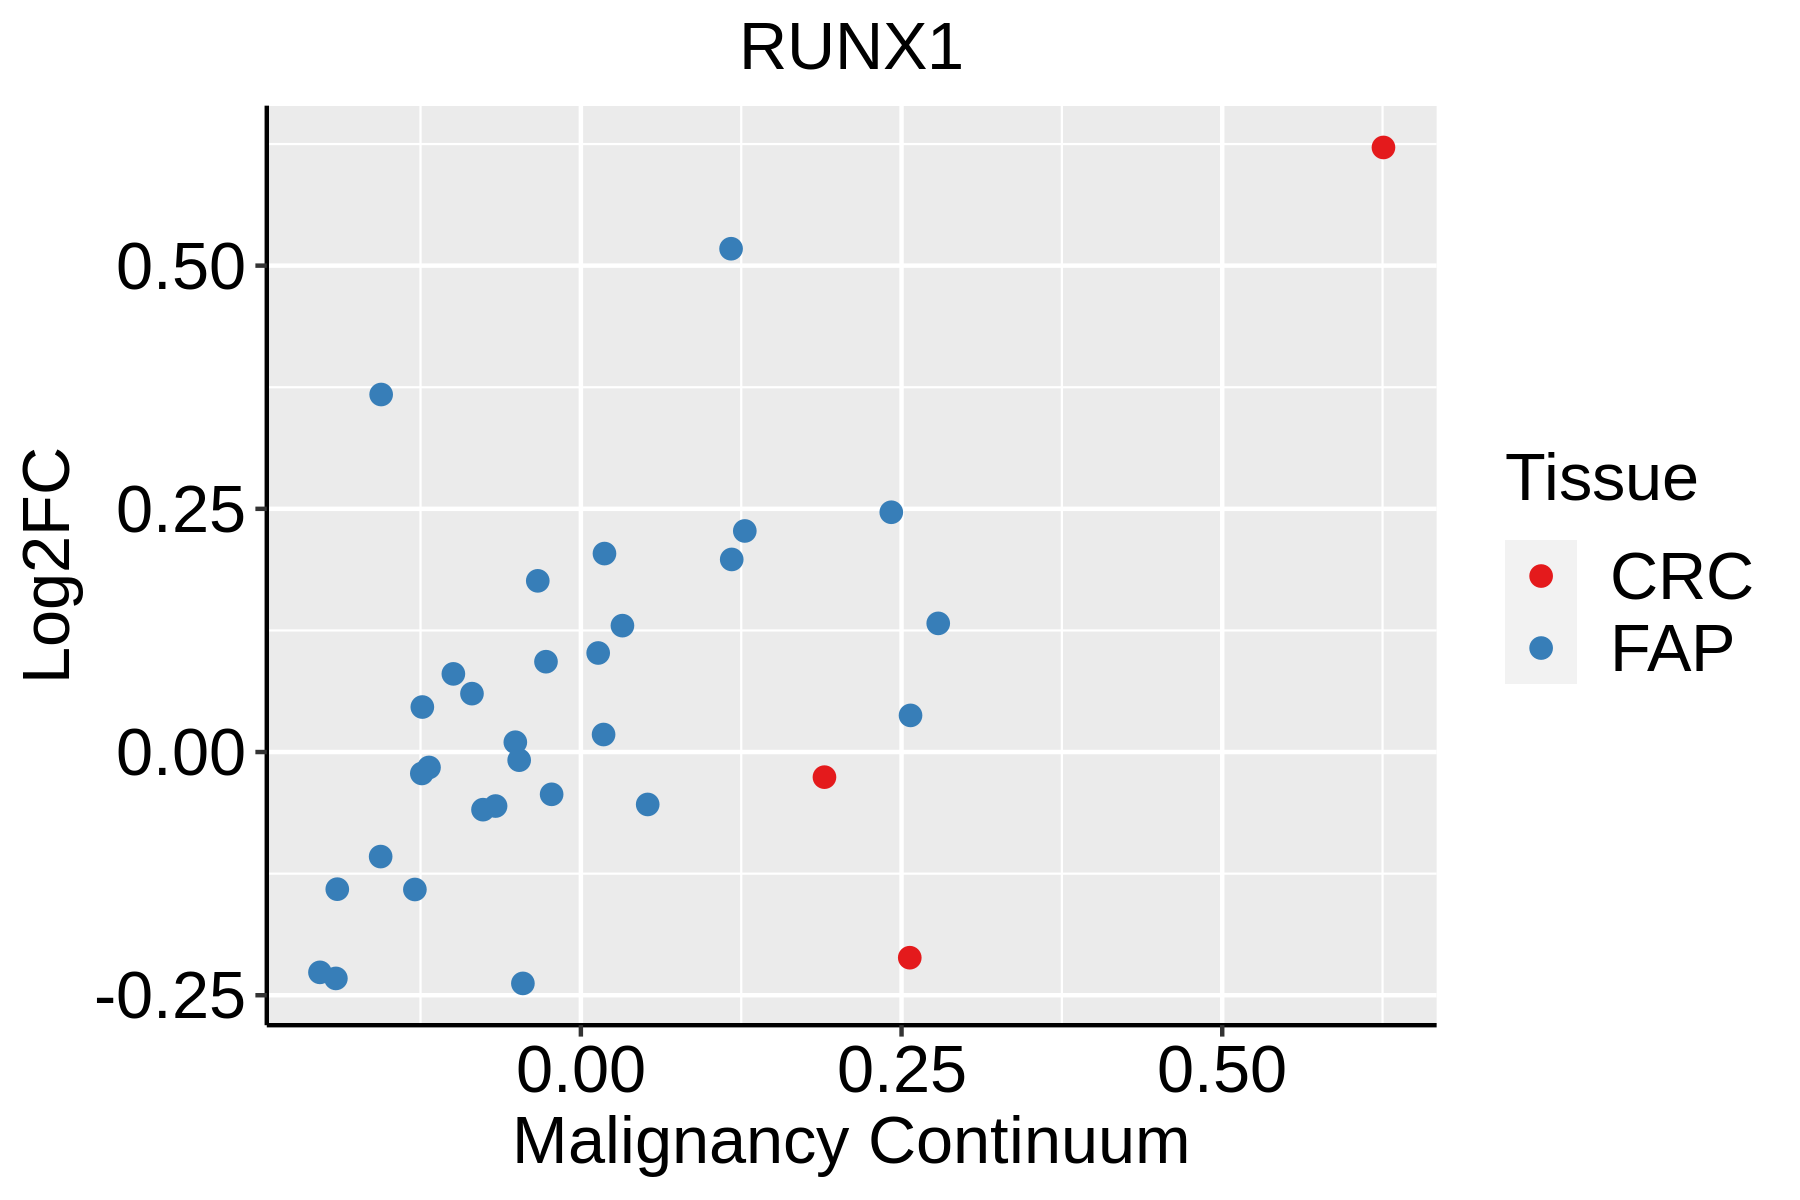 | FAP: Familial adenomatous polyposis |
| CRC: Colorectal cancer | ||
| Colorectum (HTA11) |  | AD: Adenomas |
| SER: Sessile serrated lesions | ||
| MSI-H: Microsatellite-high colorectal cancer | ||
| MSS: Microsatellite stable colorectal cancer | ||
| Esophagus | 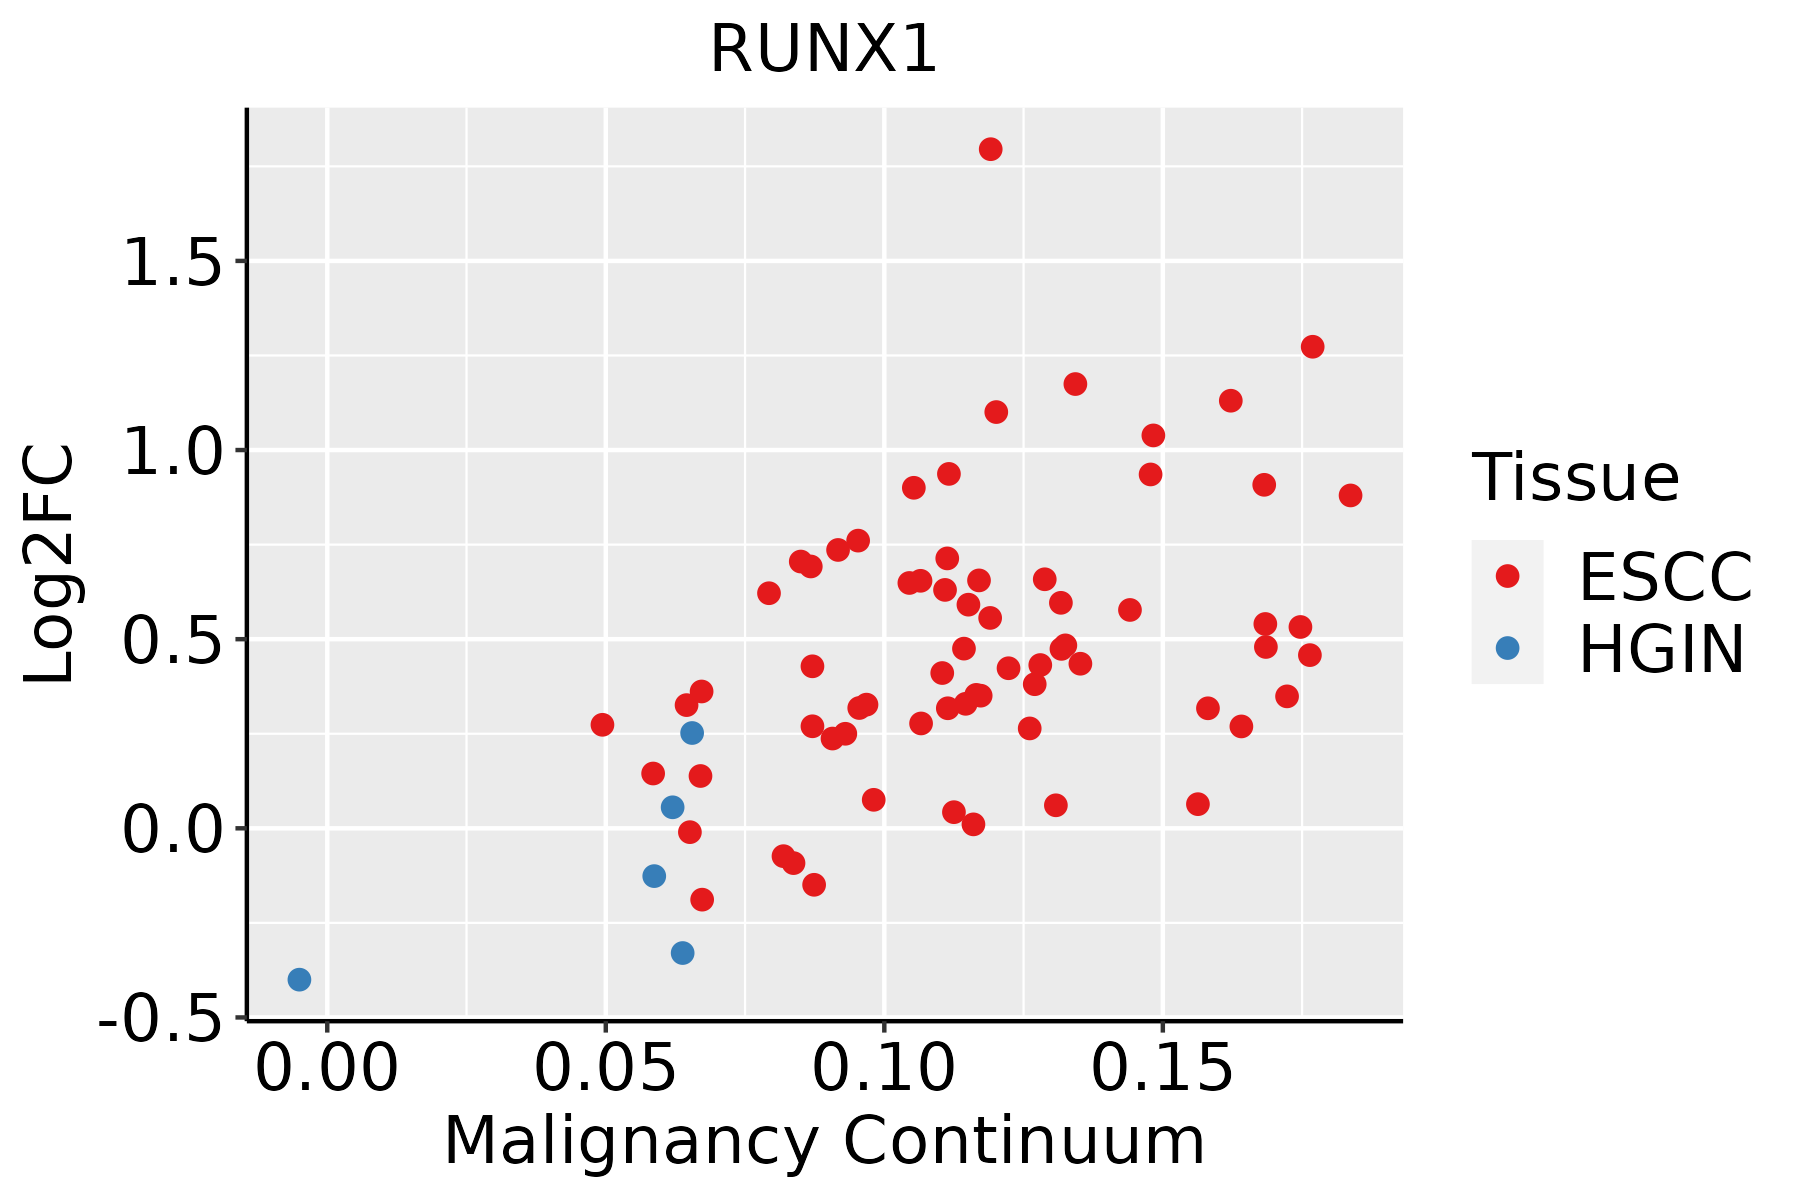 | ESCC: Esophageal squamous cell carcinoma |
| HGIN: High-grade intraepithelial neoplasias | ||
| LGIN: Low-grade intraepithelial neoplasias | ||
| Liver | 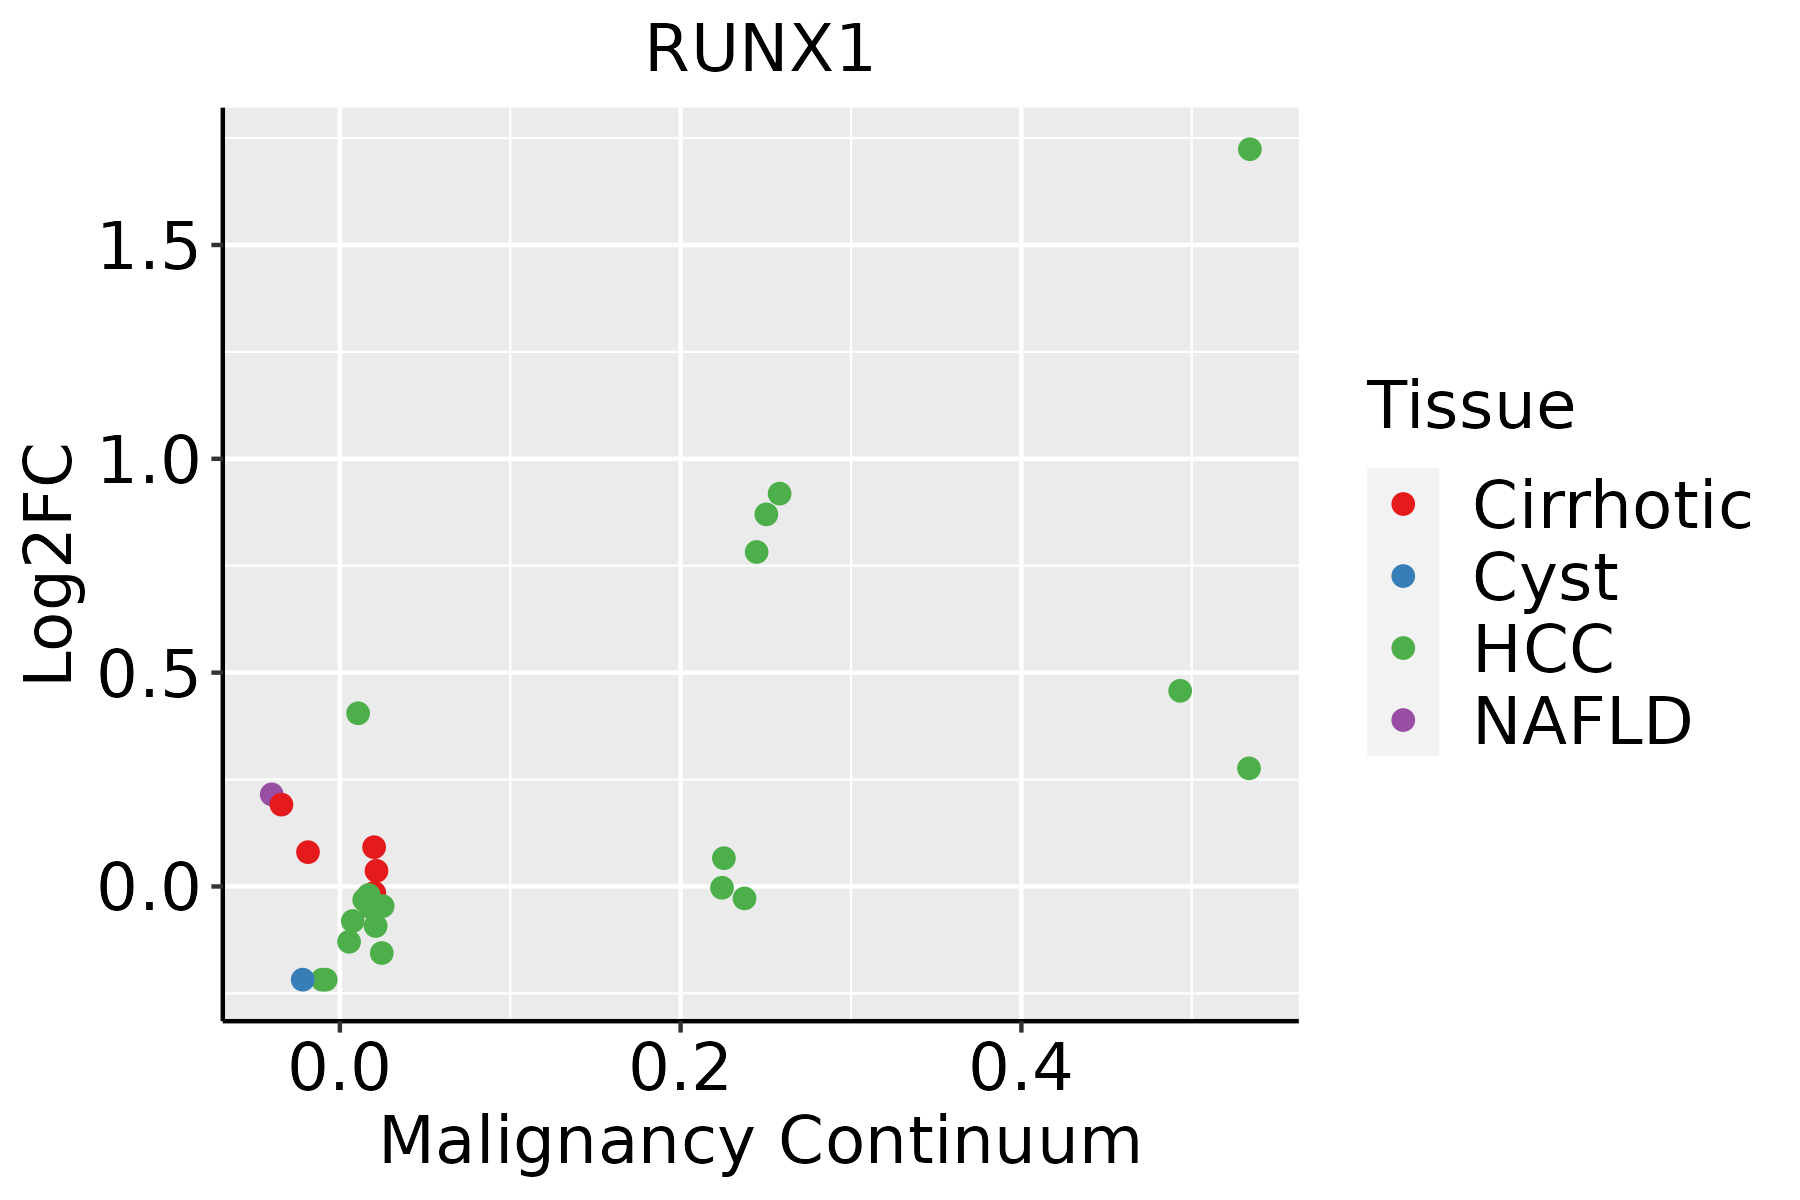 | HCC: Hepatocellular carcinoma |
| NAFLD: Non-alcoholic fatty liver disease | ||
| Lung | 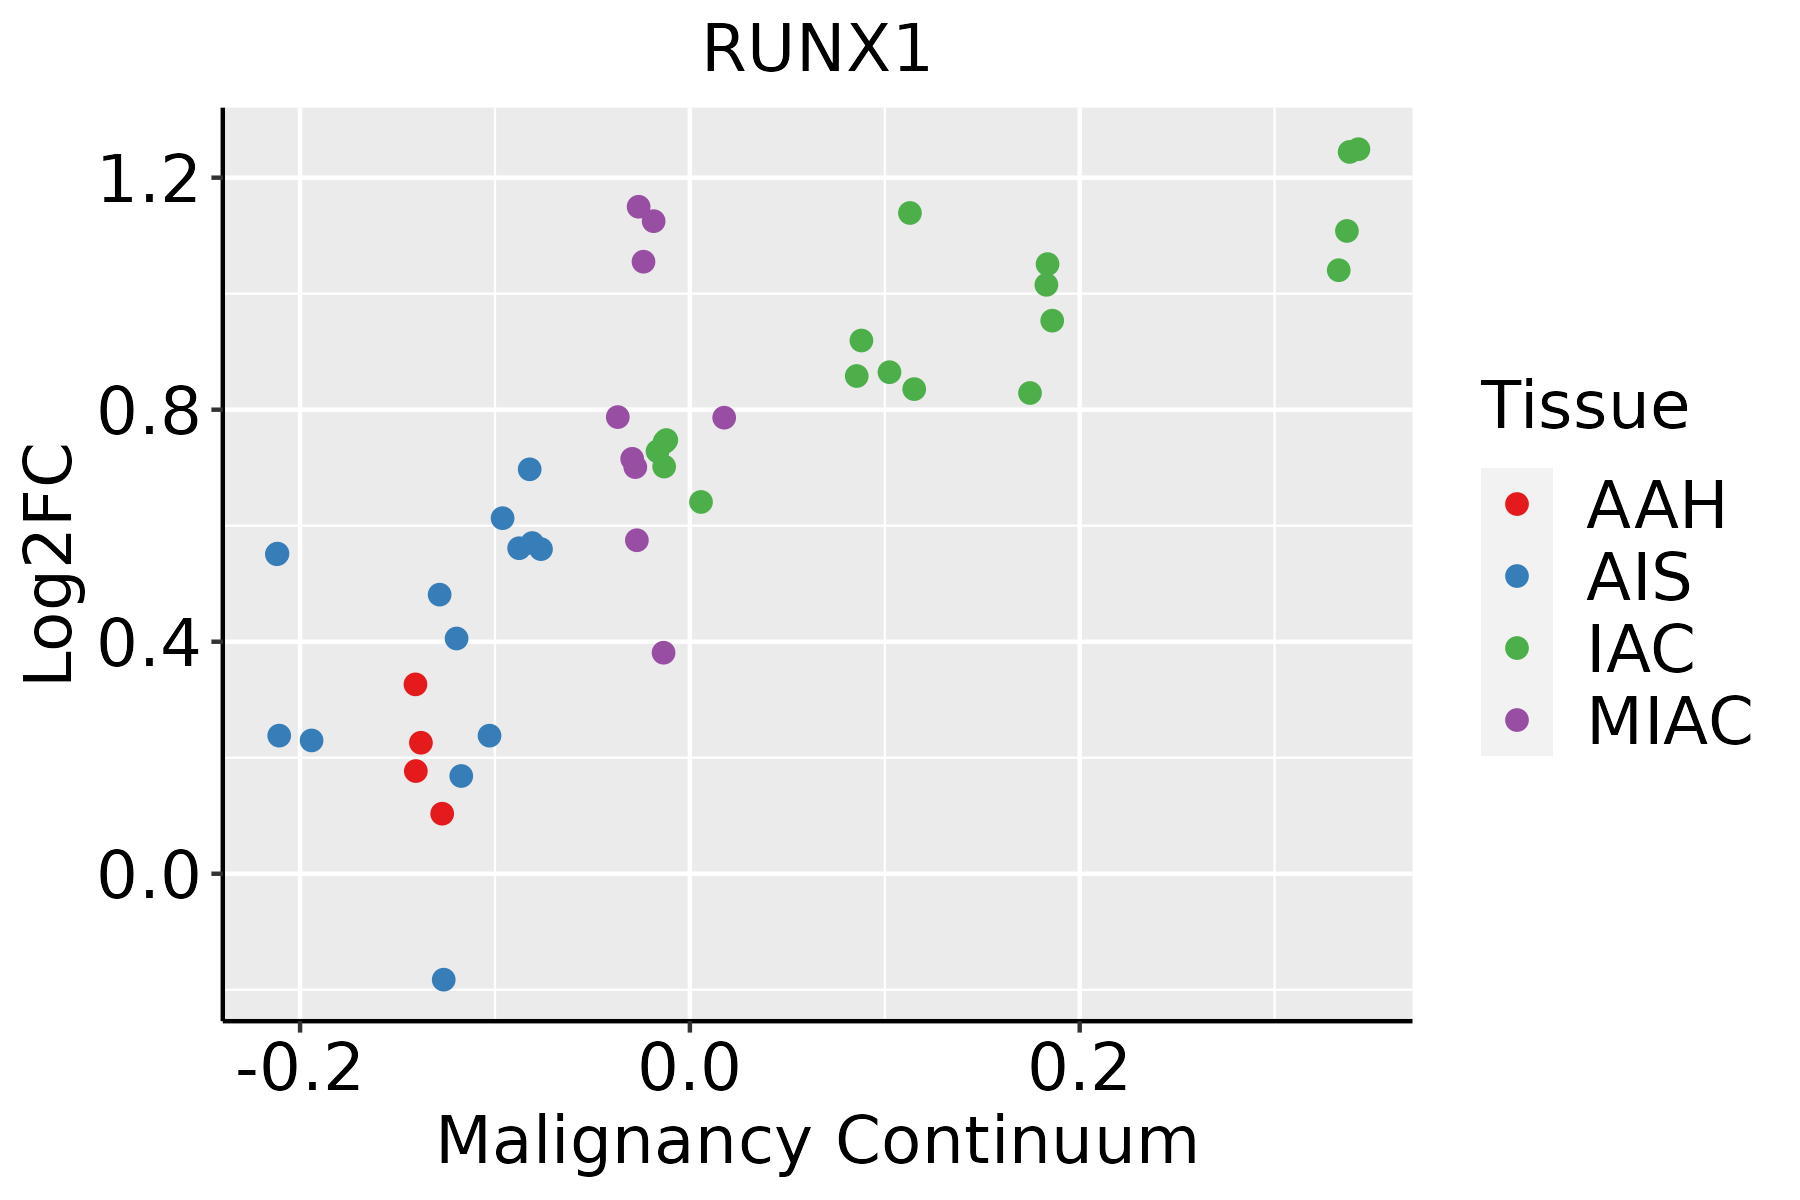 | AAH: Atypical adenomatous hyperplasia |
| AIS: Adenocarcinoma in situ | ||
| IAC: Invasive lung adenocarcinoma | ||
| MIA: Minimally invasive adenocarcinoma | ||
| Oral Cavity | 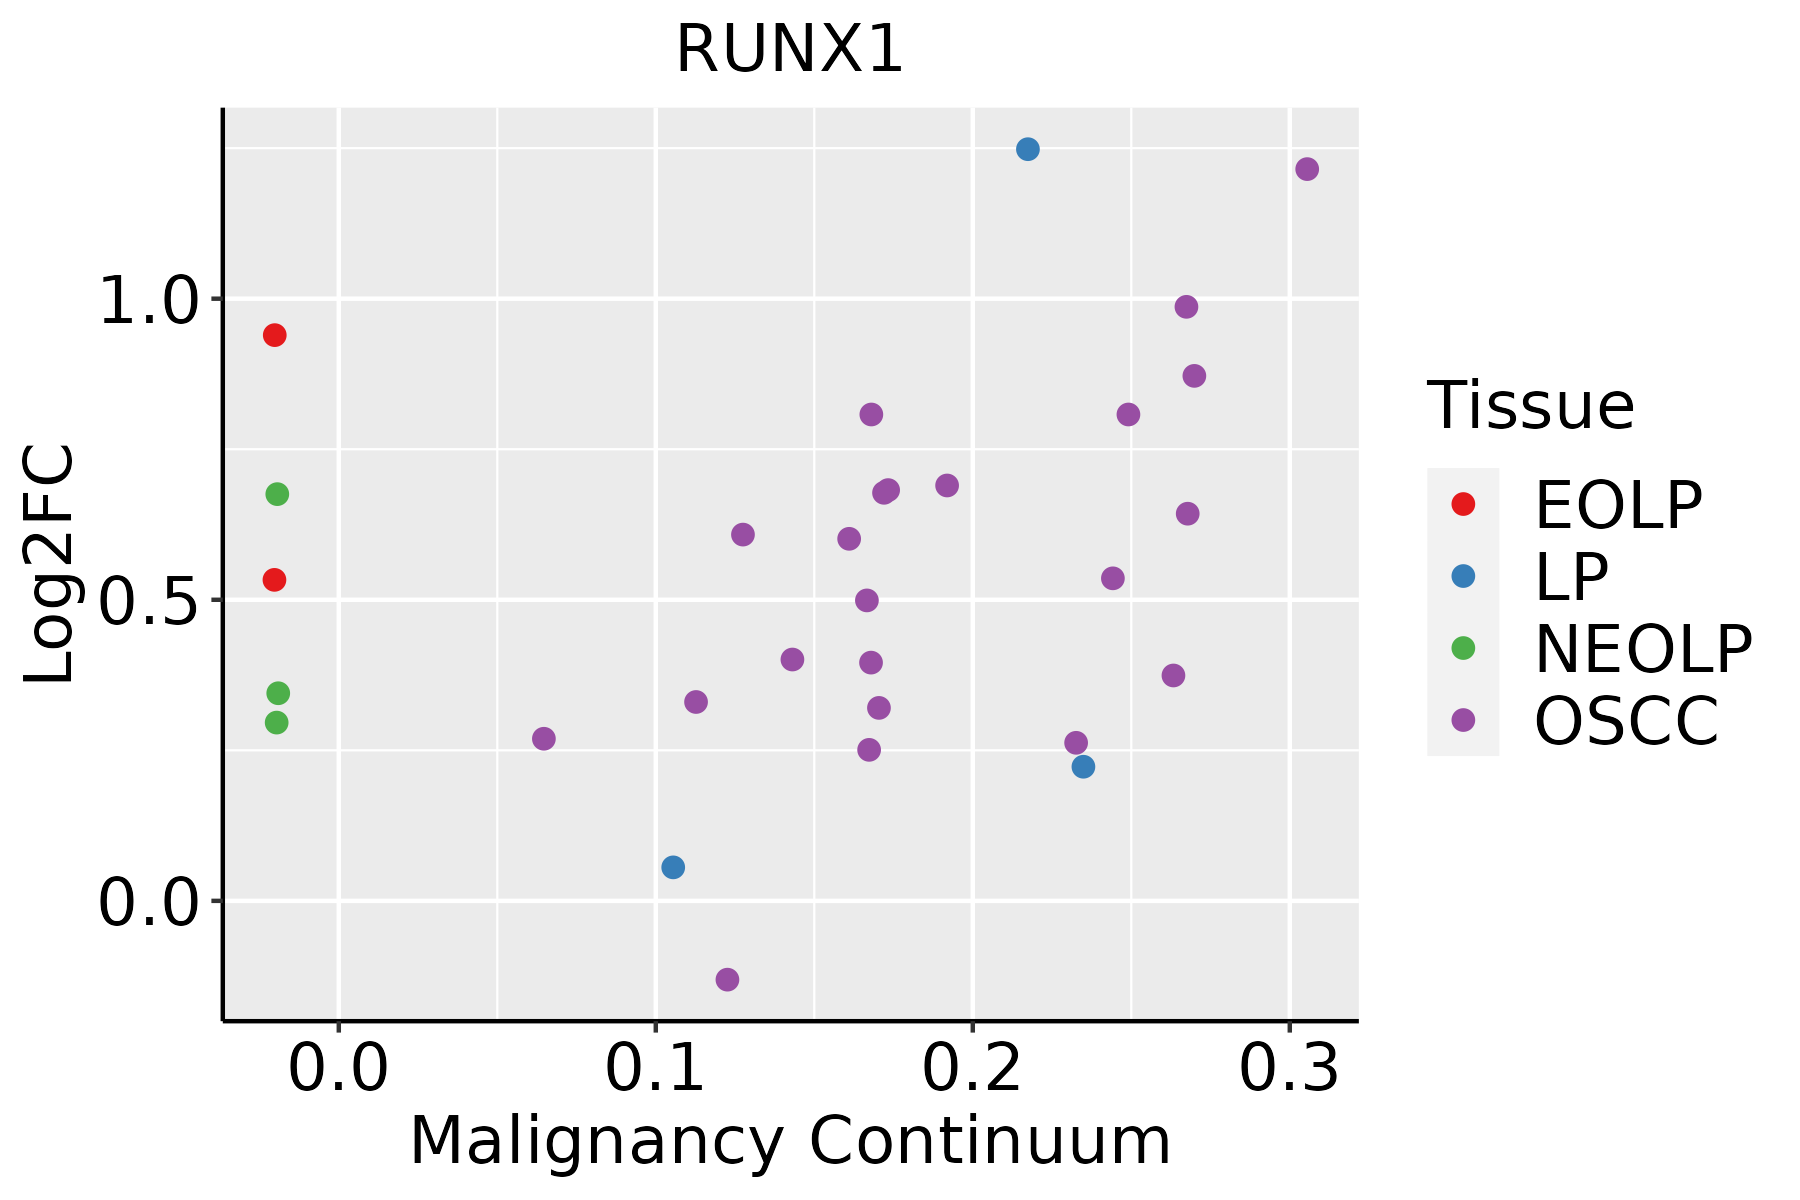 | EOLP: Erosive Oral lichen planus |
| LP: leukoplakia | ||
| NEOLP: Non-erosive oral lichen planus | ||
| OSCC: Oral squamous cell carcinoma | ||
| Prostate | 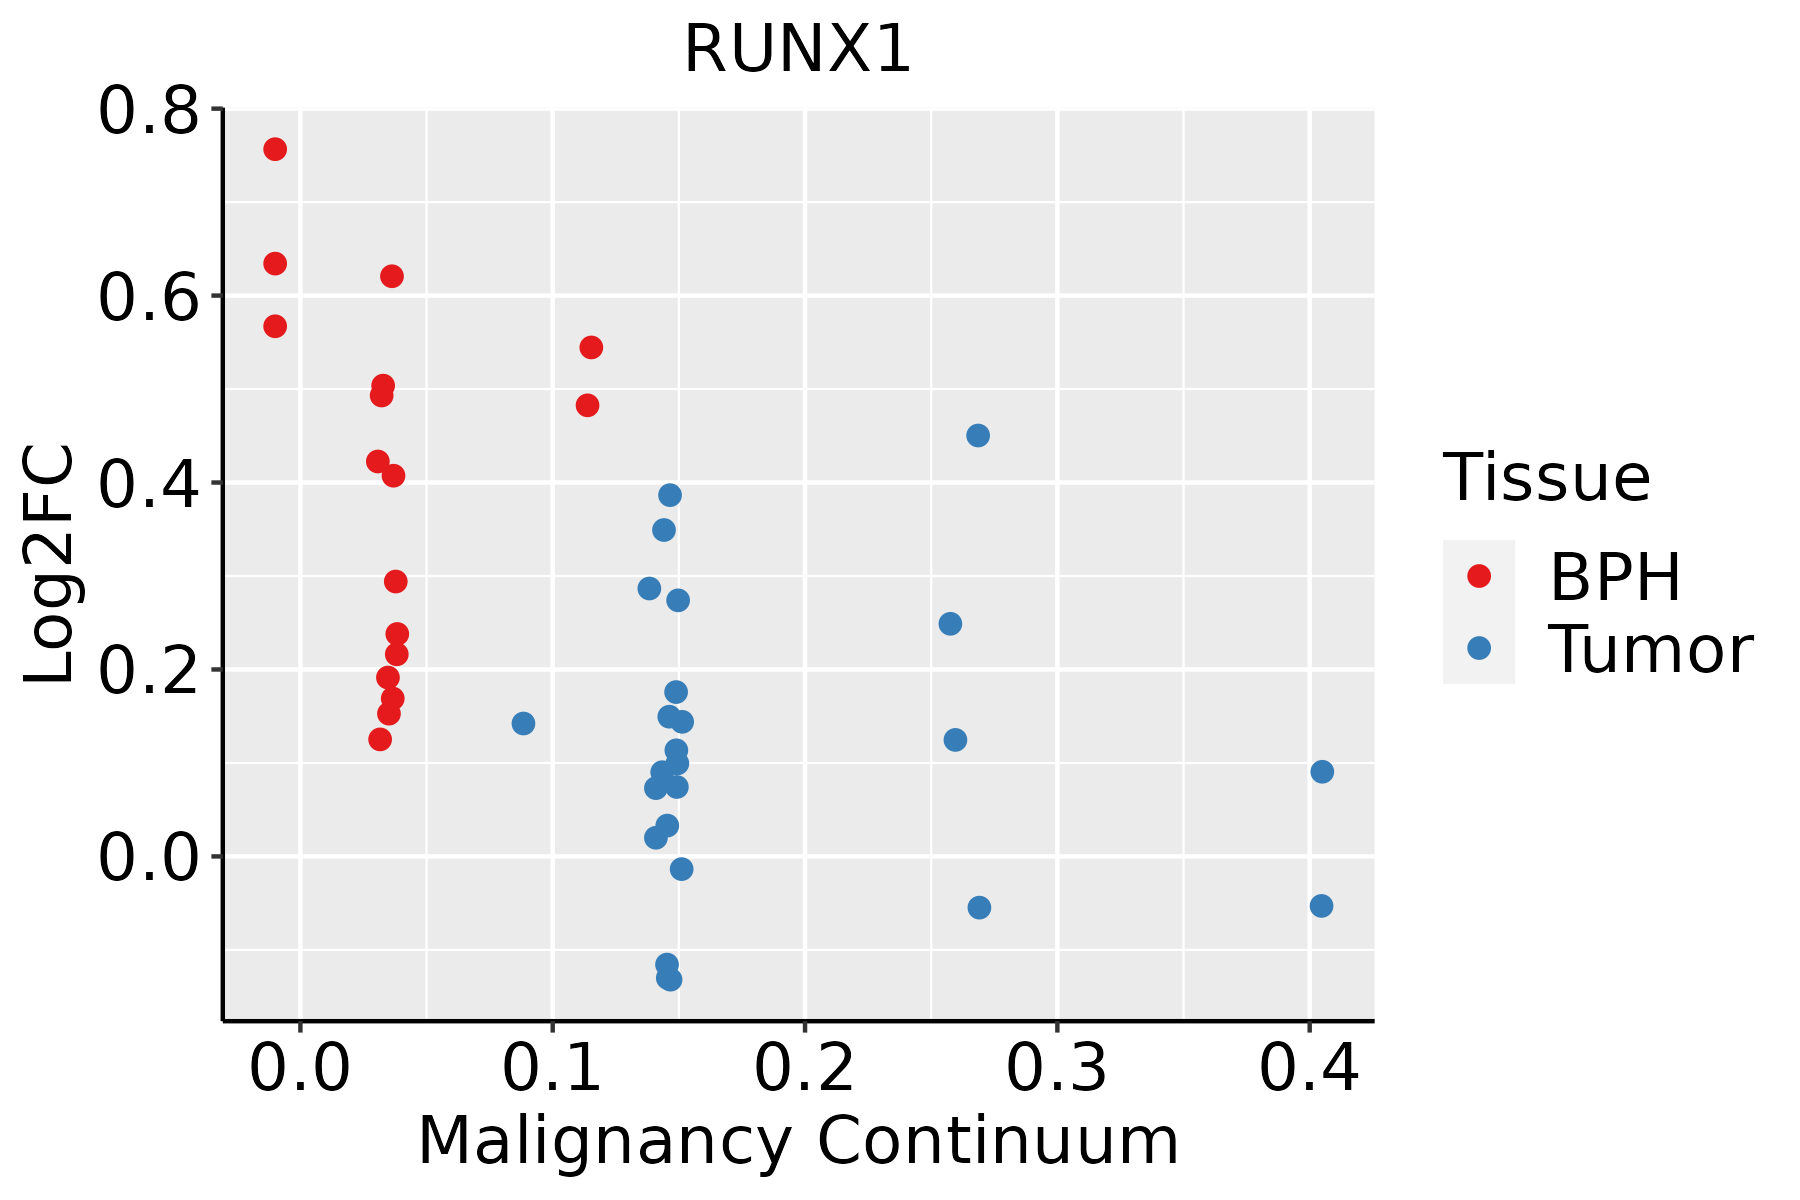 | BPH: Benign Prostatic Hyperplasia |
| Skin | 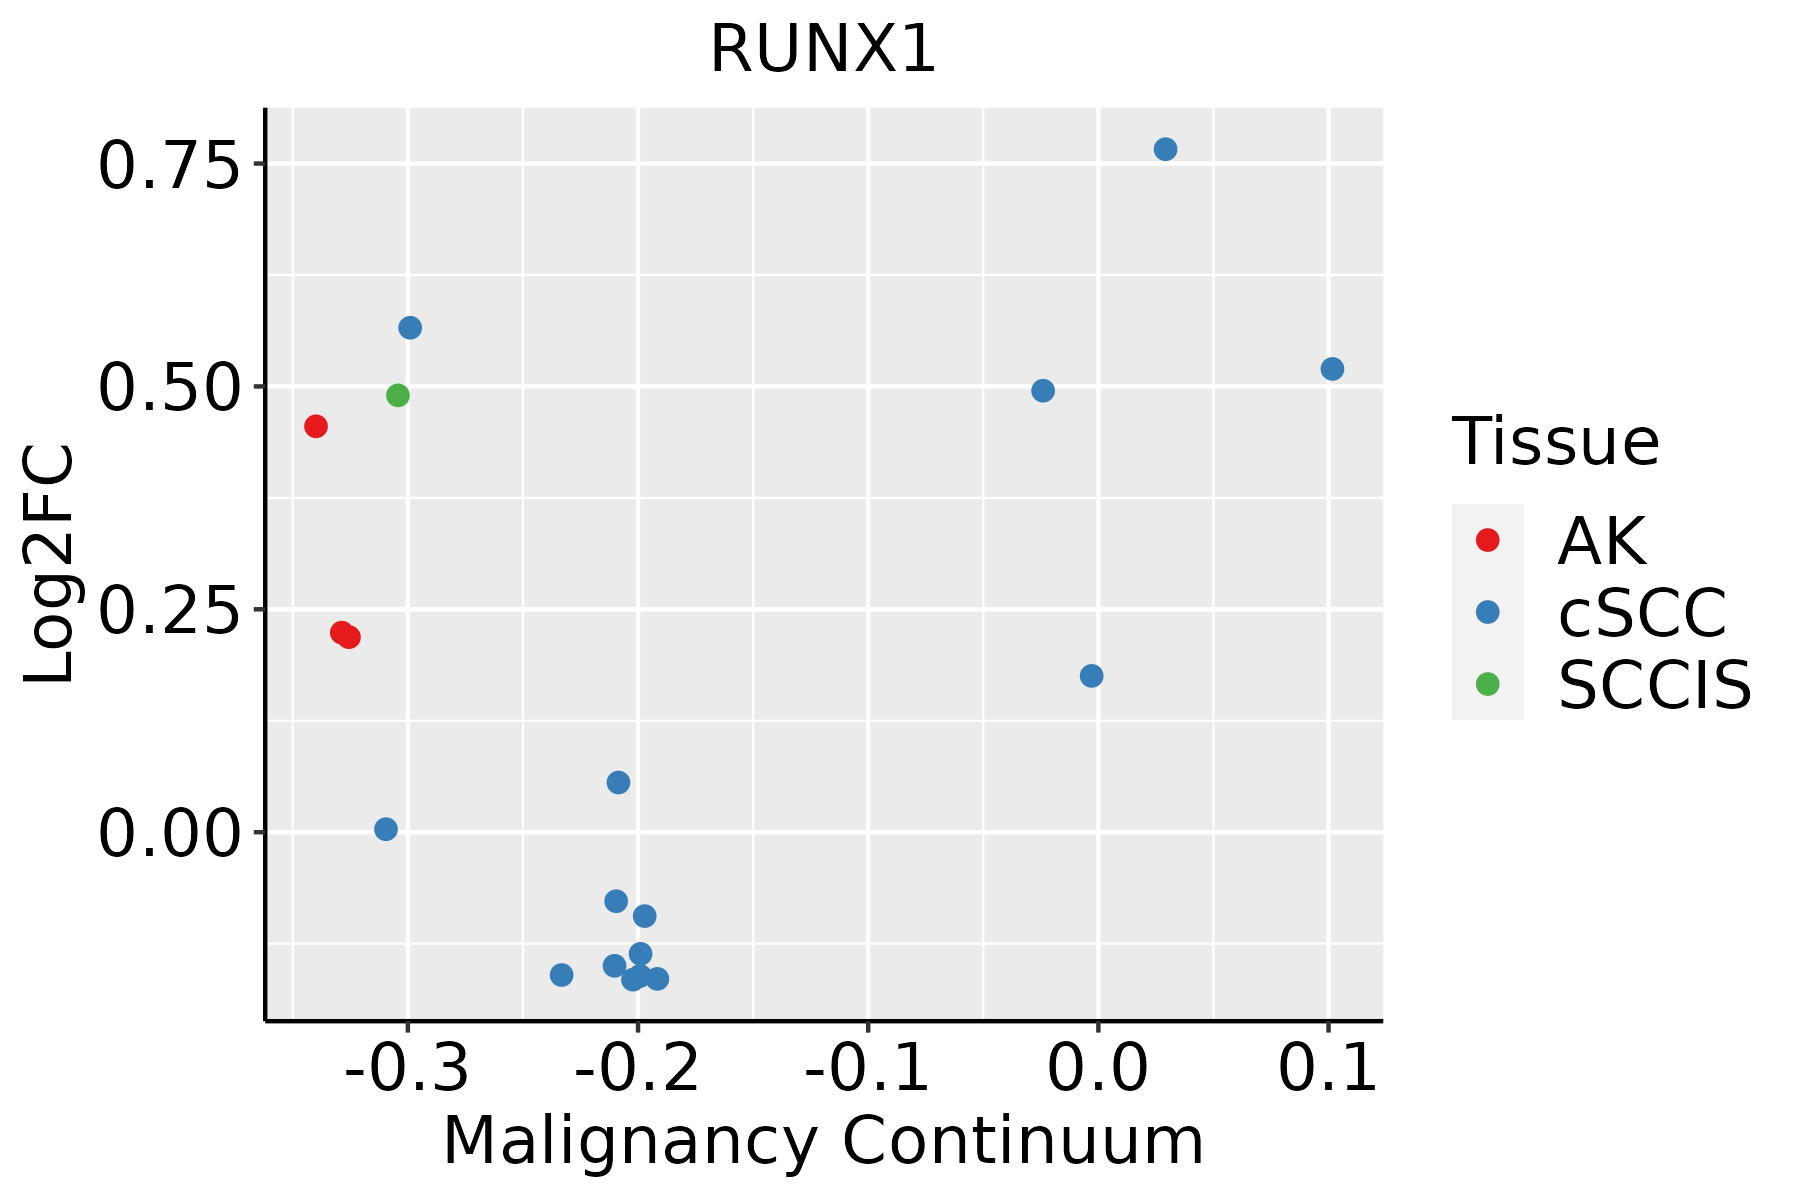 | AK: Actinic keratosis |
| cSCC: Cutaneous squamous cell carcinoma | ||
| SCCIS:squamous cell carcinoma in situ | ||
| Thyroid | 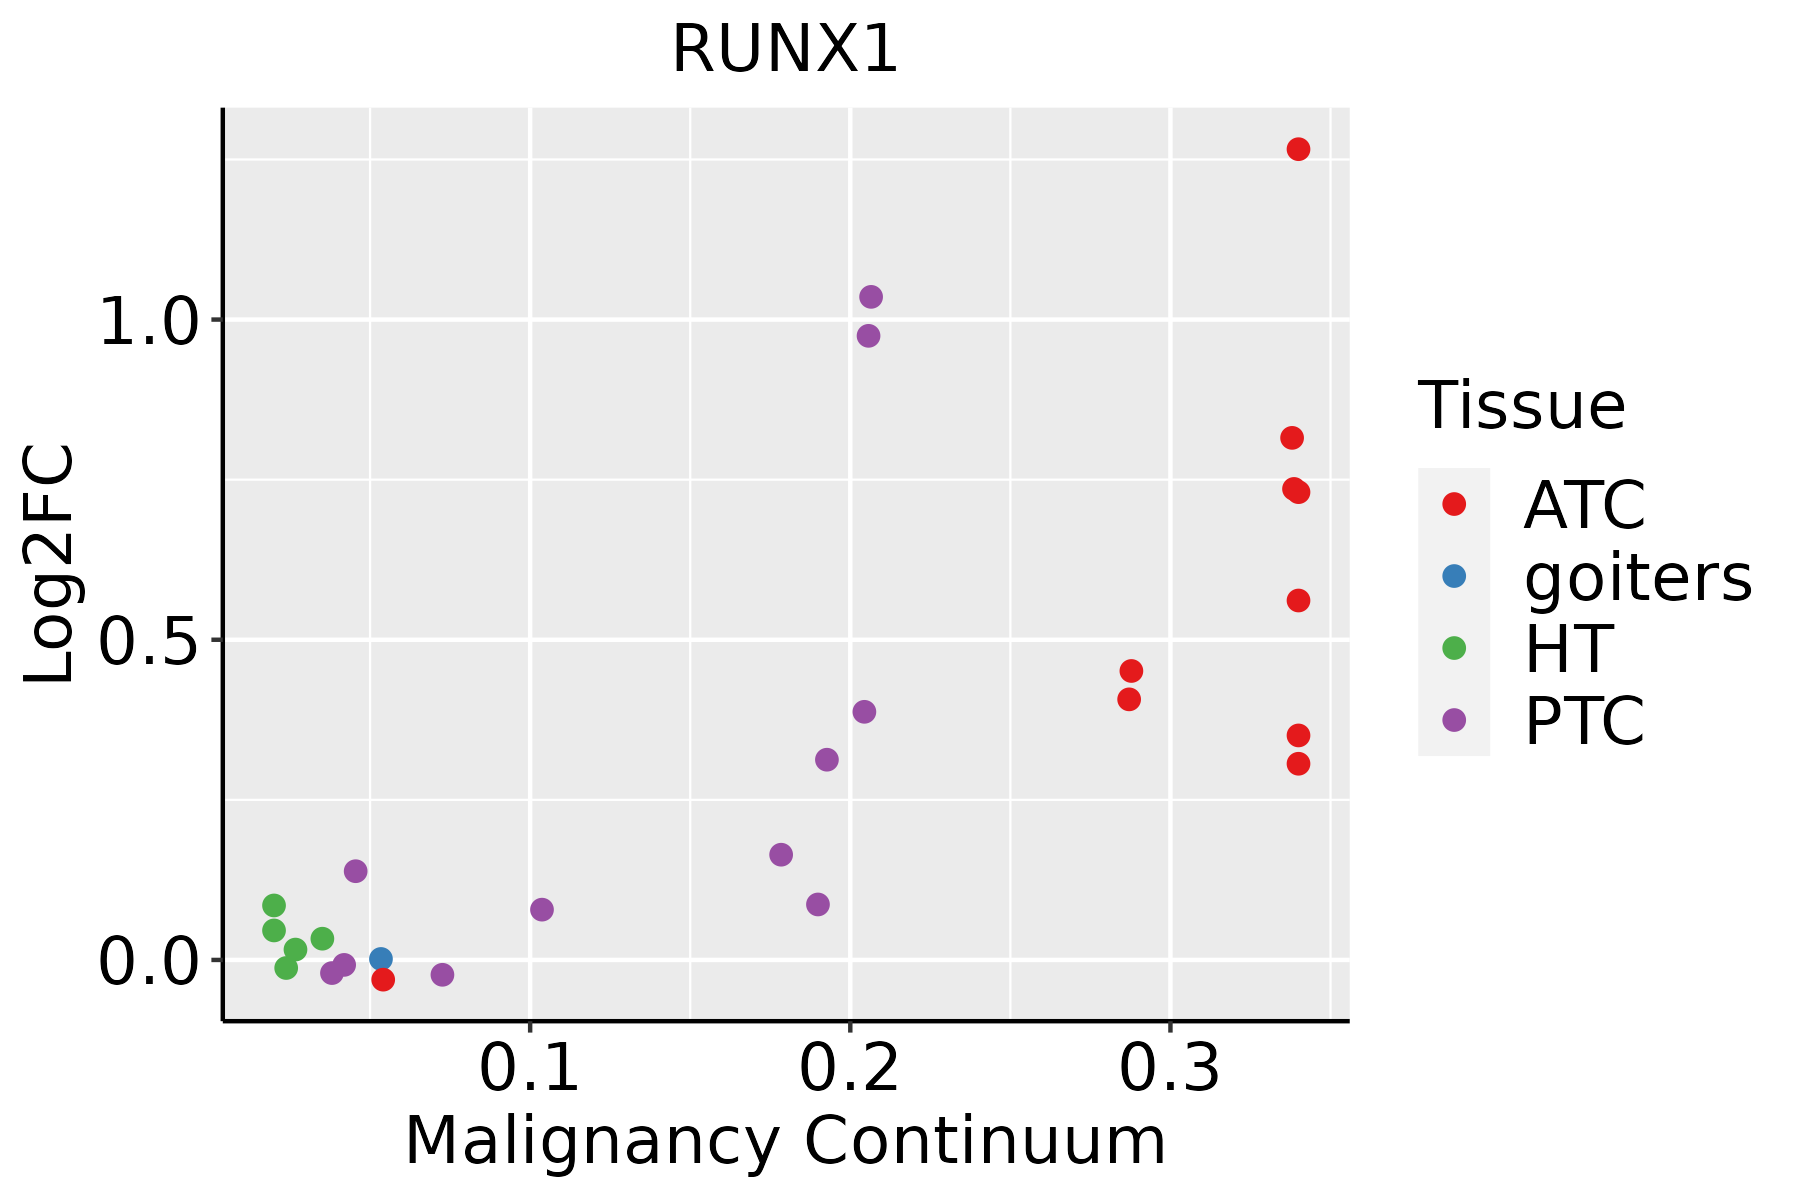 | ATC: Anaplastic thyroid cancer |
| HT: Hashimoto's thyroiditis | ||
| PTC: Papillary thyroid cancer |
| ∗log2FC in expression of this searched gene in stem-like cells from each diseased tissue sample relative to stem-like cells in normal samples in each tissue plotted against the malignancy continuum. Samples are colored based on if they are from different disease stage. |
Top |
Malignant transformation related pathway analysis |
| Find out the enriched GO biological processes and KEGG pathways involved in transition from healthy to precancer to cancer |
| Tissue | Disease Stage | Enriched GO biological Processes |
| Colorectum | AD |  |
| Colorectum | SER |  |
| Colorectum | MSS |  |
| Colorectum | MSI-H |  |
| Colorectum | FAP |  |
| ∗Top 15 enriched GO BP terms are showed in the bar plot of each disease state in each tissue. Each row represents a significant GO biological process which is colored according to the -log10(p.adjust). |
| Page: 1 2 3 4 5 6 7 8 9 |
| GO ID | Tissue | Disease Stage | Description | Gene Ratio | Bg Ratio | pvalue | p.adjust | Count |
| GO:00457859 | Breast | Precancer | positive regulation of cell adhesion | 52/1080 | 437/18723 | 5.74e-07 | 2.49e-05 | 52 |
| GO:00300999 | Breast | Precancer | myeloid cell differentiation | 45/1080 | 381/18723 | 4.00e-06 | 1.25e-04 | 45 |
| GO:00018196 | Breast | Precancer | positive regulation of cytokine production | 52/1080 | 467/18723 | 4.18e-06 | 1.29e-04 | 52 |
| GO:00421107 | Breast | Precancer | T cell activation | 52/1080 | 487/18723 | 1.37e-05 | 3.42e-04 | 52 |
| GO:00508707 | Breast | Precancer | positive regulation of T cell activation | 29/1080 | 216/18723 | 1.94e-05 | 4.58e-04 | 29 |
| GO:00456379 | Breast | Precancer | regulation of myeloid cell differentiation | 28/1080 | 210/18723 | 3.05e-05 | 6.72e-04 | 28 |
| GO:19037069 | Breast | Precancer | regulation of hemopoiesis | 41/1080 | 367/18723 | 3.95e-05 | 8.52e-04 | 41 |
| GO:19030396 | Breast | Precancer | positive regulation of leukocyte cell-cell adhesion | 30/1080 | 239/18723 | 5.13e-05 | 1.07e-03 | 30 |
| GO:00025737 | Breast | Precancer | myeloid leukocyte differentiation | 27/1080 | 208/18723 | 6.72e-05 | 1.35e-03 | 27 |
| GO:00508637 | Breast | Precancer | regulation of T cell activation | 37/1080 | 329/18723 | 8.04e-05 | 1.56e-03 | 37 |
| GO:00224098 | Breast | Precancer | positive regulation of cell-cell adhesion | 33/1080 | 284/18723 | 1.03e-04 | 1.89e-03 | 33 |
| GO:00071597 | Breast | Precancer | leukocyte cell-cell adhesion | 40/1080 | 371/18723 | 1.07e-04 | 1.94e-03 | 40 |
| GO:19021055 | Breast | Precancer | regulation of leukocyte differentiation | 32/1080 | 279/18723 | 1.66e-04 | 2.74e-03 | 32 |
| GO:00310995 | Breast | Precancer | regeneration | 25/1080 | 198/18723 | 1.91e-04 | 3.06e-03 | 25 |
| GO:00224079 | Breast | Precancer | regulation of cell-cell adhesion | 45/1080 | 448/18723 | 2.12e-04 | 3.30e-03 | 45 |
| GO:19031313 | Breast | Precancer | mononuclear cell differentiation | 43/1080 | 426/18723 | 2.61e-04 | 3.84e-03 | 43 |
| GO:19030377 | Breast | Precancer | regulation of leukocyte cell-cell adhesion | 36/1080 | 336/18723 | 2.61e-04 | 3.84e-03 | 36 |
| GO:0045766 | Breast | Precancer | positive regulation of angiogenesis | 23/1080 | 181/18723 | 3.09e-04 | 4.43e-03 | 23 |
| GO:1904018 | Breast | Precancer | positive regulation of vasculature development | 23/1080 | 181/18723 | 3.09e-04 | 4.43e-03 | 23 |
| GO:00027613 | Breast | Precancer | regulation of myeloid leukocyte differentiation | 17/1080 | 120/18723 | 5.23e-04 | 6.74e-03 | 17 |
| Page: 1 2 3 4 5 6 7 8 9 10 11 12 13 14 15 16 17 18 19 20 21 22 23 24 25 26 27 28 29 30 31 32 33 34 35 36 37 38 39 |
| Pathway ID | Tissue | Disease Stage | Description | Gene Ratio | Bg Ratio | pvalue | p.adjust | qvalue | Count |
| hsa0453024 | Breast | IDC | Tight junction | 38/867 | 169/8465 | 2.07e-06 | 3.20e-05 | 2.39e-05 | 38 |
| hsa0522010 | Breast | IDC | Chronic myeloid leukemia | 15/867 | 76/8465 | 9.24e-03 | 4.37e-02 | 3.27e-02 | 15 |
| hsa0453034 | Breast | IDC | Tight junction | 38/867 | 169/8465 | 2.07e-06 | 3.20e-05 | 2.39e-05 | 38 |
| hsa0522013 | Breast | IDC | Chronic myeloid leukemia | 15/867 | 76/8465 | 9.24e-03 | 4.37e-02 | 3.27e-02 | 15 |
| hsa0453044 | Breast | DCIS | Tight junction | 37/846 | 169/8465 | 3.07e-06 | 4.20e-05 | 3.09e-05 | 37 |
| hsa0522023 | Breast | DCIS | Chronic myeloid leukemia | 15/846 | 76/8465 | 7.42e-03 | 3.48e-02 | 2.56e-02 | 15 |
| hsa0453054 | Breast | DCIS | Tight junction | 37/846 | 169/8465 | 3.07e-06 | 4.20e-05 | 3.09e-05 | 37 |
| hsa0522033 | Breast | DCIS | Chronic myeloid leukemia | 15/846 | 76/8465 | 7.42e-03 | 3.48e-02 | 2.56e-02 | 15 |
| hsa0453020 | Cervix | CC | Tight junction | 49/1267 | 169/8465 | 1.87e-06 | 1.78e-05 | 1.05e-05 | 49 |
| hsa0522014 | Cervix | CC | Chronic myeloid leukemia | 21/1267 | 76/8465 | 3.08e-03 | 1.19e-02 | 7.03e-03 | 21 |
| hsa04530110 | Cervix | CC | Tight junction | 49/1267 | 169/8465 | 1.87e-06 | 1.78e-05 | 1.05e-05 | 49 |
| hsa0522015 | Cervix | CC | Chronic myeloid leukemia | 21/1267 | 76/8465 | 3.08e-03 | 1.19e-02 | 7.03e-03 | 21 |
| hsa04530 | Colorectum | AD | Tight junction | 76/2092 | 169/8465 | 5.49e-09 | 9.69e-08 | 6.18e-08 | 76 |
| hsa05220 | Colorectum | AD | Chronic myeloid leukemia | 31/2092 | 76/8465 | 1.41e-03 | 8.46e-03 | 5.39e-03 | 31 |
| hsa045301 | Colorectum | AD | Tight junction | 76/2092 | 169/8465 | 5.49e-09 | 9.69e-08 | 6.18e-08 | 76 |
| hsa052201 | Colorectum | AD | Chronic myeloid leukemia | 31/2092 | 76/8465 | 1.41e-03 | 8.46e-03 | 5.39e-03 | 31 |
| hsa045304 | Colorectum | MSS | Tight junction | 66/1875 | 169/8465 | 4.10e-07 | 6.25e-06 | 3.83e-06 | 66 |
| hsa052202 | Colorectum | MSS | Chronic myeloid leukemia | 29/1875 | 76/8465 | 1.10e-03 | 6.27e-03 | 3.84e-03 | 29 |
| hsa045305 | Colorectum | MSS | Tight junction | 66/1875 | 169/8465 | 4.10e-07 | 6.25e-06 | 3.83e-06 | 66 |
| hsa052203 | Colorectum | MSS | Chronic myeloid leukemia | 29/1875 | 76/8465 | 1.10e-03 | 6.27e-03 | 3.84e-03 | 29 |
| Page: 1 2 3 4 5 6 |
Top |
Cell-cell communication analysis |
| Identification of potential cell-cell interactions between two cell types and their ligand-receptor pairs for different disease states |
| Ligand | Receptor | LRpair | Pathway | Tissue | Disease Stage |
| Page: 1 |
Top |
Single-cell gene regulatory network inference analysis |
| Find out the significant the regulons (TFs) and the target genes of each regulon across cell types for different disease states |
| TF | Cell Type | Tissue | Disease Stage | Target Gene | RSS | Regulon Activity |
| RUNX1 | M1MAC | Breast | ADJ | VCAN,GIMAP8,RBKS, etc. | 4.46e-02 |  |
| RUNX1 | MON | Breast | Healthy | VCAN,GIMAP8,RBKS, etc. | 9.85e-02 |  |
| RUNX1 | INMON | Breast | IDC | VCAN,GIMAP8,RBKS, etc. | 1.54e-01 |  |
| RUNX1 | MON | Breast | IDC | VCAN,GIMAP8,RBKS, etc. | 3.61e-02 | |
| RUNX1 | NK | Cervix | CC | AP000331.1,RORA,JAZF1, etc. | 2.62e-01 |  |
| RUNX1 | MAIT | Cervix | CC | AP000331.1,RORA,JAZF1, etc. | 7.74e-02 | |
| RUNX1 | TUF | Colorectum | ADJ | NKD1,POU2F3,SNTB1, etc. | 1.06e-01 |  |
| RUNX1 | STM | Colorectum | CRC | NKD1,POU2F3,SNTB1, etc. | 3.23e-01 |  |
| RUNX1 | TUF | Colorectum | FAP | NKD1,POU2F3,SNTB1, etc. | 6.60e-02 |  |
| RUNX1 | ASC | Colorectum | MSI-H | POU2F3,NKD1,RP11-401P9.7, etc. | 1.82e-01 |  |
| ∗The dot plots of a searched regulon are shown for all cell subpopulations in each disease state of each tissue based on the regulon specific score inferred using pySCENIC and by calculating the average expression. |
| Page: 1 2 3 4 5 |
Top |
Somatic mutation of malignant transformation related genes |
| Annotation of somatic variants for genes involved in malignant transformation |
| Hugo Symbol | Variant Class | Variant Classification | dbSNP RS | HGVSc | HGVSp | HGVSp Short | SWISSPROT | BIOTYPE | SIFT | PolyPhen | Tumor Sample Barcode | Tissue | Histology | Sex | Age | Stage | Therapy Types | Drugs | Outcome |
| RUNX1 | SNV | Missense_Mutation | c.731C>T | p.Ala244Val | p.A244V | Q01196 | protein_coding | tolerated(0.76) | benign(0.079) | TCGA-A8-A09Z-01 | Breast | breast invasive carcinoma | Female | >=65 | I/II | Unknown | Unknown | SD | |
| RUNX1 | SNV | Missense_Mutation | c.416A>G | p.Asn139Ser | p.N139S | Q01196 | protein_coding | deleterious(0) | probably_damaging(0.987) | TCGA-A8-A0AB-01 | Breast | breast invasive carcinoma | Female | <65 | I/II | Chemotherapy | 5-fluorouracil | CR | |
| RUNX1 | SNV | Missense_Mutation | c.949N>T | p.Leu317Phe | p.L317F | Q01196 | protein_coding | tolerated(0.16) | possibly_damaging(0.856) | TCGA-A8-A0AD-01 | Breast | breast invasive carcinoma | Female | >=65 | I/II | Hormone Therapy | tamoxiphen | SD | |
| RUNX1 | SNV | Missense_Mutation | c.22N>C | p.Glu8Gln | p.E8Q | Q01196 | protein_coding | deleterious_low_confidence(0.02) | benign(0.003) | TCGA-AC-A3BB-01 | Breast | breast invasive carcinoma | Female | <65 | III/IV | Chemotherapy | cytoxan | CR | |
| RUNX1 | SNV | Missense_Mutation | novel | c.307N>T | p.Pro103Ser | p.P103S | Q01196 | protein_coding | deleterious(0.03) | probably_damaging(0.997) | TCGA-AC-A6NO-01 | Breast | breast invasive carcinoma | Female | <65 | I/II | Unknown | Unknown | SD |
| RUNX1 | SNV | Missense_Mutation | c.482T>C | p.Leu161Pro | p.L161P | Q01196 | protein_coding | deleterious(0) | probably_damaging(1) | TCGA-AR-A1AN-01 | Breast | breast invasive carcinoma | Female | <65 | I/II | Chemotherapy | cytoxan | SD | |
| RUNX1 | SNV | Missense_Mutation | c.404N>A | p.Gly135Asp | p.G135D | Q01196 | protein_coding | deleterious(0) | probably_damaging(1) | TCGA-BH-A0C1-01 | Breast | breast invasive carcinoma | Female | <65 | III/IV | Chemotherapy | adriamycin | PD | |
| RUNX1 | SNV | Missense_Mutation | c.593N>G | p.Asp198Gly | p.D198G | Q01196 | protein_coding | deleterious(0) | possibly_damaging(0.533) | TCGA-BH-A0C3-01 | Breast | breast invasive carcinoma | Female | <65 | I/II | Chemotherapy | adriamycin | PD | |
| RUNX1 | SNV | Missense_Mutation | c.502N>C | p.Gly168Arg | p.G168R | Q01196 | protein_coding | deleterious(0) | probably_damaging(1) | TCGA-C8-A12O-01 | Breast | breast invasive carcinoma | Female | <65 | I/II | Unknown | Unknown | SD | |
| RUNX1 | SNV | Missense_Mutation | c.565N>C | p.Tyr189His | p.Y189H | Q01196 | protein_coding | deleterious(0) | probably_damaging(0.948) | TCGA-C8-A1HJ-01 | Breast | breast invasive carcinoma | Female | <65 | I/II | Unknown | Unknown | SD |
| Page: 1 2 3 4 5 6 7 8 9 |
Top |
Related drugs of malignant transformation related genes |
| Identification of chemicals and drugs interact with genes involved in malignant transfromation |
| (DGIdb 4.0) |
| Entrez ID | Symbol | Category | Interaction Types | Drug Claim Name | Drug Name | PMIDs |
| 861 | RUNX1 | CLINICALLY ACTIONABLE, TRANSCRIPTION FACTOR, DRUG RESISTANCE | FUMARPROTOCETRARIC ACID | FUMARPROTOCETRARIC ACID | ||
| 861 | RUNX1 | CLINICALLY ACTIONABLE, TRANSCRIPTION FACTOR, DRUG RESISTANCE | I-CBP112 | 26552700 | ||
| 861 | RUNX1 | CLINICALLY ACTIONABLE, TRANSCRIPTION FACTOR, DRUG RESISTANCE | Doxorubicin | DOXORUBICIN | 26552700 | |
| 861 | RUNX1 | CLINICALLY ACTIONABLE, TRANSCRIPTION FACTOR, DRUG RESISTANCE | APOMORPHINE HYDROCHLORIDE HEMIHYDRATE | APOMORPHINE HYDROCHLORIDE HEMIHYDRATE | ||
| 861 | RUNX1 | CLINICALLY ACTIONABLE, TRANSCRIPTION FACTOR, DRUG RESISTANCE | D-DOPA | CHEMBL211670 | ||
| 861 | RUNX1 | CLINICALLY ACTIONABLE, TRANSCRIPTION FACTOR, DRUG RESISTANCE | CYTARABINE | CYTARABINE | 21343560 | |
| 861 | RUNX1 | CLINICALLY ACTIONABLE, TRANSCRIPTION FACTOR, DRUG RESISTANCE | ERGOCORNINE | ERGOCORNINE | ||
| 861 | RUNX1 | CLINICALLY ACTIONABLE, TRANSCRIPTION FACTOR, DRUG RESISTANCE | DEPHOSTATIN | DEPHOSTATIN | ||
| 861 | RUNX1 | CLINICALLY ACTIONABLE, TRANSCRIPTION FACTOR, DRUG RESISTANCE | TCMDC-123764 | CHEMBL533226 | ||
| 861 | RUNX1 | CLINICALLY ACTIONABLE, TRANSCRIPTION FACTOR, DRUG RESISTANCE | DIPYRIDYL | DIPYRIDYL |
| Page: 1 2 3 4 |

Copyright 2023-Present -The University of Texas Health Science Center at Houston |