
|
|||||
|
 | |
| |
| |
| |
| |
| |
|
Gene: RUNDC3B |
Gene summary for RUNDC3B |
| Gene information | Species | Human | Gene symbol | RUNDC3B | Gene ID | 154661 |
| Gene name | RUN domain containing 3B | |
| Gene Alias | RPIB9 | |
| Cytomap | 7q21.12 | |
| Gene Type | protein-coding | GO ID | NA | UniProtAcc | Q96NL0 |
Top |
Malignant transformation analysis |
| Identification of the aberrant gene expression in precancerous and cancerous lesions by comparing the gene expression of stem-like cells in diseased tissues with normal stem cells |
| Entrez ID | Symbol | Replicates | Species | Organ | Tissue | Adj P-value | Log2FC | Malignancy |
| 154661 | RUNDC3B | AEH-subject5 | Human | Endometrium | AEH | 4.62e-05 | 2.06e-01 | -0.2953 |
| 154661 | RUNDC3B | EEC-subject4 | Human | Endometrium | EEC | 8.25e-04 | 1.51e-01 | -0.2571 |
| Page: 1 |
| Tissue | Expression Dynamics | Abbreviation |
| Endometrium | 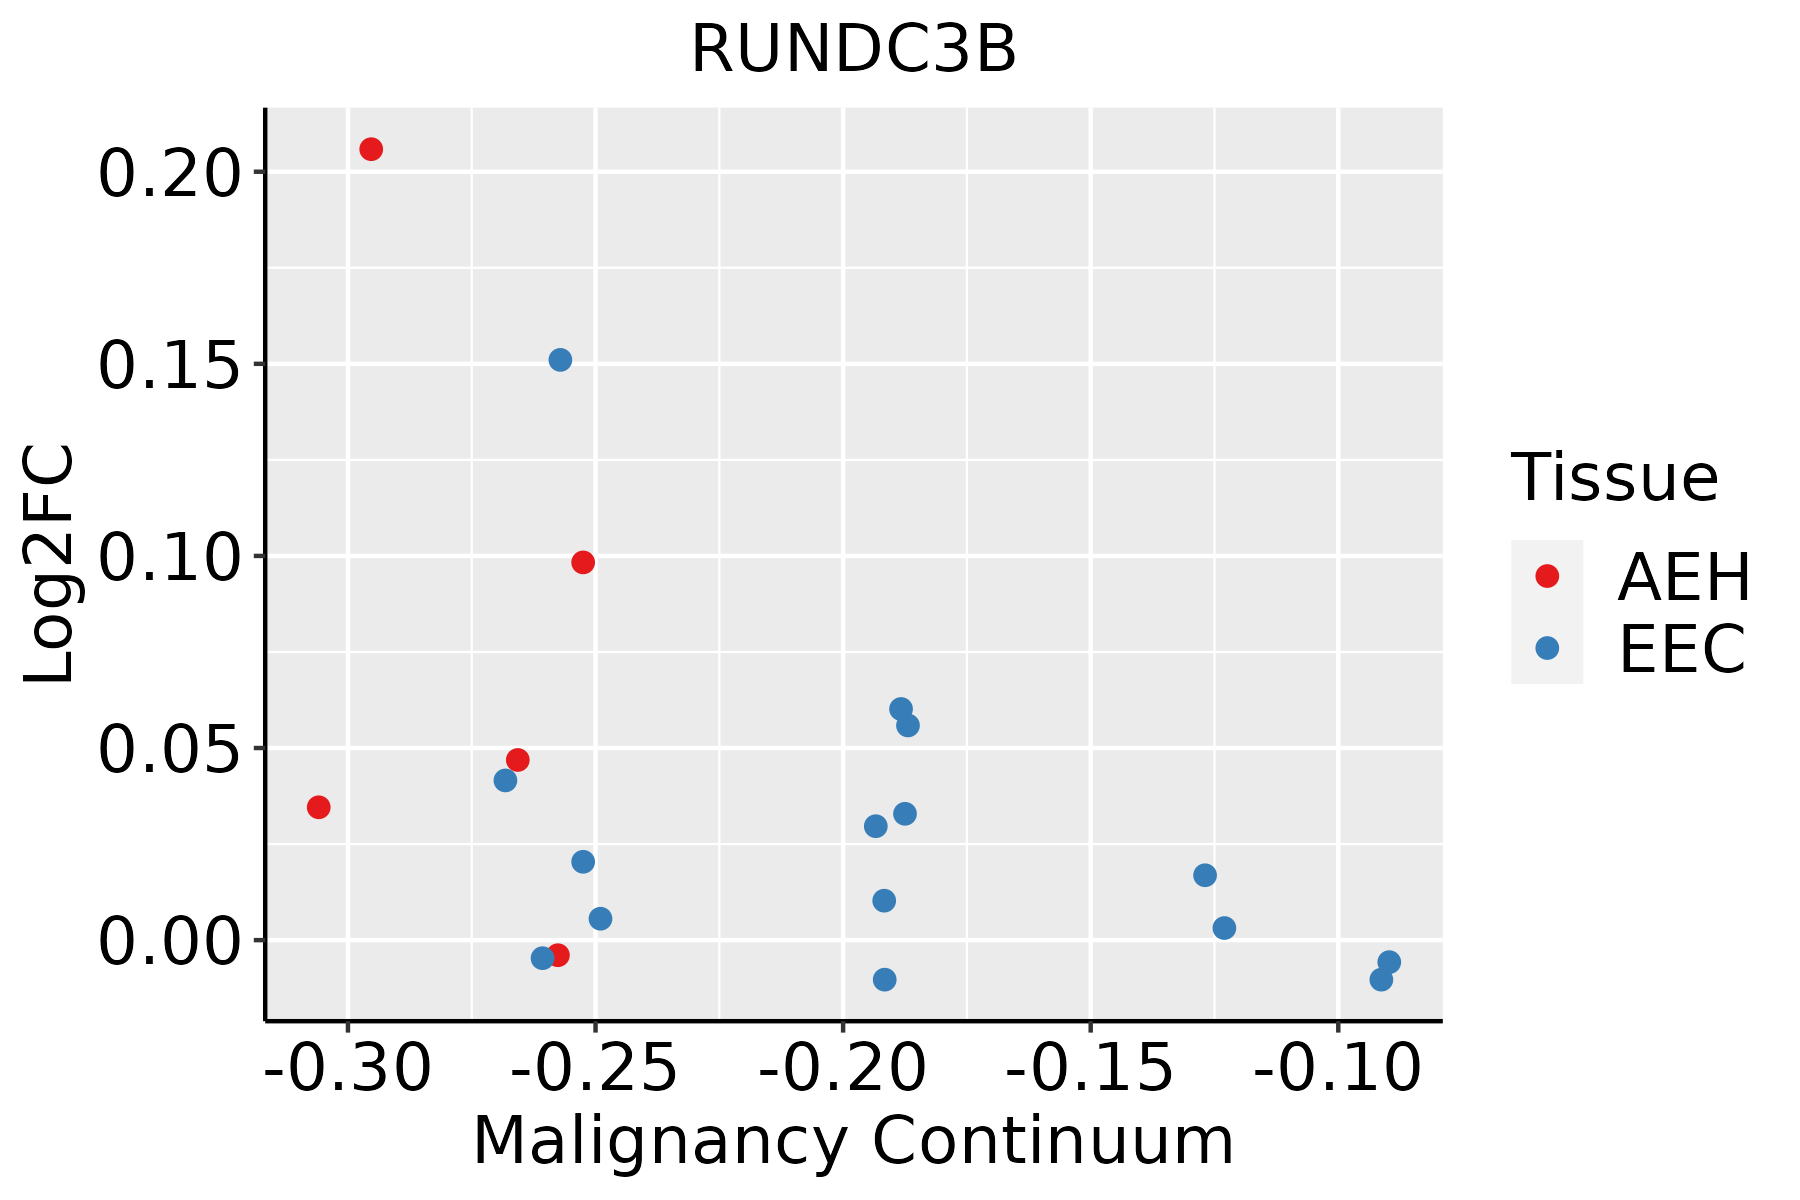 | AEH: Atypical endometrial hyperplasia |
| EEC: Endometrioid Cancer |
| ∗log2FC in expression of this searched gene in stem-like cells from each diseased tissue sample relative to stem-like cells in normal samples in each tissue plotted against the malignancy continuum. Samples are colored based on if they are from different disease stage. |
Top |
Malignant transformation related pathway analysis |
| Find out the enriched GO biological processes and KEGG pathways involved in transition from healthy to precancer to cancer |
| Tissue | Disease Stage | Enriched GO biological Processes |
| Colorectum | AD |  |
| Colorectum | SER |  |
| Colorectum | MSS |  |
| Colorectum | MSI-H |  |
| Colorectum | FAP |  |
| ∗Top 15 enriched GO BP terms are showed in the bar plot of each disease state in each tissue. Each row represents a significant GO biological process which is colored according to the -log10(p.adjust). |
| Page: 1 2 3 4 5 6 7 8 9 |
| GO ID | Tissue | Disease Stage | Description | Gene Ratio | Bg Ratio | pvalue | p.adjust | Count |
| Page: 1 |
| Pathway ID | Tissue | Disease Stage | Description | Gene Ratio | Bg Ratio | pvalue | p.adjust | qvalue | Count |
| Page: 1 |
Top |
Cell-cell communication analysis |
| Identification of potential cell-cell interactions between two cell types and their ligand-receptor pairs for different disease states |
| Ligand | Receptor | LRpair | Pathway | Tissue | Disease Stage |
| Page: 1 |
Top |
Single-cell gene regulatory network inference analysis |
| Find out the significant the regulons (TFs) and the target genes of each regulon across cell types for different disease states |
| TF | Cell Type | Tissue | Disease Stage | Target Gene | RSS | Regulon Activity |
| ∗The dot plots of a searched regulon are shown for all cell subpopulations in each disease state of each tissue based on the regulon specific score inferred using pySCENIC and by calculating the average expression. |
| Page: 1 |
Top |
Somatic mutation of malignant transformation related genes |
| Annotation of somatic variants for genes involved in malignant transformation |
| Hugo Symbol | Variant Class | Variant Classification | dbSNP RS | HGVSc | HGVSp | HGVSp Short | SWISSPROT | BIOTYPE | SIFT | PolyPhen | Tumor Sample Barcode | Tissue | Histology | Sex | Age | Stage | Therapy Types | Drugs | Outcome |
| RUNDC3B | SNV | Missense_Mutation | c.91N>T | p.Val31Leu | p.V31L | Q96NL0 | protein_coding | deleterious(0) | possibly_damaging(0.78) | TCGA-A7-A13D-01 | Breast | breast invasive carcinoma | Female | <65 | I/II | Chemotherapy | cytoxan | SD | |
| RUNDC3B | SNV | Missense_Mutation | rs750107326 | c.356G>A | p.Arg119Gln | p.R119Q | Q96NL0 | protein_coding | deleterious(0.05) | benign(0.363) | TCGA-A8-A07U-01 | Breast | breast invasive carcinoma | Female | >=65 | III/IV | Chemotherapy | 5-fluorouracil | SD |
| RUNDC3B | SNV | Missense_Mutation | novel | c.254N>A | p.Cys85Tyr | p.C85Y | Q96NL0 | protein_coding | tolerated_low_confidence(0.26) | benign(0.011) | TCGA-LL-A50Y-01 | Breast | breast invasive carcinoma | Female | >=65 | I/II | Hormone Therapy | arimidex | CR |
| RUNDC3B | SNV | Missense_Mutation | novel | c.388N>C | p.Glu130Gln | p.E130Q | Q96NL0 | protein_coding | deleterious(0) | probably_damaging(0.996) | TCGA-EA-A43B-01 | Cervix | cervical & endocervical cancer | Female | <65 | I/II | Chemotherapy | cisplatin | CR |
| RUNDC3B | SNV | Missense_Mutation | c.849N>T | p.Lys283Asn | p.K283N | Q96NL0 | protein_coding | deleterious(0) | probably_damaging(0.963) | TCGA-AA-3864-01 | Colorectum | colon adenocarcinoma | Male | >=65 | I/II | Unknown | Unknown | SD | |
| RUNDC3B | SNV | Missense_Mutation | c.1037C>T | p.Ser346Leu | p.S346L | Q96NL0 | protein_coding | tolerated(0.63) | benign(0.106) | TCGA-AA-3977-01 | Colorectum | colon adenocarcinoma | Male | >=65 | I/II | Unknown | Unknown | SD | |
| RUNDC3B | SNV | Missense_Mutation | novel | c.103A>G | p.Asn35Asp | p.N35D | Q96NL0 | protein_coding | deleterious(0.01) | probably_damaging(0.91) | TCGA-AA-3984-01 | Colorectum | colon adenocarcinoma | Female | <65 | I/II | Unknown | Unknown | SD |
| RUNDC3B | SNV | Missense_Mutation | rs760764597 | c.943G>A | p.Asp315Asn | p.D315N | Q96NL0 | protein_coding | tolerated(0.39) | benign(0.003) | TCGA-AA-3984-01 | Colorectum | colon adenocarcinoma | Female | <65 | I/II | Unknown | Unknown | SD |
| RUNDC3B | SNV | Missense_Mutation | rs769895514 | c.1130N>A | p.Arg377Gln | p.R377Q | Q96NL0 | protein_coding | tolerated(0.12) | possibly_damaging(0.557) | TCGA-AA-A00N-01 | Colorectum | colon adenocarcinoma | Male | >=65 | I/II | Unknown | Unknown | PD |
| RUNDC3B | SNV | Missense_Mutation | c.611A>C | p.Lys204Thr | p.K204T | Q96NL0 | protein_coding | deleterious(0.02) | probably_damaging(0.919) | TCGA-AA-A01R-01 | Colorectum | colon adenocarcinoma | Male | <65 | III/IV | Chemotherapy | 5-fluorouracil | PD |
| Page: 1 2 3 4 5 6 7 8 |
Top |
Related drugs of malignant transformation related genes |
| Identification of chemicals and drugs interact with genes involved in malignant transfromation |
| (DGIdb 4.0) |
| Entrez ID | Symbol | Category | Interaction Types | Drug Claim Name | Drug Name | PMIDs |
| Page: 1 |

Copyright 2023-Present -The University of Texas Health Science Center at Houston |