
|
|||||
|
 | |
| |
| |
| |
| |
| |
|
Gene: RUNDC1 |
Gene summary for RUNDC1 |
| Gene information | Species | Human | Gene symbol | RUNDC1 | Gene ID | 146923 |
| Gene name | RUN domain containing 1 | |
| Gene Alias | RUND1 | |
| Cytomap | 17q21.31 | |
| Gene Type | protein-coding | GO ID | GO:0001701 | UniProtAcc | NA |
Top |
Malignant transformation analysis |
| Identification of the aberrant gene expression in precancerous and cancerous lesions by comparing the gene expression of stem-like cells in diseased tissues with normal stem cells |
| Entrez ID | Symbol | Replicates | Species | Organ | Tissue | Adj P-value | Log2FC | Malignancy |
| 146923 | RUNDC1 | HCC1_Meng | Human | Liver | HCC | 6.82e-13 | -4.34e-02 | 0.0246 |
| 146923 | RUNDC1 | HCC2_Meng | Human | Liver | HCC | 6.54e-17 | 7.79e-02 | 0.0107 |
| 146923 | RUNDC1 | HCC1 | Human | Liver | HCC | 7.62e-12 | 3.28e+00 | 0.5336 |
| 146923 | RUNDC1 | HCC2 | Human | Liver | HCC | 8.49e-23 | 2.80e+00 | 0.5341 |
| 146923 | RUNDC1 | HCC5 | Human | Liver | HCC | 1.71e-22 | 1.66e+00 | 0.4932 |
| 146923 | RUNDC1 | S014 | Human | Liver | HCC | 2.10e-03 | 2.56e-01 | 0.2254 |
| 146923 | RUNDC1 | S015 | Human | Liver | HCC | 4.98e-02 | 2.44e-01 | 0.2375 |
| 146923 | RUNDC1 | S016 | Human | Liver | HCC | 8.58e-04 | 3.27e-01 | 0.2243 |
| 146923 | RUNDC1 | S027 | Human | Liver | HCC | 2.78e-02 | 4.26e-01 | 0.2446 |
| 146923 | RUNDC1 | S028 | Human | Liver | HCC | 4.07e-09 | 5.06e-01 | 0.2503 |
| 146923 | RUNDC1 | C04 | Human | Oral cavity | OSCC | 6.70e-03 | 2.55e-01 | 0.2633 |
| 146923 | RUNDC1 | C21 | Human | Oral cavity | OSCC | 4.21e-06 | 2.66e-01 | 0.2678 |
| 146923 | RUNDC1 | C30 | Human | Oral cavity | OSCC | 1.79e-19 | 6.09e-01 | 0.3055 |
| 146923 | RUNDC1 | C38 | Human | Oral cavity | OSCC | 8.57e-07 | 6.24e-01 | 0.172 |
| 146923 | RUNDC1 | C43 | Human | Oral cavity | OSCC | 5.74e-12 | 1.90e-01 | 0.1704 |
| 146923 | RUNDC1 | C46 | Human | Oral cavity | OSCC | 1.79e-09 | 2.54e-01 | 0.1673 |
| 146923 | RUNDC1 | C51 | Human | Oral cavity | OSCC | 1.15e-02 | 2.32e-01 | 0.2674 |
| 146923 | RUNDC1 | C08 | Human | Oral cavity | OSCC | 2.81e-12 | 1.88e-01 | 0.1919 |
| 146923 | RUNDC1 | LN22 | Human | Oral cavity | OSCC | 2.30e-05 | 5.03e-01 | 0.1733 |
| 146923 | RUNDC1 | LN46 | Human | Oral cavity | OSCC | 1.13e-04 | 2.46e-01 | 0.1666 |
| Page: 1 2 |
| Tissue | Expression Dynamics | Abbreviation |
| Liver | 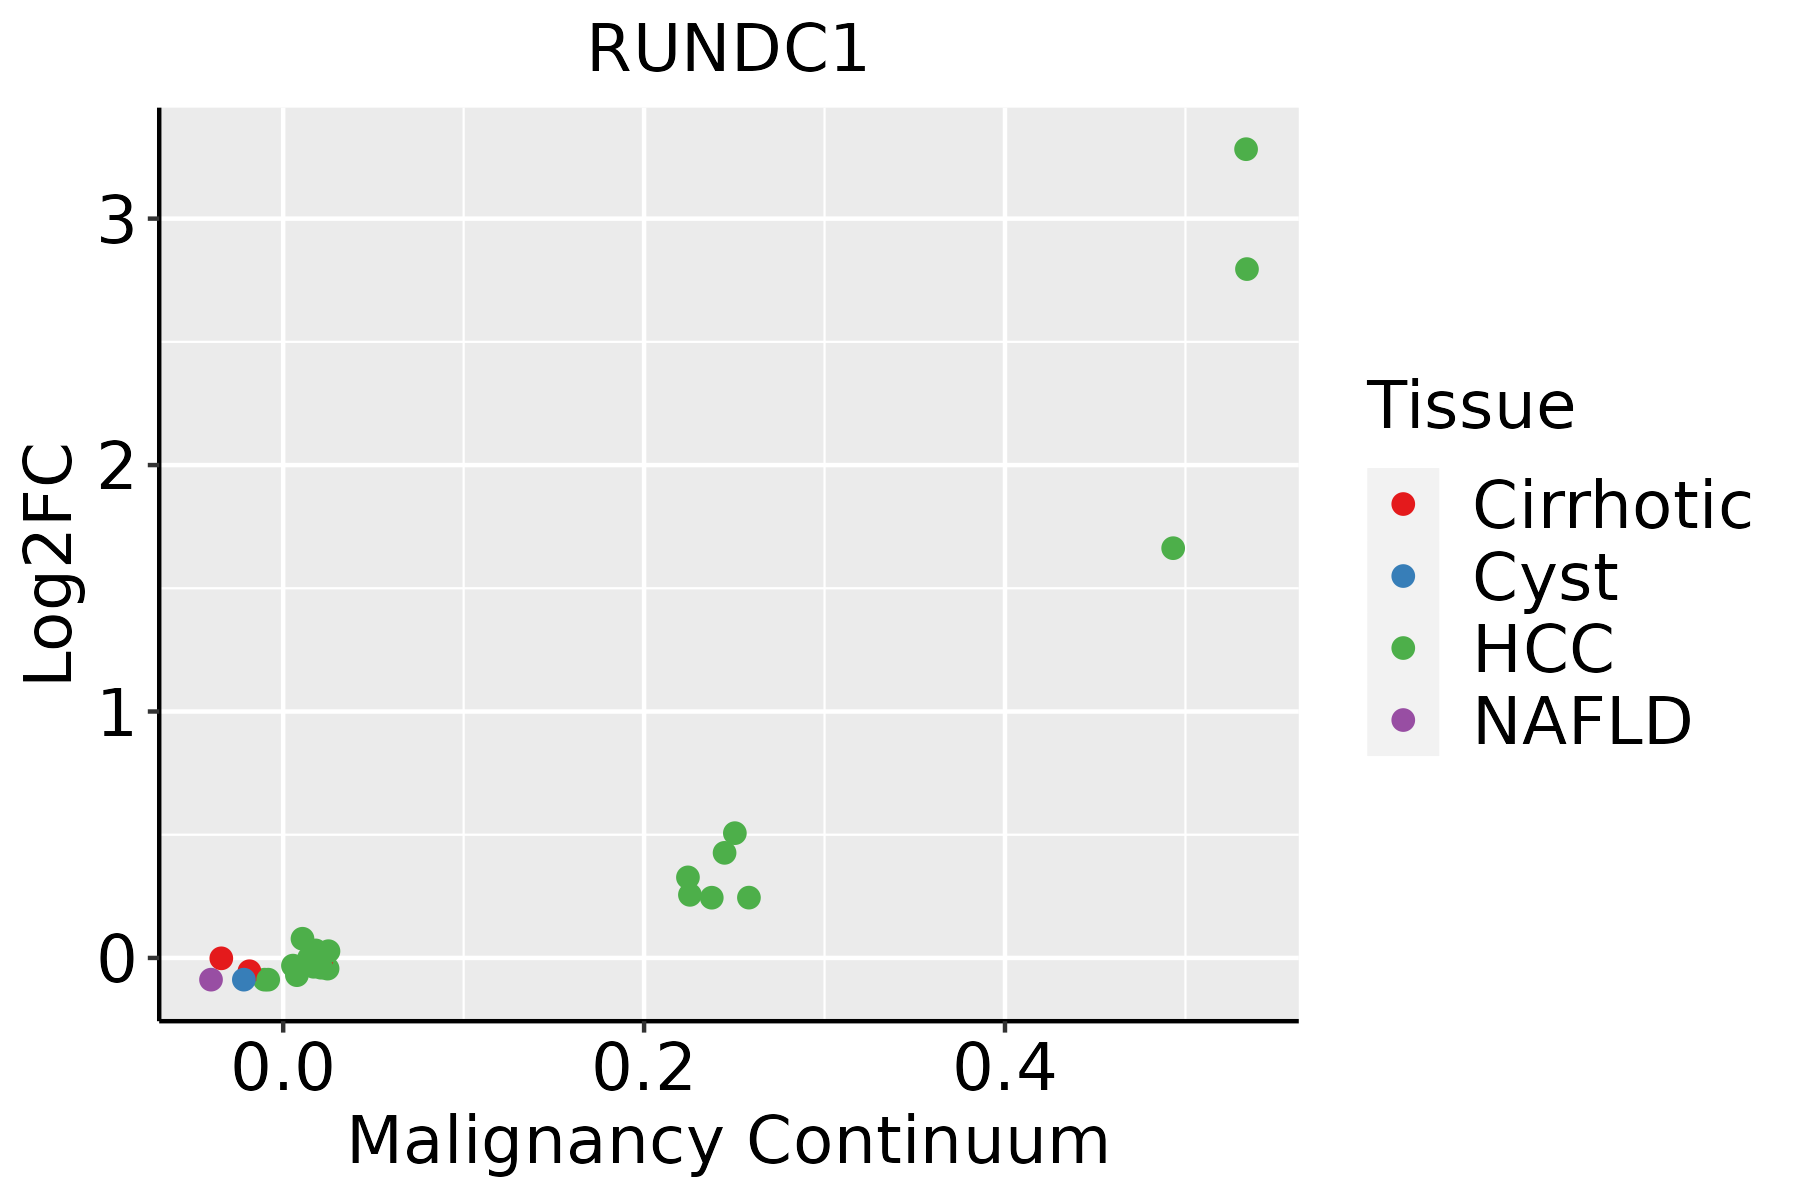 | HCC: Hepatocellular carcinoma |
| NAFLD: Non-alcoholic fatty liver disease | ||
| Oral Cavity |  | EOLP: Erosive Oral lichen planus |
| LP: leukoplakia | ||
| NEOLP: Non-erosive oral lichen planus | ||
| OSCC: Oral squamous cell carcinoma |
| ∗log2FC in expression of this searched gene in stem-like cells from each diseased tissue sample relative to stem-like cells in normal samples in each tissue plotted against the malignancy continuum. Samples are colored based on if they are from different disease stage. |
Top |
Malignant transformation related pathway analysis |
| Find out the enriched GO biological processes and KEGG pathways involved in transition from healthy to precancer to cancer |
| Tissue | Disease Stage | Enriched GO biological Processes |
| Colorectum | AD |  |
| Colorectum | SER |  |
| Colorectum | MSS |  |
| Colorectum | MSI-H |  |
| Colorectum | FAP |  |
| ∗Top 15 enriched GO BP terms are showed in the bar plot of each disease state in each tissue. Each row represents a significant GO biological process which is colored according to the -log10(p.adjust). |
| Page: 1 2 3 4 5 6 7 8 9 |
| GO ID | Tissue | Disease Stage | Description | Gene Ratio | Bg Ratio | pvalue | p.adjust | Count |
| GO:000170111 | Liver | HCC | in utero embryonic development | 204/7958 | 367/18723 | 2.44e-07 | 4.30e-06 | 204 |
| GO:000170116 | Oral cavity | OSCC | in utero embryonic development | 207/7305 | 367/18723 | 7.92e-12 | 2.95e-10 | 207 |
| GO:004308710 | Oral cavity | OSCC | regulation of GTPase activity | 165/7305 | 348/18723 | 7.94e-04 | 4.27e-03 | 165 |
| Page: 1 |
| Pathway ID | Tissue | Disease Stage | Description | Gene Ratio | Bg Ratio | pvalue | p.adjust | qvalue | Count |
| Page: 1 |
Top |
Cell-cell communication analysis |
| Identification of potential cell-cell interactions between two cell types and their ligand-receptor pairs for different disease states |
| Ligand | Receptor | LRpair | Pathway | Tissue | Disease Stage |
| Page: 1 |
Top |
Single-cell gene regulatory network inference analysis |
| Find out the significant the regulons (TFs) and the target genes of each regulon across cell types for different disease states |
| TF | Cell Type | Tissue | Disease Stage | Target Gene | RSS | Regulon Activity |
| ∗The dot plots of a searched regulon are shown for all cell subpopulations in each disease state of each tissue based on the regulon specific score inferred using pySCENIC and by calculating the average expression. |
| Page: 1 |
Top |
Somatic mutation of malignant transformation related genes |
| Annotation of somatic variants for genes involved in malignant transformation |
| Hugo Symbol | Variant Class | Variant Classification | dbSNP RS | HGVSc | HGVSp | HGVSp Short | SWISSPROT | BIOTYPE | SIFT | PolyPhen | Tumor Sample Barcode | Tissue | Histology | Sex | Age | Stage | Therapy Types | Drugs | Outcome |
| RUNDC1 | SNV | Missense_Mutation | c.656G>T | p.Arg219Leu | p.R219L | Q96C34 | protein_coding | tolerated(0.09) | benign(0.014) | TCGA-AO-A124-01 | Breast | breast invasive carcinoma | Female | <65 | I/II | Chemotherapy | doxorubicin | SD | |
| RUNDC1 | SNV | Missense_Mutation | c.619N>A | p.Asp207Asn | p.D207N | Q96C34 | protein_coding | deleterious(0.02) | benign(0.255) | TCGA-D8-A1J8-01 | Breast | breast invasive carcinoma | Female | >=65 | I/II | Hormone Therapy | nolvadex | SD | |
| RUNDC1 | SNV | Missense_Mutation | novel | c.1157N>G | p.Glu386Gly | p.E386G | Q96C34 | protein_coding | deleterious(0.01) | benign(0.018) | TCGA-D8-A1XV-01 | Breast | breast invasive carcinoma | Female | >=65 | I/II | Unknown | Unknown | SD |
| RUNDC1 | SNV | Missense_Mutation | rs750660231 | c.655N>T | p.Arg219Trp | p.R219W | Q96C34 | protein_coding | deleterious(0) | benign(0.425) | TCGA-EA-A97N-01 | Cervix | cervical & endocervical cancer | Female | <65 | I/II | Unknown | Unknown | SD |
| RUNDC1 | SNV | Missense_Mutation | rs755761147 | c.868N>G | p.Ser290Gly | p.S290G | Q96C34 | protein_coding | deleterious(0.02) | benign(0.001) | TCGA-HG-A2PA-01 | Cervix | cervical & endocervical cancer | Female | <65 | I/II | Unspecific | Taxol | PD |
| RUNDC1 | SNV | Missense_Mutation | rs771660205 | c.1481G>A | p.Arg494Gln | p.R494Q | Q96C34 | protein_coding | tolerated(0.18) | possibly_damaging(0.738) | TCGA-AA-A010-01 | Colorectum | colon adenocarcinoma | Female | <65 | I/II | Chemotherapy | folinic | CR |
| RUNDC1 | insertion | Frame_Shift_Ins | novel | c.1531_1532insC | p.Lys513GlnfsTer16 | p.K513Qfs*16 | Q96C34 | protein_coding | TCGA-CM-6162-01 | Colorectum | colon adenocarcinoma | Female | <65 | III/IV | Chemotherapy | oxaliplatin | SD | ||
| RUNDC1 | SNV | Missense_Mutation | novel | c.1316N>T | p.Ala439Val | p.A439V | Q96C34 | protein_coding | deleterious(0.04) | possibly_damaging(0.819) | TCGA-AJ-A3BH-01 | Endometrium | uterine corpus endometrioid carcinoma | Female | Unknown | I/II | Unknown | Unknown | SD |
| RUNDC1 | SNV | Missense_Mutation | rs749602274 | c.1810C>T | p.Arg604Cys | p.R604C | Q96C34 | protein_coding | deleterious(0) | probably_damaging(0.959) | TCGA-B5-A3FA-01 | Endometrium | uterine corpus endometrioid carcinoma | Female | >=65 | I/II | Unknown | Unknown | SD |
| RUNDC1 | SNV | Missense_Mutation | novel | c.628N>T | p.Pro210Ser | p.P210S | Q96C34 | protein_coding | deleterious(0.03) | possibly_damaging(0.597) | TCGA-DF-A2KU-01 | Endometrium | uterine corpus endometrioid carcinoma | Female | Unknown | I/II | Unknown | Unknown | SD |
| Page: 1 2 3 4 5 |
Top |
Related drugs of malignant transformation related genes |
| Identification of chemicals and drugs interact with genes involved in malignant transfromation |
| (DGIdb 4.0) |
| Entrez ID | Symbol | Category | Interaction Types | Drug Claim Name | Drug Name | PMIDs |
| Page: 1 |

Copyright 2023-Present -The University of Texas Health Science Center at Houston |