
|
|||||
|
 | |
| |
| |
| |
| |
| |
|
Gene: RUFY2 |
Gene summary for RUFY2 |
| Gene information | Species | Human | Gene symbol | RUFY2 | Gene ID | 55680 |
| Gene name | RUN and FYVE domain containing 2 | |
| Gene Alias | RABIP4R | |
| Cytomap | 10q21.3 | |
| Gene Type | protein-coding | GO ID | GO:0006810 | UniProtAcc | Q8WXA3 |
Top |
Malignant transformation analysis |
| Identification of the aberrant gene expression in precancerous and cancerous lesions by comparing the gene expression of stem-like cells in diseased tissues with normal stem cells |
| Entrez ID | Symbol | Replicates | Species | Organ | Tissue | Adj P-value | Log2FC | Malignancy |
| 55680 | RUFY2 | LZE4T | Human | Esophagus | ESCC | 1.05e-06 | 2.40e-01 | 0.0811 |
| 55680 | RUFY2 | LZE24T | Human | Esophagus | ESCC | 6.82e-05 | 2.29e-01 | 0.0596 |
| 55680 | RUFY2 | P1T-E | Human | Esophagus | ESCC | 1.67e-02 | 1.73e-01 | 0.0875 |
| 55680 | RUFY2 | P2T-E | Human | Esophagus | ESCC | 4.54e-17 | 2.81e-01 | 0.1177 |
| 55680 | RUFY2 | P4T-E | Human | Esophagus | ESCC | 2.51e-13 | 2.86e-01 | 0.1323 |
| 55680 | RUFY2 | P5T-E | Human | Esophagus | ESCC | 4.32e-10 | 1.79e-01 | 0.1327 |
| 55680 | RUFY2 | P8T-E | Human | Esophagus | ESCC | 3.83e-05 | 1.83e-01 | 0.0889 |
| 55680 | RUFY2 | P9T-E | Human | Esophagus | ESCC | 3.95e-09 | 1.19e-01 | 0.1131 |
| 55680 | RUFY2 | P10T-E | Human | Esophagus | ESCC | 2.83e-06 | 1.64e-01 | 0.116 |
| 55680 | RUFY2 | P11T-E | Human | Esophagus | ESCC | 1.91e-14 | 4.23e-01 | 0.1426 |
| 55680 | RUFY2 | P12T-E | Human | Esophagus | ESCC | 1.09e-15 | 3.14e-01 | 0.1122 |
| 55680 | RUFY2 | P15T-E | Human | Esophagus | ESCC | 2.14e-10 | 1.73e-01 | 0.1149 |
| 55680 | RUFY2 | P16T-E | Human | Esophagus | ESCC | 5.52e-15 | 2.03e-01 | 0.1153 |
| 55680 | RUFY2 | P20T-E | Human | Esophagus | ESCC | 4.93e-13 | 2.78e-01 | 0.1124 |
| 55680 | RUFY2 | P21T-E | Human | Esophagus | ESCC | 3.46e-16 | 2.76e-01 | 0.1617 |
| 55680 | RUFY2 | P22T-E | Human | Esophagus | ESCC | 2.04e-08 | 1.83e-01 | 0.1236 |
| 55680 | RUFY2 | P23T-E | Human | Esophagus | ESCC | 7.18e-14 | 2.40e-01 | 0.108 |
| 55680 | RUFY2 | P24T-E | Human | Esophagus | ESCC | 1.45e-16 | 3.97e-01 | 0.1287 |
| 55680 | RUFY2 | P26T-E | Human | Esophagus | ESCC | 3.52e-14 | 2.52e-01 | 0.1276 |
| 55680 | RUFY2 | P27T-E | Human | Esophagus | ESCC | 7.61e-16 | 2.84e-01 | 0.1055 |
| Page: 1 2 3 4 |
| Tissue | Expression Dynamics | Abbreviation |
| Esophagus |  | ESCC: Esophageal squamous cell carcinoma |
| HGIN: High-grade intraepithelial neoplasias | ||
| LGIN: Low-grade intraepithelial neoplasias | ||
| Thyroid | 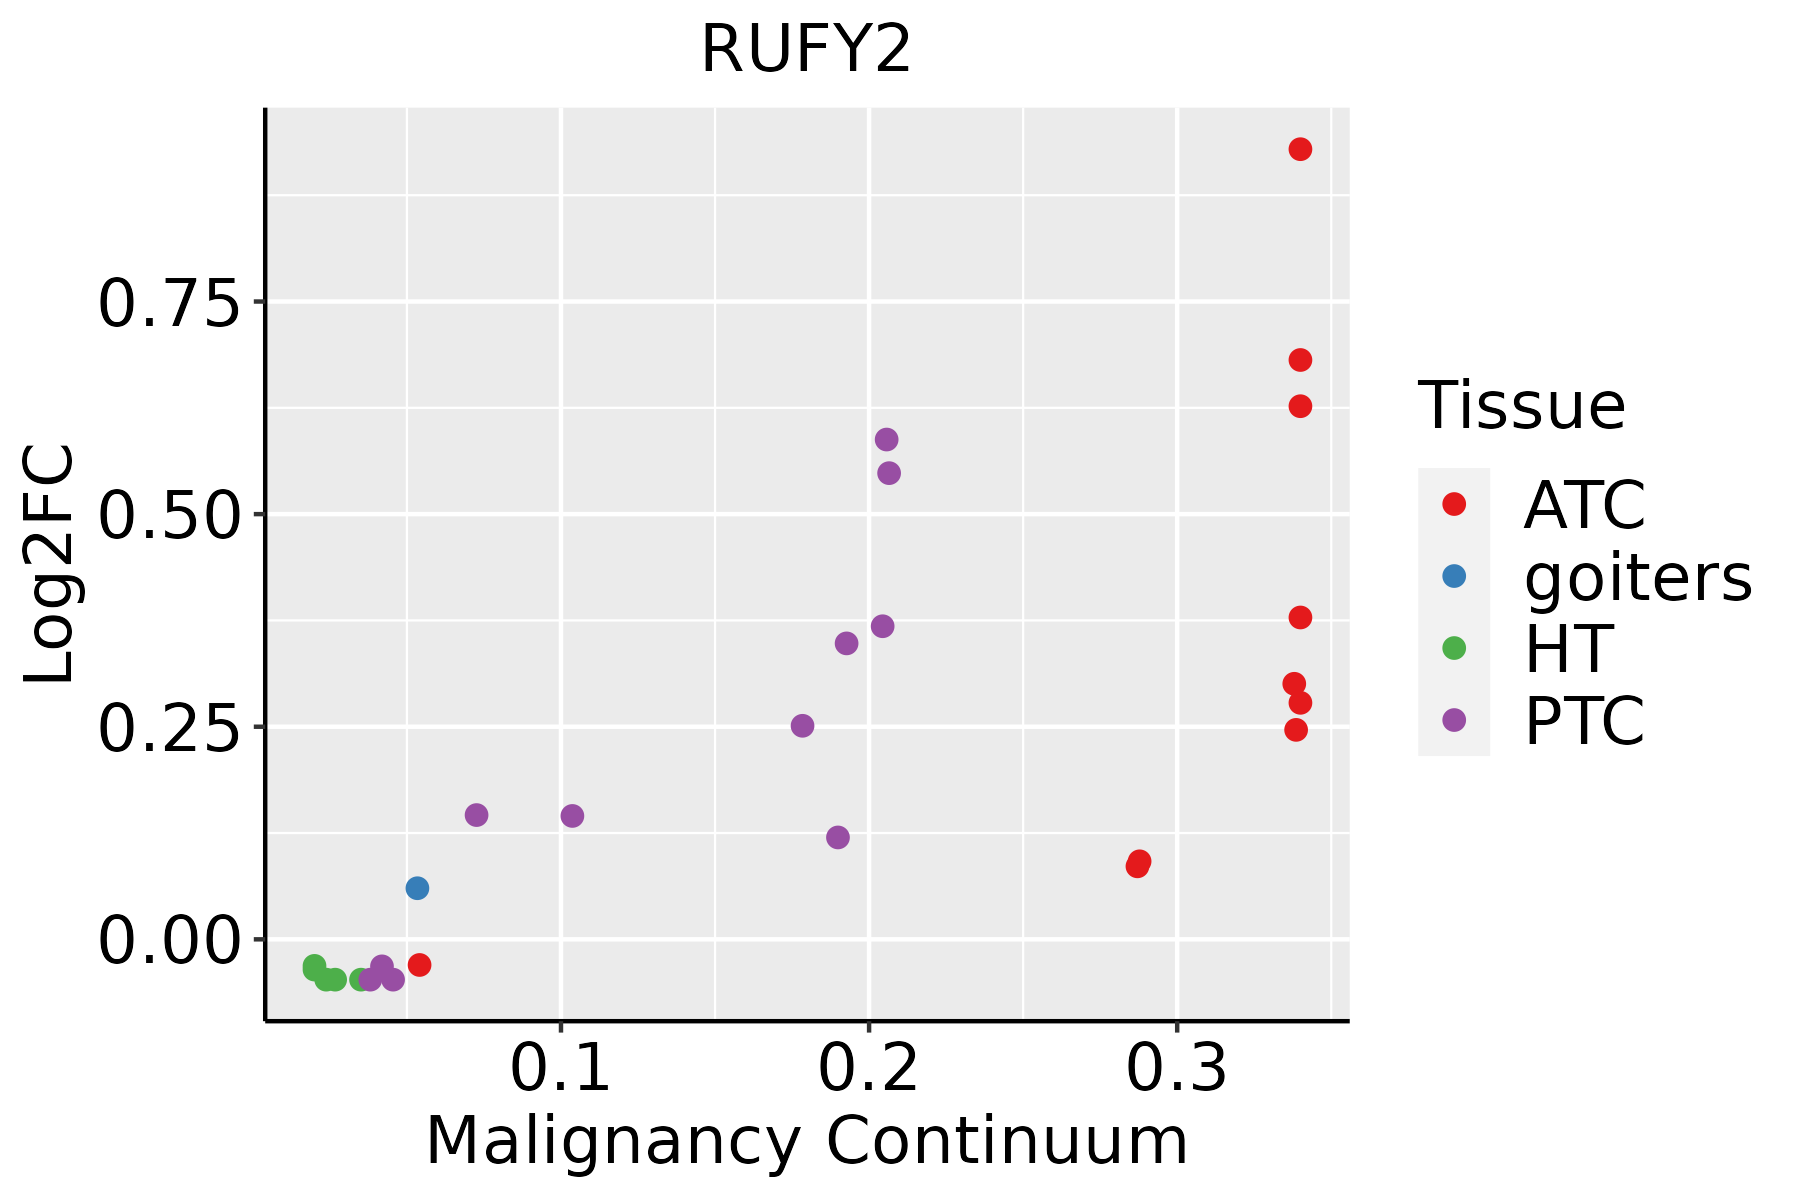 | ATC: Anaplastic thyroid cancer |
| HT: Hashimoto's thyroiditis | ||
| PTC: Papillary thyroid cancer |
| ∗log2FC in expression of this searched gene in stem-like cells from each diseased tissue sample relative to stem-like cells in normal samples in each tissue plotted against the malignancy continuum. Samples are colored based on if they are from different disease stage. |
Top |
Malignant transformation related pathway analysis |
| Find out the enriched GO biological processes and KEGG pathways involved in transition from healthy to precancer to cancer |
| Tissue | Disease Stage | Enriched GO biological Processes |
| Colorectum | AD |  |
| Colorectum | SER |  |
| Colorectum | MSS |  |
| Colorectum | MSI-H |  |
| Colorectum | FAP |  |
| ∗Top 15 enriched GO BP terms are showed in the bar plot of each disease state in each tissue. Each row represents a significant GO biological process which is colored according to the -log10(p.adjust). |
| Page: 1 2 3 4 5 6 7 8 9 |
| GO ID | Tissue | Disease Stage | Description | Gene Ratio | Bg Ratio | pvalue | p.adjust | Count |
| GO:003010018 | Esophagus | ESCC | regulation of endocytosis | 135/8552 | 211/18723 | 5.75e-08 | 1.02e-06 | 135 |
| GO:003010020 | Thyroid | PTC | regulation of endocytosis | 108/5968 | 211/18723 | 3.92e-09 | 1.04e-07 | 108 |
| GO:0030100111 | Thyroid | ATC | regulation of endocytosis | 113/6293 | 211/18723 | 1.71e-09 | 4.22e-08 | 113 |
| Page: 1 |
| Pathway ID | Tissue | Disease Stage | Description | Gene Ratio | Bg Ratio | pvalue | p.adjust | qvalue | Count |
| hsa04144210 | Esophagus | ESCC | Endocytosis | 186/4205 | 251/8465 | 9.74e-16 | 4.66e-14 | 2.39e-14 | 186 |
| hsa0414437 | Esophagus | ESCC | Endocytosis | 186/4205 | 251/8465 | 9.74e-16 | 4.66e-14 | 2.39e-14 | 186 |
| Page: 1 |
Top |
Cell-cell communication analysis |
| Identification of potential cell-cell interactions between two cell types and their ligand-receptor pairs for different disease states |
| Ligand | Receptor | LRpair | Pathway | Tissue | Disease Stage |
| Page: 1 |
Top |
Single-cell gene regulatory network inference analysis |
| Find out the significant the regulons (TFs) and the target genes of each regulon across cell types for different disease states |
| TF | Cell Type | Tissue | Disease Stage | Target Gene | RSS | Regulon Activity |
| ∗The dot plots of a searched regulon are shown for all cell subpopulations in each disease state of each tissue based on the regulon specific score inferred using pySCENIC and by calculating the average expression. |
| Page: 1 |
Top |
Somatic mutation of malignant transformation related genes |
| Annotation of somatic variants for genes involved in malignant transformation |
| Hugo Symbol | Variant Class | Variant Classification | dbSNP RS | HGVSc | HGVSp | HGVSp Short | SWISSPROT | BIOTYPE | SIFT | PolyPhen | Tumor Sample Barcode | Tissue | Histology | Sex | Age | Stage | Therapy Types | Drugs | Outcome |
| RUFY2 | SNV | Missense_Mutation | rs771715001 | c.709N>G | p.Ile237Val | p.I237V | Q8WXA3 | protein_coding | tolerated(0.69) | benign(0.007) | TCGA-BH-A208-01 | Breast | breast invasive carcinoma | Female | <65 | I/II | Unknown | Unknown | SD |
| RUFY2 | SNV | Missense_Mutation | novel | c.355N>A | p.Glu119Lys | p.E119K | Q8WXA3 | protein_coding | deleterious(0) | probably_damaging(0.987) | TCGA-D8-A1JA-01 | Breast | breast invasive carcinoma | Female | <65 | III/IV | Chemotherapy | adriamycin | PD |
| RUFY2 | deletion | Frame_Shift_Del | rs759904440 | c.457delA | p.Met153TrpfsTer8 | p.M153Wfs*8 | Q8WXA3 | protein_coding | TCGA-D8-A1XK-01 | Breast | breast invasive carcinoma | Female | <65 | I/II | Chemotherapy | doxorubicine+cyclophosphamide | SD | ||
| RUFY2 | SNV | Missense_Mutation | novel | c.1879T>A | p.Ser627Thr | p.S627T | Q8WXA3 | protein_coding | tolerated(0.84) | benign(0.001) | TCGA-2W-A8YY-01 | Cervix | cervical & endocervical cancer | Female | <65 | I/II | Chemotherapy | cisplatin | CR |
| RUFY2 | SNV | Missense_Mutation | novel | c.10N>G | p.Gln4Glu | p.Q4E | Q8WXA3 | protein_coding | tolerated_low_confidence(0.28) | benign(0) | TCGA-VS-A9U6-01 | Cervix | cervical & endocervical cancer | Female | <65 | I/II | Chemotherapy | cisplatin | PD |
| RUFY2 | SNV | Missense_Mutation | c.70G>A | p.Glu24Lys | p.E24K | Q8WXA3 | protein_coding | tolerated(0.78) | benign(0) | TCGA-VS-A9U7-01 | Cervix | cervical & endocervical cancer | Female | <65 | I/II | Chemotherapy | cisplatin | CR | |
| RUFY2 | SNV | Missense_Mutation | c.1175N>A | p.Val392Asp | p.V392D | Q8WXA3 | protein_coding | deleterious(0) | probably_damaging(0.997) | TCGA-G4-6304-01 | Colorectum | colon adenocarcinoma | Female | >=65 | I/II | Chemotherapy | fluorouracil | PD | |
| RUFY2 | SNV | Missense_Mutation | c.1286C>T | p.Ala429Val | p.A429V | Q8WXA3 | protein_coding | tolerated(0.09) | benign(0.003) | TCGA-EI-6882-01 | Colorectum | rectum adenocarcinoma | Male | <65 | I/II | Unknown | Unknown | SD | |
| RUFY2 | SNV | Missense_Mutation | novel | c.1557A>C | p.Lys519Asn | p.K519N | Q8WXA3 | protein_coding | tolerated(0.06) | probably_damaging(0.994) | TCGA-F5-6814-01 | Colorectum | rectum adenocarcinoma | Male | <65 | I/II | Unknown | Unknown | SD |
| RUFY2 | SNV | Missense_Mutation | c.363G>C | p.Glu121Asp | p.E121D | Q8WXA3 | protein_coding | deleterious(0.05) | benign(0.21) | TCGA-F5-6864-01 | Colorectum | rectum adenocarcinoma | Female | >=65 | III/IV | Chemotherapy | 5-fluorouracil | CR |
| Page: 1 2 3 4 5 6 7 |
Top |
Related drugs of malignant transformation related genes |
| Identification of chemicals and drugs interact with genes involved in malignant transfromation |
| (DGIdb 4.0) |
| Entrez ID | Symbol | Category | Interaction Types | Drug Claim Name | Drug Name | PMIDs |
| Page: 1 |

Copyright 2023-Present -The University of Texas Health Science Center at Houston |