
|
|||||
|
 | |
| |
| |
| |
| |
| |
|
Gene: RUBCNL |
Gene summary for RUBCNL |
| Gene information | Species | Human | Gene symbol | RUBCNL | Gene ID | 80183 |
| Gene name | rubicon like autophagy enhancer | |
| Gene Alias | C13orf18 | |
| Cytomap | 13q14.13 | |
| Gene Type | protein-coding | GO ID | GO:0005975 | UniProtAcc | Q9H714 |
Top |
Malignant transformation analysis |
| Identification of the aberrant gene expression in precancerous and cancerous lesions by comparing the gene expression of stem-like cells in diseased tissues with normal stem cells |
| Entrez ID | Symbol | Replicates | Species | Organ | Tissue | Adj P-value | Log2FC | Malignancy |
| 80183 | RUBCNL | HTA11_1938_2000001011 | Human | Colorectum | AD | 1.30e-02 | -4.19e-01 | -0.0811 |
| 80183 | RUBCNL | HTA11_78_2000001011 | Human | Colorectum | AD | 9.89e-04 | -3.94e-01 | -0.1088 |
| 80183 | RUBCNL | HTA11_6818_2000001021 | Human | Colorectum | AD | 3.59e-03 | 5.02e-01 | 0.0588 |
| 80183 | RUBCNL | HTA11_99999970781_79442 | Human | Colorectum | MSS | 1.63e-22 | -4.84e-01 | 0.294 |
| 80183 | RUBCNL | HTA11_99999965104_69814 | Human | Colorectum | MSS | 6.09e-08 | -4.84e-01 | 0.281 |
| 80183 | RUBCNL | HTA11_99999971662_82457 | Human | Colorectum | MSS | 1.15e-20 | -4.84e-01 | 0.3859 |
| 80183 | RUBCNL | HTA11_99999973899_84307 | Human | Colorectum | MSS | 9.30e-06 | -4.84e-01 | 0.2585 |
| 80183 | RUBCNL | HTA11_99999974143_84620 | Human | Colorectum | MSS | 9.02e-22 | -4.84e-01 | 0.3005 |
| 80183 | RUBCNL | A015-C-203 | Human | Colorectum | FAP | 3.26e-12 | 3.38e-02 | -0.1294 |
| 80183 | RUBCNL | A015-C-204 | Human | Colorectum | FAP | 2.17e-02 | -2.75e-01 | -0.0228 |
| 80183 | RUBCNL | A002-C-201 | Human | Colorectum | FAP | 5.44e-04 | -1.03e-01 | 0.0324 |
| 80183 | RUBCNL | A001-C-108 | Human | Colorectum | FAP | 9.88e-06 | -1.92e-02 | -0.0272 |
| 80183 | RUBCNL | A002-C-205 | Human | Colorectum | FAP | 2.64e-08 | -1.56e-01 | -0.1236 |
| 80183 | RUBCNL | A015-C-006 | Human | Colorectum | FAP | 5.42e-05 | -1.93e-01 | -0.0994 |
| 80183 | RUBCNL | A002-C-114 | Human | Colorectum | FAP | 4.48e-06 | -9.03e-02 | -0.1561 |
| 80183 | RUBCNL | A015-C-104 | Human | Colorectum | FAP | 2.04e-12 | 8.55e-02 | -0.1899 |
| 80183 | RUBCNL | A001-C-014 | Human | Colorectum | FAP | 1.06e-02 | 9.41e-02 | 0.0135 |
| 80183 | RUBCNL | A002-C-016 | Human | Colorectum | FAP | 7.20e-10 | -1.73e-01 | 0.0521 |
| 80183 | RUBCNL | A015-C-002 | Human | Colorectum | FAP | 1.94e-03 | 7.42e-02 | -0.0763 |
| 80183 | RUBCNL | A002-C-116 | Human | Colorectum | FAP | 1.17e-12 | -1.31e-01 | -0.0452 |
| Page: 1 2 |
| Tissue | Expression Dynamics | Abbreviation |
| Colorectum (GSE201348) |  | FAP: Familial adenomatous polyposis |
| CRC: Colorectal cancer | ||
| Colorectum (HTA11) | 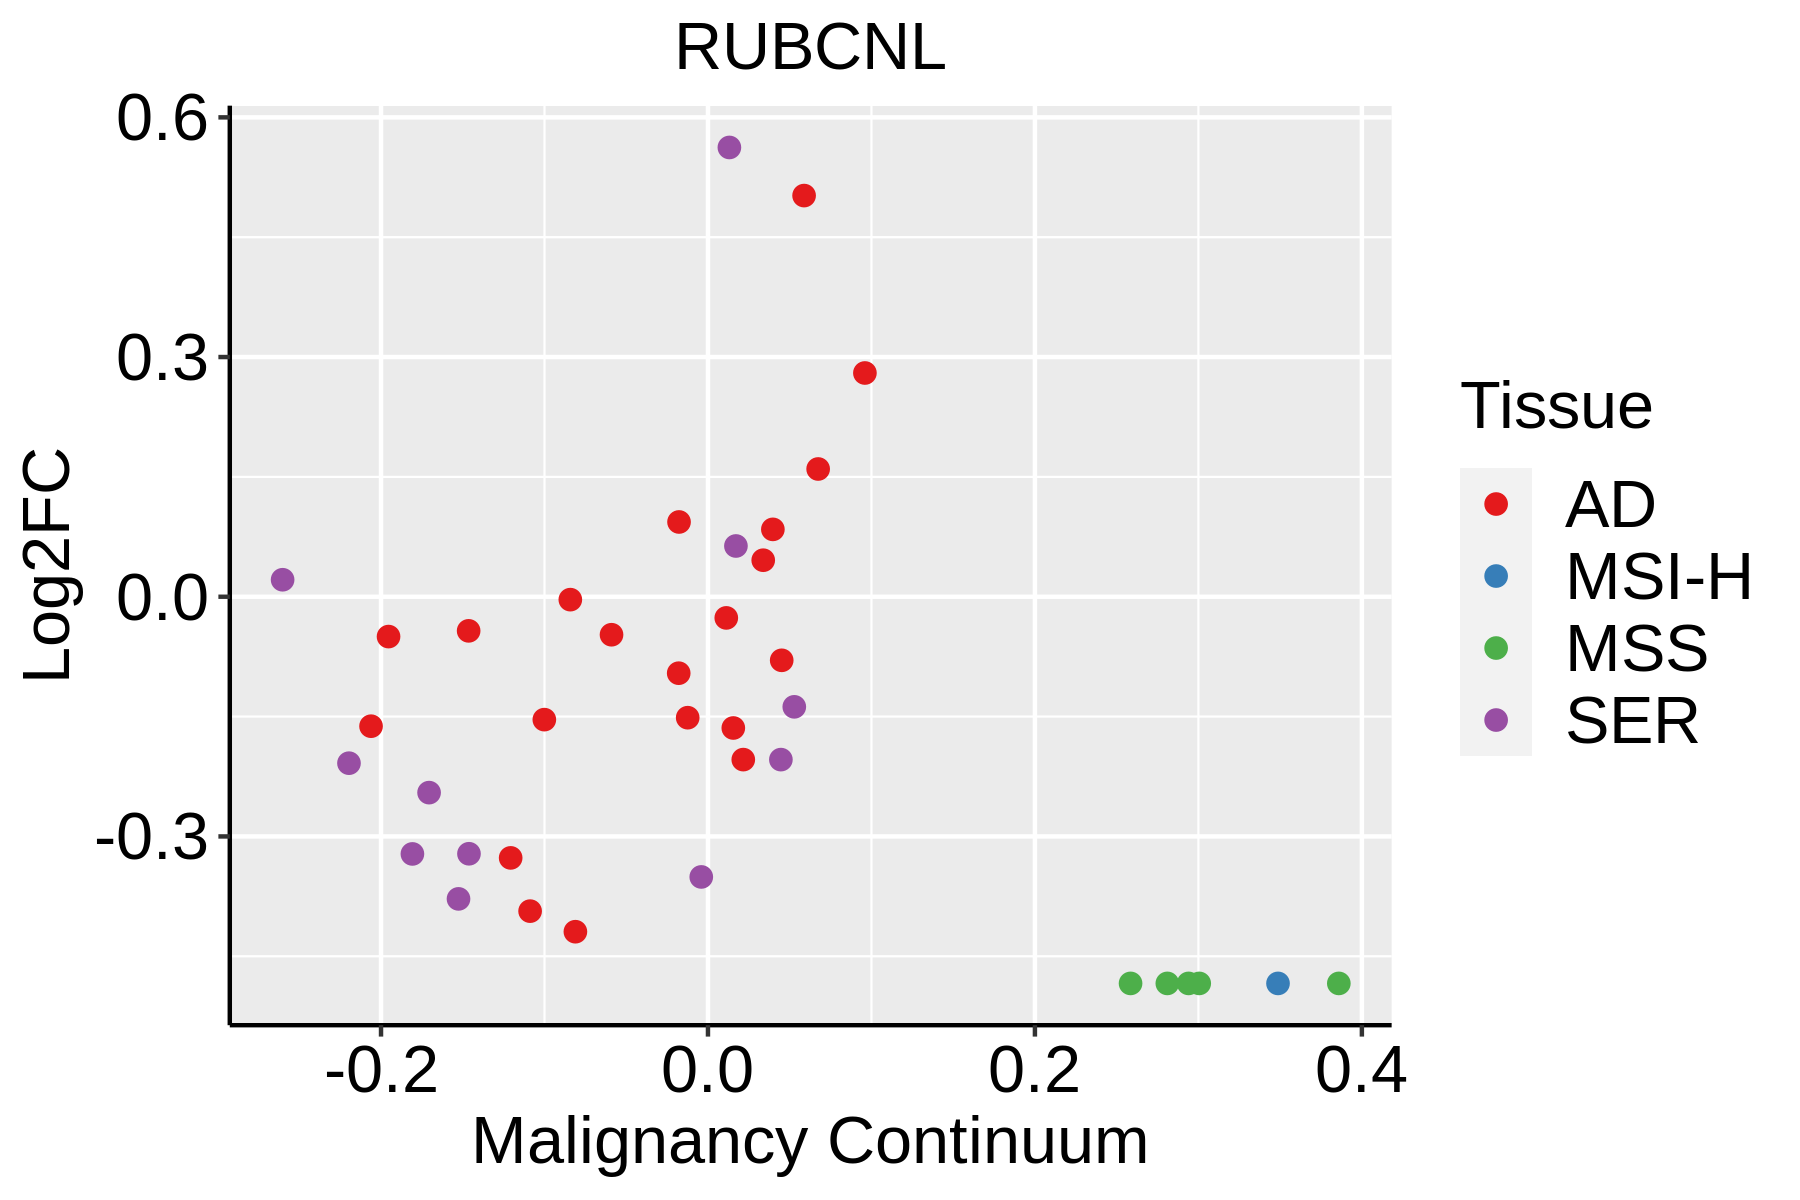 | AD: Adenomas |
| SER: Sessile serrated lesions | ||
| MSI-H: Microsatellite-high colorectal cancer | ||
| MSS: Microsatellite stable colorectal cancer |
| ∗log2FC in expression of this searched gene in stem-like cells from each diseased tissue sample relative to stem-like cells in normal samples in each tissue plotted against the malignancy continuum. Samples are colored based on if they are from different disease stage. |
Top |
Malignant transformation related pathway analysis |
| Find out the enriched GO biological processes and KEGG pathways involved in transition from healthy to precancer to cancer |
| Tissue | Disease Stage | Enriched GO biological Processes |
| Colorectum | AD |  |
| Colorectum | SER |  |
| Colorectum | MSS |  |
| Colorectum | MSI-H |  |
| Colorectum | FAP |  |
| ∗Top 15 enriched GO BP terms are showed in the bar plot of each disease state in each tissue. Each row represents a significant GO biological process which is colored according to the -log10(p.adjust). |
| Page: 1 2 3 4 5 6 7 8 9 |
| GO ID | Tissue | Disease Stage | Description | Gene Ratio | Bg Ratio | pvalue | p.adjust | Count |
| GO:0006091 | Colorectum | AD | generation of precursor metabolites and energy | 209/3918 | 490/18723 | 3.17e-28 | 6.61e-25 | 209 |
| GO:0015980 | Colorectum | AD | energy derivation by oxidation of organic compounds | 143/3918 | 318/18723 | 2.78e-22 | 2.49e-19 | 143 |
| GO:0022411 | Colorectum | AD | cellular component disassembly | 147/3918 | 443/18723 | 8.53e-10 | 6.76e-08 | 147 |
| GO:0016236 | Colorectum | AD | macroautophagy | 103/3918 | 291/18723 | 6.76e-09 | 4.15e-07 | 103 |
| GO:0032984 | Colorectum | AD | protein-containing complex disassembly | 81/3918 | 224/18723 | 9.41e-08 | 4.65e-06 | 81 |
| GO:0016050 | Colorectum | AD | vesicle organization | 101/3918 | 300/18723 | 1.65e-07 | 7.17e-06 | 101 |
| GO:0043467 | Colorectum | AD | regulation of generation of precursor metabolites and energy | 49/3918 | 130/18723 | 8.33e-06 | 1.99e-04 | 49 |
| GO:0019318 | Colorectum | AD | hexose metabolic process | 77/3918 | 237/18723 | 1.96e-05 | 4.01e-04 | 77 |
| GO:0044262 | Colorectum | AD | cellular carbohydrate metabolic process | 87/3918 | 283/18723 | 6.00e-05 | 1.01e-03 | 87 |
| GO:0005996 | Colorectum | AD | monosaccharide metabolic process | 80/3918 | 257/18723 | 7.31e-05 | 1.17e-03 | 80 |
| GO:0006006 | Colorectum | AD | glucose metabolic process | 62/3918 | 196/18723 | 2.76e-04 | 3.39e-03 | 62 |
| GO:0006109 | Colorectum | AD | regulation of carbohydrate metabolic process | 55/3918 | 178/18723 | 1.10e-03 | 1.01e-02 | 55 |
| GO:0062012 | Colorectum | AD | regulation of small molecule metabolic process | 93/3918 | 334/18723 | 1.46e-03 | 1.24e-02 | 93 |
| GO:0048284 | Colorectum | AD | organelle fusion | 42/3918 | 141/18723 | 8.04e-03 | 4.73e-02 | 42 |
| GO:00060912 | Colorectum | MSS | generation of precursor metabolites and energy | 186/3467 | 490/18723 | 1.14e-24 | 2.15e-21 | 186 |
| GO:00159802 | Colorectum | MSS | energy derivation by oxidation of organic compounds | 131/3467 | 318/18723 | 2.60e-21 | 2.70e-18 | 131 |
| GO:00224112 | Colorectum | MSS | cellular component disassembly | 130/3467 | 443/18723 | 1.44e-08 | 8.46e-07 | 130 |
| GO:00162362 | Colorectum | MSS | macroautophagy | 93/3467 | 291/18723 | 2.08e-08 | 1.17e-06 | 93 |
| GO:00160502 | Colorectum | MSS | vesicle organization | 93/3467 | 300/18723 | 1.04e-07 | 4.97e-06 | 93 |
| GO:00434672 | Colorectum | MSS | regulation of generation of precursor metabolites and energy | 47/3467 | 130/18723 | 1.47e-06 | 4.85e-05 | 47 |
| Page: 1 2 3 |
| Pathway ID | Tissue | Disease Stage | Description | Gene Ratio | Bg Ratio | pvalue | p.adjust | qvalue | Count |
| Page: 1 |
Top |
Cell-cell communication analysis |
| Identification of potential cell-cell interactions between two cell types and their ligand-receptor pairs for different disease states |
| Ligand | Receptor | LRpair | Pathway | Tissue | Disease Stage |
| Page: 1 |
Top |
Single-cell gene regulatory network inference analysis |
| Find out the significant the regulons (TFs) and the target genes of each regulon across cell types for different disease states |
| TF | Cell Type | Tissue | Disease Stage | Target Gene | RSS | Regulon Activity |
| ∗The dot plots of a searched regulon are shown for all cell subpopulations in each disease state of each tissue based on the regulon specific score inferred using pySCENIC and by calculating the average expression. |
| Page: 1 |
Top |
Somatic mutation of malignant transformation related genes |
| Annotation of somatic variants for genes involved in malignant transformation |
| Hugo Symbol | Variant Class | Variant Classification | dbSNP RS | HGVSc | HGVSp | HGVSp Short | SWISSPROT | BIOTYPE | SIFT | PolyPhen | Tumor Sample Barcode | Tissue | Histology | Sex | Age | Stage | Therapy Types | Drugs | Outcome |
| RUBCNL | SNV | Missense_Mutation | novel | c.1414N>A | p.Pro472Thr | p.P472T | Q9H714 | protein_coding | deleterious(0) | probably_damaging(1) | TCGA-A7-A6VV-01 | Breast | breast invasive carcinoma | Female | <65 | I/II | Chemotherapy | cyclophosphamide | CR |
| RUBCNL | SNV | Missense_Mutation | rs200512455 | c.1829C>T | p.Thr610Met | p.T610M | Q9H714 | protein_coding | deleterious(0.01) | possibly_damaging(0.892) | TCGA-A8-A09Z-01 | Breast | breast invasive carcinoma | Female | >=65 | I/II | Unknown | Unknown | SD |
| RUBCNL | SNV | Missense_Mutation | c.1675N>C | p.Glu559Gln | p.E559Q | Q9H714 | protein_coding | deleterious(0.02) | benign(0.217) | TCGA-AC-A23H-01 | Breast | breast invasive carcinoma | Female | >=65 | I/II | Unknown | Unknown | PD | |
| RUBCNL | SNV | Missense_Mutation | novel | c.1661N>A | p.Gly554Glu | p.G554E | Q9H714 | protein_coding | tolerated(0.88) | benign(0.021) | TCGA-AN-A046-01 | Breast | breast invasive carcinoma | Female | >=65 | I/II | Unknown | Unknown | SD |
| RUBCNL | insertion | Frame_Shift_Ins | novel | c.62_63insAAGCCAATATTTGATT | p.Asp21GlufsTer12 | p.D21Efs*12 | Q9H714 | protein_coding | TCGA-A7-A0CE-01 | Breast | breast invasive carcinoma | Female | <65 | I/II | Chemotherapy | adriamycin | SD | ||
| RUBCNL | deletion | Frame_Shift_Del | novel | c.129_139delNNNNNNNNNNN | p.Ile44GlufsTer8 | p.I44Efs*8 | Q9H714 | protein_coding | TCGA-BH-A0C0-01 | Breast | breast invasive carcinoma | Female | <65 | I/II | Chemotherapy | carboplatin | SD | ||
| RUBCNL | deletion | Frame_Shift_Del | novel | c.129_139delCATCAGGCTCA | p.Ile44GlufsTer8 | p.I44Efs*8 | Q9H714 | protein_coding | TCGA-BH-A0E1-01 | Breast | breast invasive carcinoma | Female | <65 | I/II | Chemotherapy | cytoxan | SD | ||
| RUBCNL | SNV | Missense_Mutation | novel | c.1683C>A | p.His561Gln | p.H561Q | Q9H714 | protein_coding | deleterious(0) | benign(0.403) | TCGA-2W-A8YY-01 | Cervix | cervical & endocervical cancer | Female | <65 | I/II | Chemotherapy | cisplatin | CR |
| RUBCNL | SNV | Missense_Mutation | novel | c.980N>G | p.Ser327Cys | p.S327C | Q9H714 | protein_coding | tolerated(0.08) | possibly_damaging(0.628) | TCGA-EA-A3HU-01 | Cervix | cervical & endocervical cancer | Female | <65 | I/II | Unknown | Unknown | SD |
| RUBCNL | SNV | Missense_Mutation | c.1596C>G | p.Ile532Met | p.I532M | Q9H714 | protein_coding | tolerated(0.12) | possibly_damaging(0.45) | TCGA-EK-A2H0-01 | Cervix | cervical & endocervical cancer | Female | <65 | I/II | Chemotherapy | cisplatin | CR |
| Page: 1 2 3 4 5 6 7 8 9 10 |
Top |
Related drugs of malignant transformation related genes |
| Identification of chemicals and drugs interact with genes involved in malignant transfromation |
| (DGIdb 4.0) |
| Entrez ID | Symbol | Category | Interaction Types | Drug Claim Name | Drug Name | PMIDs |
| Page: 1 |

Copyright 2023-Present -The University of Texas Health Science Center at Houston |