
|
|||||
|
 | |
| |
| |
| |
| |
| |
|
Gene: RUBCN |
Gene summary for RUBCN |
| Gene information | Species | Human | Gene symbol | RUBCN | Gene ID | 9711 |
| Gene name | rubicon autophagy regulator | |
| Gene Alias | KIAA0226 | |
| Cytomap | 3q29 | |
| Gene Type | protein-coding | GO ID | GO:0002376 | UniProtAcc | Q92622 |
Top |
Malignant transformation analysis |
| Identification of the aberrant gene expression in precancerous and cancerous lesions by comparing the gene expression of stem-like cells in diseased tissues with normal stem cells |
| Entrez ID | Symbol | Replicates | Species | Organ | Tissue | Adj P-value | Log2FC | Malignancy |
| 9711 | RUBCN | LZE4T | Human | Esophagus | ESCC | 3.79e-03 | 1.64e-01 | 0.0811 |
| 9711 | RUBCN | LZE24T | Human | Esophagus | ESCC | 2.94e-11 | 2.57e-01 | 0.0596 |
| 9711 | RUBCN | P1T-E | Human | Esophagus | ESCC | 3.79e-02 | 1.17e-01 | 0.0875 |
| 9711 | RUBCN | P2T-E | Human | Esophagus | ESCC | 5.60e-20 | 2.02e-01 | 0.1177 |
| 9711 | RUBCN | P4T-E | Human | Esophagus | ESCC | 6.67e-07 | 1.48e-01 | 0.1323 |
| 9711 | RUBCN | P5T-E | Human | Esophagus | ESCC | 1.83e-12 | 9.48e-02 | 0.1327 |
| 9711 | RUBCN | P8T-E | Human | Esophagus | ESCC | 3.06e-05 | 9.77e-02 | 0.0889 |
| 9711 | RUBCN | P9T-E | Human | Esophagus | ESCC | 1.57e-07 | 8.63e-02 | 0.1131 |
| 9711 | RUBCN | P10T-E | Human | Esophagus | ESCC | 2.22e-10 | 1.44e-01 | 0.116 |
| 9711 | RUBCN | P11T-E | Human | Esophagus | ESCC | 1.22e-04 | 2.93e-01 | 0.1426 |
| 9711 | RUBCN | P12T-E | Human | Esophagus | ESCC | 1.33e-10 | 6.39e-02 | 0.1122 |
| 9711 | RUBCN | P15T-E | Human | Esophagus | ESCC | 1.83e-14 | 1.86e-01 | 0.1149 |
| 9711 | RUBCN | P16T-E | Human | Esophagus | ESCC | 3.69e-10 | 1.10e-01 | 0.1153 |
| 9711 | RUBCN | P19T-E | Human | Esophagus | ESCC | 5.30e-04 | 2.85e-01 | 0.1662 |
| 9711 | RUBCN | P20T-E | Human | Esophagus | ESCC | 4.26e-09 | 1.24e-01 | 0.1124 |
| 9711 | RUBCN | P21T-E | Human | Esophagus | ESCC | 1.68e-11 | 2.11e-01 | 0.1617 |
| 9711 | RUBCN | P22T-E | Human | Esophagus | ESCC | 4.18e-07 | 7.80e-02 | 0.1236 |
| 9711 | RUBCN | P23T-E | Human | Esophagus | ESCC | 6.68e-10 | 1.13e-01 | 0.108 |
| 9711 | RUBCN | P24T-E | Human | Esophagus | ESCC | 9.46e-09 | 1.34e-01 | 0.1287 |
| 9711 | RUBCN | P26T-E | Human | Esophagus | ESCC | 3.51e-14 | 1.56e-01 | 0.1276 |
| Page: 1 2 3 4 |
| Tissue | Expression Dynamics | Abbreviation |
| Esophagus | 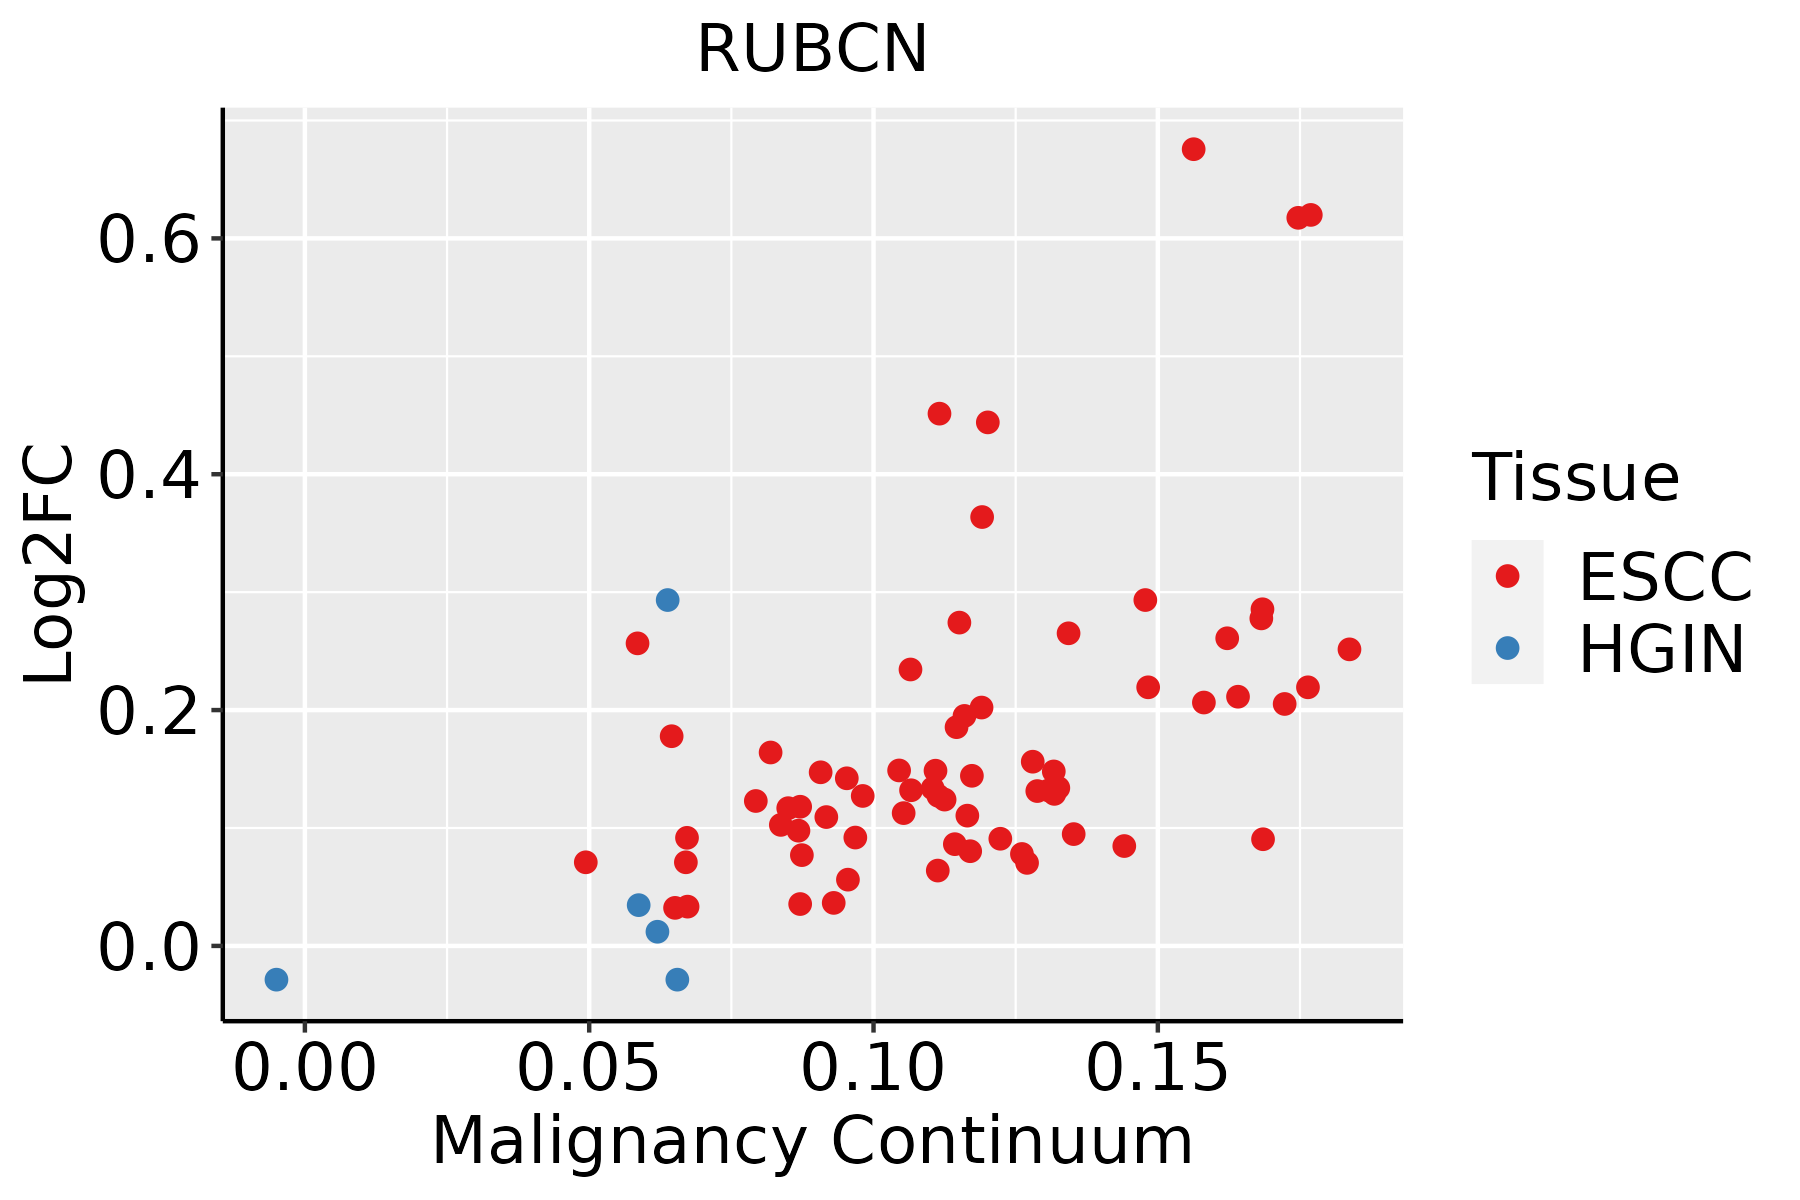 | ESCC: Esophageal squamous cell carcinoma |
| HGIN: High-grade intraepithelial neoplasias | ||
| LGIN: Low-grade intraepithelial neoplasias | ||
| Liver | 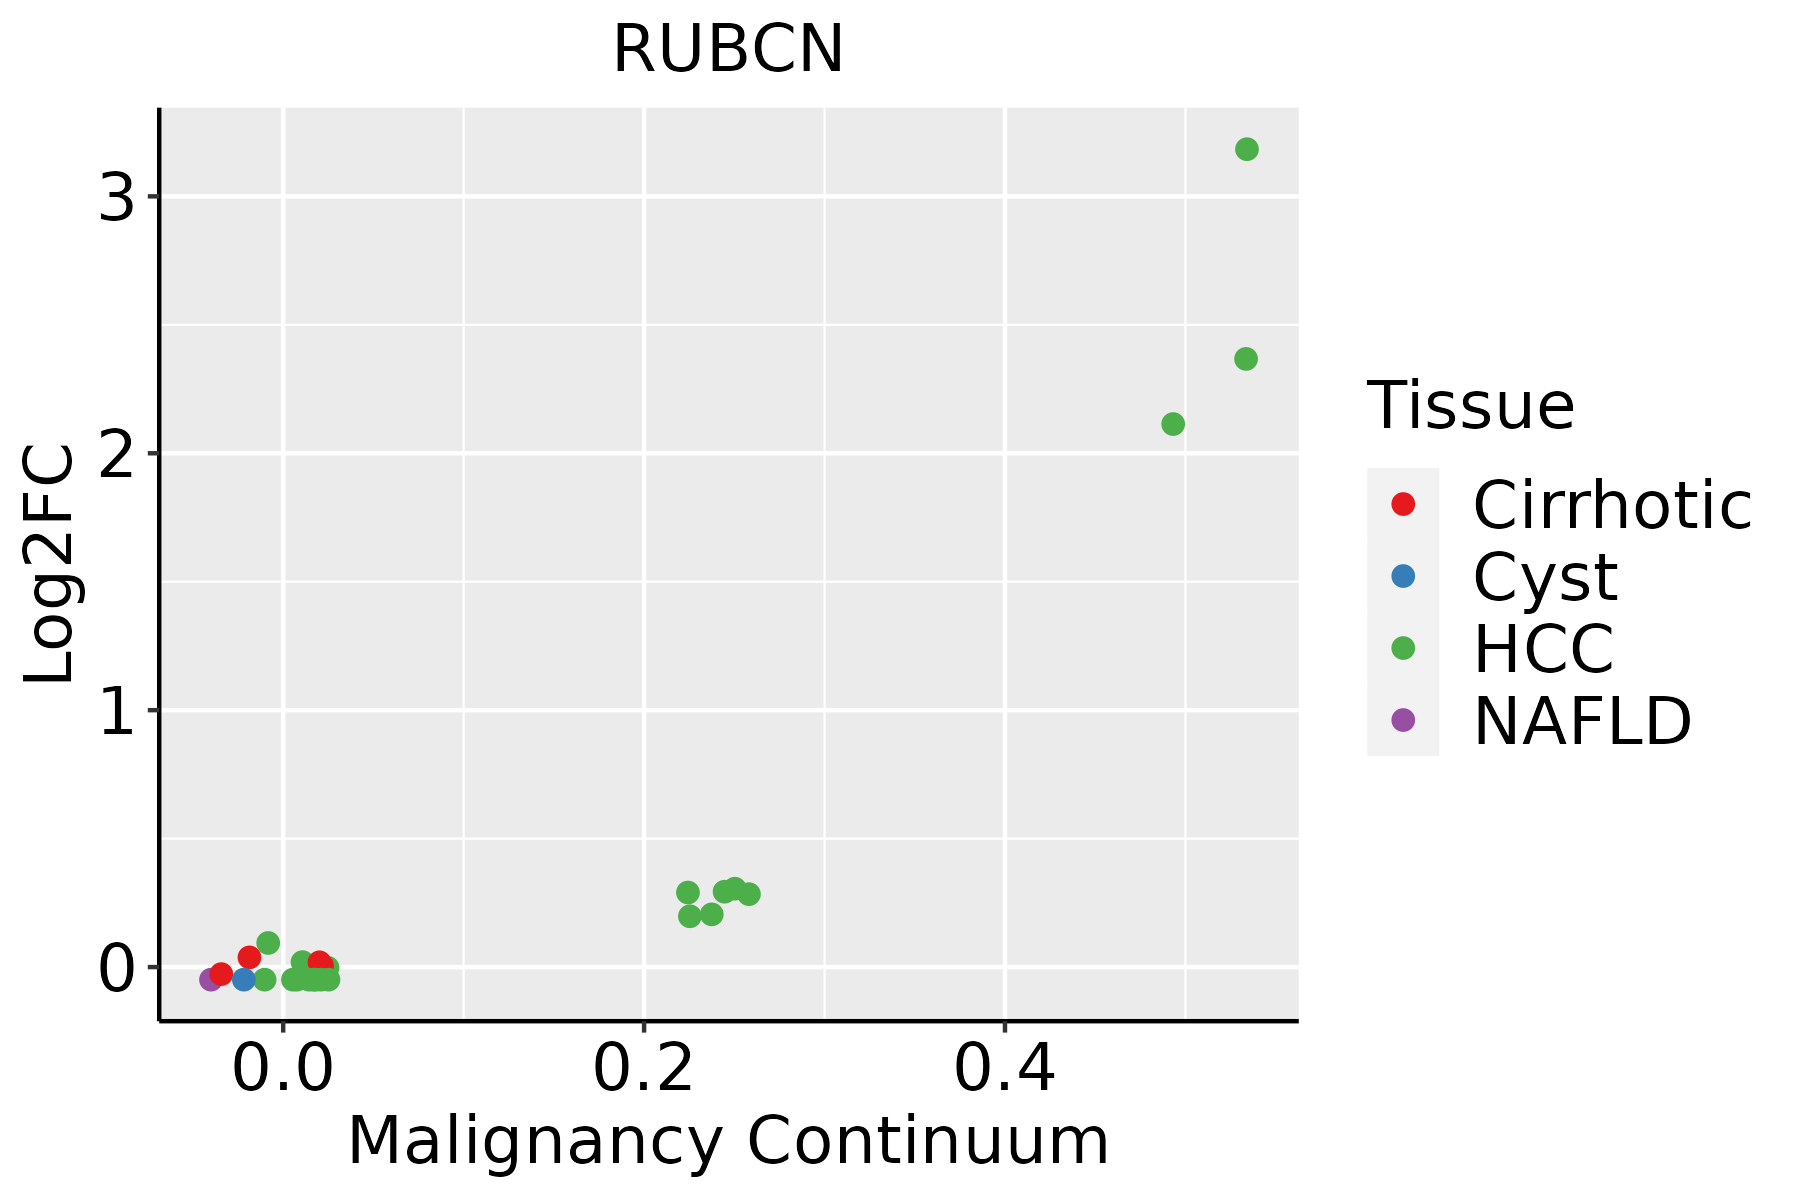 | HCC: Hepatocellular carcinoma |
| NAFLD: Non-alcoholic fatty liver disease | ||
| Oral Cavity |  | EOLP: Erosive Oral lichen planus |
| LP: leukoplakia | ||
| NEOLP: Non-erosive oral lichen planus | ||
| OSCC: Oral squamous cell carcinoma |
| ∗log2FC in expression of this searched gene in stem-like cells from each diseased tissue sample relative to stem-like cells in normal samples in each tissue plotted against the malignancy continuum. Samples are colored based on if they are from different disease stage. |
Top |
Malignant transformation related pathway analysis |
| Find out the enriched GO biological processes and KEGG pathways involved in transition from healthy to precancer to cancer |
| Tissue | Disease Stage | Enriched GO biological Processes |
| Colorectum | AD |  |
| Colorectum | SER |  |
| Colorectum | MSS |  |
| Colorectum | MSI-H |  |
| Colorectum | FAP |  |
| ∗Top 15 enriched GO BP terms are showed in the bar plot of each disease state in each tissue. Each row represents a significant GO biological process which is colored according to the -log10(p.adjust). |
| Page: 1 2 3 4 5 6 7 8 9 |
| GO ID | Tissue | Disease Stage | Description | Gene Ratio | Bg Ratio | pvalue | p.adjust | Count |
| GO:0006091 | Colorectum | AD | generation of precursor metabolites and energy | 209/3918 | 490/18723 | 3.17e-28 | 6.61e-25 | 209 |
| GO:0015980 | Colorectum | AD | energy derivation by oxidation of organic compounds | 143/3918 | 318/18723 | 2.78e-22 | 2.49e-19 | 143 |
| GO:0022411 | Colorectum | AD | cellular component disassembly | 147/3918 | 443/18723 | 8.53e-10 | 6.76e-08 | 147 |
| GO:0016236 | Colorectum | AD | macroautophagy | 103/3918 | 291/18723 | 6.76e-09 | 4.15e-07 | 103 |
| GO:0032984 | Colorectum | AD | protein-containing complex disassembly | 81/3918 | 224/18723 | 9.41e-08 | 4.65e-06 | 81 |
| GO:0016050 | Colorectum | AD | vesicle organization | 101/3918 | 300/18723 | 1.65e-07 | 7.17e-06 | 101 |
| GO:0043467 | Colorectum | AD | regulation of generation of precursor metabolites and energy | 49/3918 | 130/18723 | 8.33e-06 | 1.99e-04 | 49 |
| GO:0019318 | Colorectum | AD | hexose metabolic process | 77/3918 | 237/18723 | 1.96e-05 | 4.01e-04 | 77 |
| GO:0044262 | Colorectum | AD | cellular carbohydrate metabolic process | 87/3918 | 283/18723 | 6.00e-05 | 1.01e-03 | 87 |
| GO:0005996 | Colorectum | AD | monosaccharide metabolic process | 80/3918 | 257/18723 | 7.31e-05 | 1.17e-03 | 80 |
| GO:0006006 | Colorectum | AD | glucose metabolic process | 62/3918 | 196/18723 | 2.76e-04 | 3.39e-03 | 62 |
| GO:0006109 | Colorectum | AD | regulation of carbohydrate metabolic process | 55/3918 | 178/18723 | 1.10e-03 | 1.01e-02 | 55 |
| GO:0062012 | Colorectum | AD | regulation of small molecule metabolic process | 93/3918 | 334/18723 | 1.46e-03 | 1.24e-02 | 93 |
| GO:0048284 | Colorectum | AD | organelle fusion | 42/3918 | 141/18723 | 8.04e-03 | 4.73e-02 | 42 |
| GO:00060912 | Colorectum | MSS | generation of precursor metabolites and energy | 186/3467 | 490/18723 | 1.14e-24 | 2.15e-21 | 186 |
| GO:00159802 | Colorectum | MSS | energy derivation by oxidation of organic compounds | 131/3467 | 318/18723 | 2.60e-21 | 2.70e-18 | 131 |
| GO:00224112 | Colorectum | MSS | cellular component disassembly | 130/3467 | 443/18723 | 1.44e-08 | 8.46e-07 | 130 |
| GO:00162362 | Colorectum | MSS | macroautophagy | 93/3467 | 291/18723 | 2.08e-08 | 1.17e-06 | 93 |
| GO:00160502 | Colorectum | MSS | vesicle organization | 93/3467 | 300/18723 | 1.04e-07 | 4.97e-06 | 93 |
| GO:00434672 | Colorectum | MSS | regulation of generation of precursor metabolites and energy | 47/3467 | 130/18723 | 1.47e-06 | 4.85e-05 | 47 |
| Page: 1 2 3 4 5 6 7 8 |
| Pathway ID | Tissue | Disease Stage | Description | Gene Ratio | Bg Ratio | pvalue | p.adjust | qvalue | Count |
| hsa0414010 | Esophagus | ESCC | Autophagy - animal | 101/4205 | 141/8465 | 7.60e-08 | 6.21e-07 | 3.18e-07 | 101 |
| hsa0414015 | Esophagus | ESCC | Autophagy - animal | 101/4205 | 141/8465 | 7.60e-08 | 6.21e-07 | 3.18e-07 | 101 |
| hsa0414021 | Liver | HCC | Autophagy - animal | 99/4020 | 141/8465 | 3.08e-08 | 4.70e-07 | 2.61e-07 | 99 |
| hsa0414031 | Liver | HCC | Autophagy - animal | 99/4020 | 141/8465 | 3.08e-08 | 4.70e-07 | 2.61e-07 | 99 |
| hsa041409 | Oral cavity | OSCC | Autophagy - animal | 94/3704 | 141/8465 | 2.73e-08 | 2.38e-07 | 1.21e-07 | 94 |
| hsa0414014 | Oral cavity | OSCC | Autophagy - animal | 94/3704 | 141/8465 | 2.73e-08 | 2.38e-07 | 1.21e-07 | 94 |
| hsa0414041 | Oral cavity | EOLP | Autophagy - animal | 39/1218 | 141/8465 | 2.68e-05 | 1.38e-04 | 8.12e-05 | 39 |
| hsa0414051 | Oral cavity | EOLP | Autophagy - animal | 39/1218 | 141/8465 | 2.68e-05 | 1.38e-04 | 8.12e-05 | 39 |
| hsa0414061 | Oral cavity | NEOLP | Autophagy - animal | 32/1112 | 141/8465 | 1.17e-03 | 5.56e-03 | 3.49e-03 | 32 |
| hsa0414071 | Oral cavity | NEOLP | Autophagy - animal | 32/1112 | 141/8465 | 1.17e-03 | 5.56e-03 | 3.49e-03 | 32 |
| Page: 1 |
Top |
Cell-cell communication analysis |
| Identification of potential cell-cell interactions between two cell types and their ligand-receptor pairs for different disease states |
| Ligand | Receptor | LRpair | Pathway | Tissue | Disease Stage |
| Page: 1 |
Top |
Single-cell gene regulatory network inference analysis |
| Find out the significant the regulons (TFs) and the target genes of each regulon across cell types for different disease states |
| TF | Cell Type | Tissue | Disease Stage | Target Gene | RSS | Regulon Activity |
| ∗The dot plots of a searched regulon are shown for all cell subpopulations in each disease state of each tissue based on the regulon specific score inferred using pySCENIC and by calculating the average expression. |
| Page: 1 |
Top |
Somatic mutation of malignant transformation related genes |
| Annotation of somatic variants for genes involved in malignant transformation |
| Hugo Symbol | Variant Class | Variant Classification | dbSNP RS | HGVSc | HGVSp | HGVSp Short | SWISSPROT | BIOTYPE | SIFT | PolyPhen | Tumor Sample Barcode | Tissue | Histology | Sex | Age | Stage | Therapy Types | Drugs | Outcome |
| RUBCN | SNV | Missense_Mutation | c.1625G>A | p.Arg542Gln | p.R542Q | Q92622 | protein_coding | tolerated(0.06) | probably_damaging(0.997) | TCGA-A8-A08R-01 | Breast | breast invasive carcinoma | Female | <65 | I/II | Unknown | Unknown | SD | |
| RUBCN | SNV | Missense_Mutation | c.1555N>C | p.Glu519Gln | p.E519Q | Q92622 | protein_coding | tolerated(0.18) | benign(0.007) | TCGA-A8-A09N-01 | Breast | breast invasive carcinoma | Female | <65 | III/IV | Unknown | Unknown | SD | |
| RUBCN | SNV | Missense_Mutation | c.2113N>T | p.His705Tyr | p.H705Y | Q92622 | protein_coding | deleterious(0) | probably_damaging(0.996) | TCGA-AC-A23H-01 | Breast | breast invasive carcinoma | Female | >=65 | I/II | Unknown | Unknown | PD | |
| RUBCN | SNV | Missense_Mutation | rs201875862 | c.139N>A | p.Val47Ile | p.V47I | Q92622 | protein_coding | tolerated(0.06) | probably_damaging(0.994) | TCGA-AR-A1AR-01 | Breast | breast invasive carcinoma | Female | <65 | III/IV | Unspecific | Docetaxel | PD |
| RUBCN | SNV | Missense_Mutation | c.1814N>T | p.Ser605Leu | p.S605L | Q92622 | protein_coding | deleterious(0.04) | possibly_damaging(0.585) | TCGA-BH-A0HF-01 | Breast | breast invasive carcinoma | Female | >=65 | I/II | Hormone Therapy | arimidex | SD | |
| RUBCN | SNV | Missense_Mutation | c.2701N>G | p.Ile901Val | p.I901V | Q92622 | protein_coding | deleterious(0.04) | possibly_damaging(0.487) | TCGA-BH-A18V-01 | Breast | breast invasive carcinoma | Female | <65 | I/II | Unknown | Unknown | SD | |
| RUBCN | SNV | Missense_Mutation | c.811N>G | p.Gln271Glu | p.Q271E | Q92622 | protein_coding | tolerated(0.6) | benign(0.003) | TCGA-C8-A132-01 | Breast | breast invasive carcinoma | Female | <65 | I/II | Unknown | Unknown | SD | |
| RUBCN | SNV | Missense_Mutation | c.967N>C | p.Glu323Gln | p.E323Q | Q92622 | protein_coding | deleterious(0) | probably_damaging(0.997) | TCGA-D8-A1J8-01 | Breast | breast invasive carcinoma | Female | >=65 | I/II | Hormone Therapy | nolvadex | SD | |
| RUBCN | SNV | Missense_Mutation | c.781A>G | p.Ser261Gly | p.S261G | Q92622 | protein_coding | tolerated(0.21) | benign(0) | TCGA-D8-A1X5-01 | Breast | breast invasive carcinoma | Female | >=65 | III/IV | Hormone Therapy | tamoxiphen | SD | |
| RUBCN | SNV | Missense_Mutation | c.2689N>A | p.Glu897Lys | p.E897K | Q92622 | protein_coding | tolerated(0.43) | probably_damaging(0.912) | TCGA-D8-A1XJ-01 | Breast | breast invasive carcinoma | Female | >=65 | III/IV | Hormone Therapy | tamoxiphen | SD |
| Page: 1 2 3 4 5 6 7 8 9 10 11 12 |
Top |
Related drugs of malignant transformation related genes |
| Identification of chemicals and drugs interact with genes involved in malignant transfromation |
| (DGIdb 4.0) |
| Entrez ID | Symbol | Category | Interaction Types | Drug Claim Name | Drug Name | PMIDs |
| Page: 1 |

Copyright 2023-Present -The University of Texas Health Science Center at Houston |