
|
|||||
|
 | |
| |
| |
| |
| |
| |
|
Gene: RTTN |
Gene summary for RTTN |
| Gene information | Species | Human | Gene symbol | RTTN | Gene ID | 25914 |
| Gene name | rotatin | |
| Gene Alias | MSSP | |
| Cytomap | 18q22.2 | |
| Gene Type | protein-coding | GO ID | GO:0000226 | UniProtAcc | Q86VV8 |
Top |
Malignant transformation analysis |
| Identification of the aberrant gene expression in precancerous and cancerous lesions by comparing the gene expression of stem-like cells in diseased tissues with normal stem cells |
| Entrez ID | Symbol | Replicates | Species | Organ | Tissue | Adj P-value | Log2FC | Malignancy |
| 25914 | RTTN | CCI_1 | Human | Cervix | CC | 3.40e-10 | 9.29e-01 | 0.528 |
| 25914 | RTTN | CCI_2 | Human | Cervix | CC | 9.81e-03 | 3.75e-01 | 0.5249 |
| 25914 | RTTN | CCI_3 | Human | Cervix | CC | 1.42e-09 | 7.58e-01 | 0.516 |
| 25914 | RTTN | LZE7T | Human | Esophagus | ESCC | 3.90e-02 | 1.70e-01 | 0.0667 |
| 25914 | RTTN | LZE24T | Human | Esophagus | ESCC | 4.15e-02 | 8.52e-02 | 0.0596 |
| 25914 | RTTN | P2T-E | Human | Esophagus | ESCC | 1.71e-03 | 1.62e-01 | 0.1177 |
| 25914 | RTTN | P8T-E | Human | Esophagus | ESCC | 1.85e-07 | 9.51e-02 | 0.0889 |
| 25914 | RTTN | P10T-E | Human | Esophagus | ESCC | 1.75e-02 | 7.38e-02 | 0.116 |
| 25914 | RTTN | P11T-E | Human | Esophagus | ESCC | 1.20e-09 | 3.43e-01 | 0.1426 |
| 25914 | RTTN | P12T-E | Human | Esophagus | ESCC | 2.96e-03 | 1.11e-01 | 0.1122 |
| 25914 | RTTN | P17T-E | Human | Esophagus | ESCC | 1.49e-02 | 1.51e-01 | 0.1278 |
| 25914 | RTTN | P19T-E | Human | Esophagus | ESCC | 4.64e-06 | 3.39e-01 | 0.1662 |
| 25914 | RTTN | P23T-E | Human | Esophagus | ESCC | 3.36e-03 | 1.05e-01 | 0.108 |
| 25914 | RTTN | P27T-E | Human | Esophagus | ESCC | 7.08e-03 | 6.72e-02 | 0.1055 |
| 25914 | RTTN | P32T-E | Human | Esophagus | ESCC | 6.02e-15 | 4.95e-01 | 0.1666 |
| 25914 | RTTN | P36T-E | Human | Esophagus | ESCC | 2.11e-03 | 1.52e-01 | 0.1187 |
| 25914 | RTTN | P37T-E | Human | Esophagus | ESCC | 3.60e-30 | 6.03e-01 | 0.1371 |
| 25914 | RTTN | P39T-E | Human | Esophagus | ESCC | 3.34e-07 | 1.21e-01 | 0.0894 |
| 25914 | RTTN | P52T-E | Human | Esophagus | ESCC | 1.62e-03 | 1.01e-01 | 0.1555 |
| 25914 | RTTN | P54T-E | Human | Esophagus | ESCC | 4.58e-05 | 1.44e-01 | 0.0975 |
| Page: 1 2 |
| Tissue | Expression Dynamics | Abbreviation |
| Cervix | 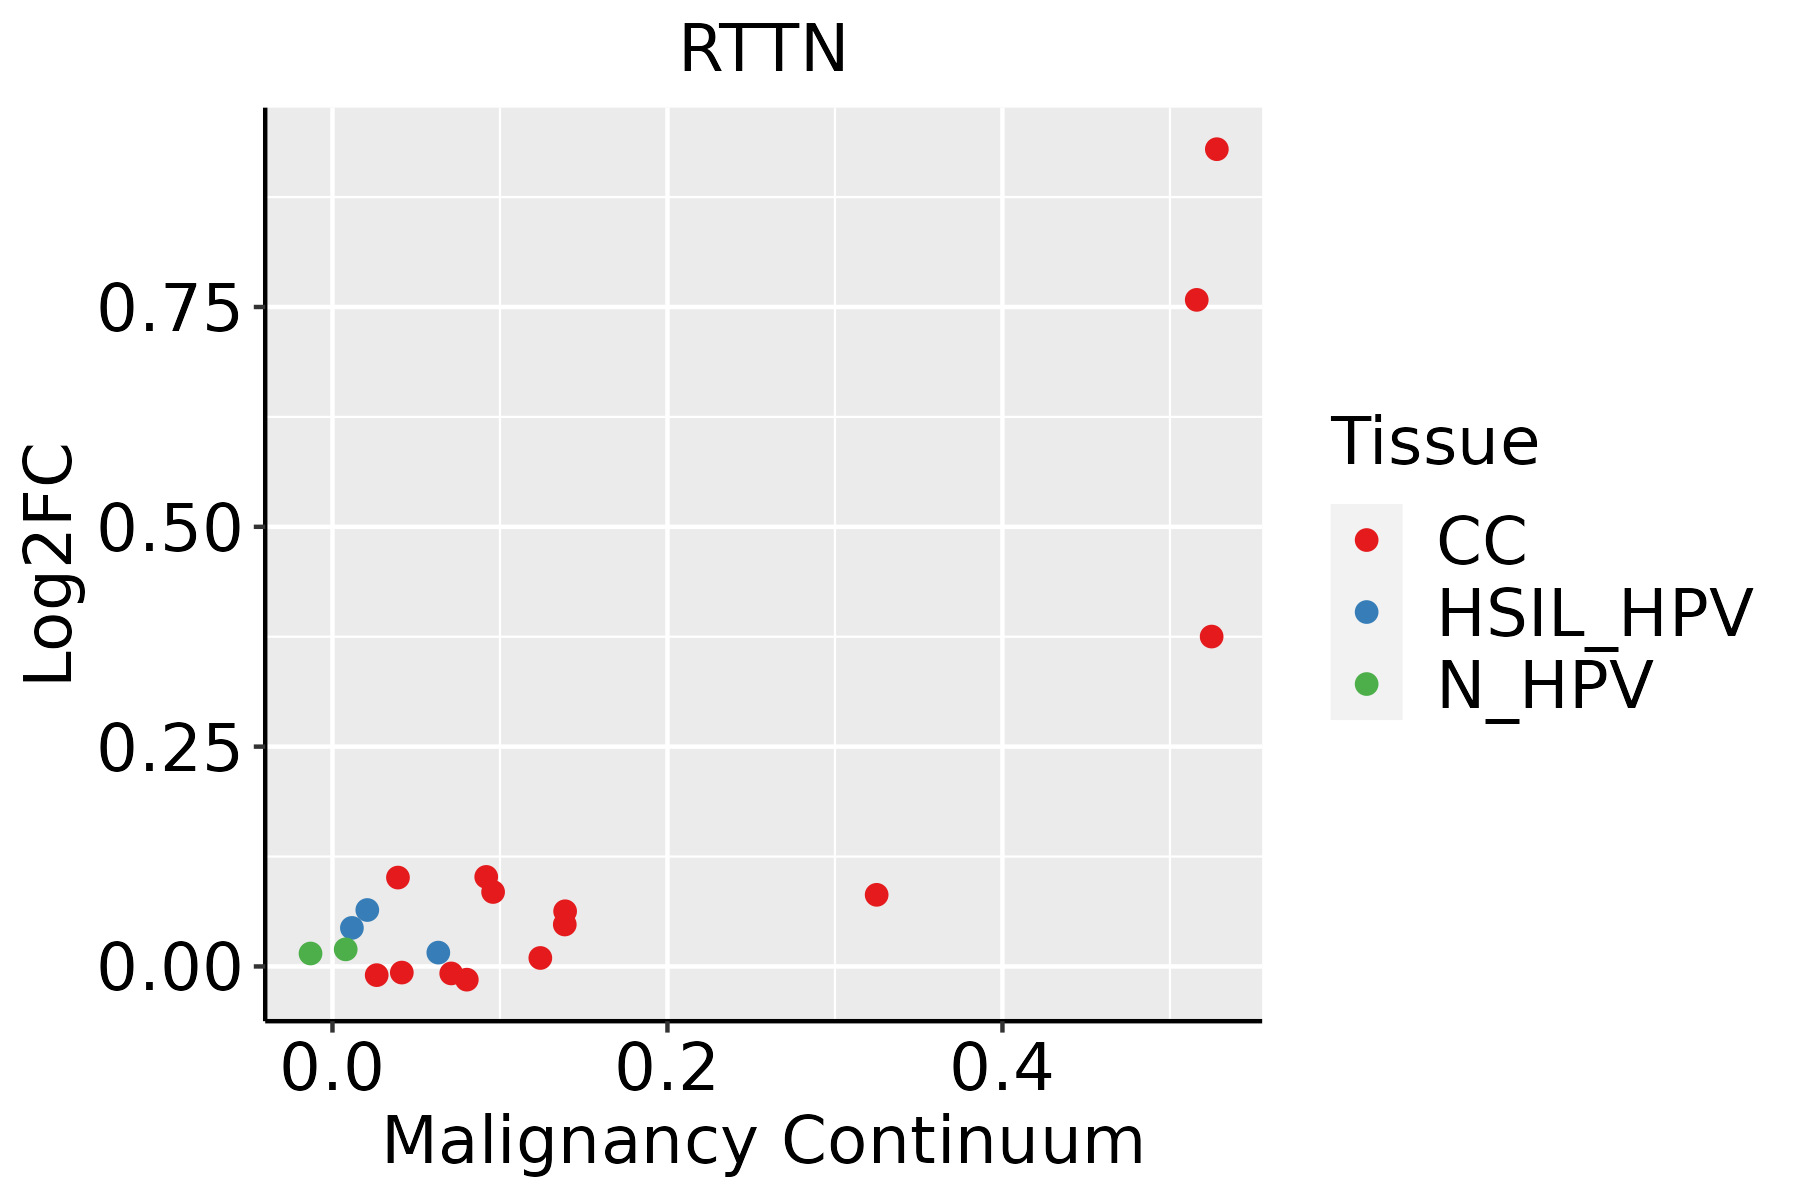 | CC: Cervix cancer |
| HSIL_HPV: HPV-infected high-grade squamous intraepithelial lesions | ||
| N_HPV: HPV-infected normal cervix | ||
| Esophagus |  | ESCC: Esophageal squamous cell carcinoma |
| HGIN: High-grade intraepithelial neoplasias | ||
| LGIN: Low-grade intraepithelial neoplasias | ||
| Oral Cavity | 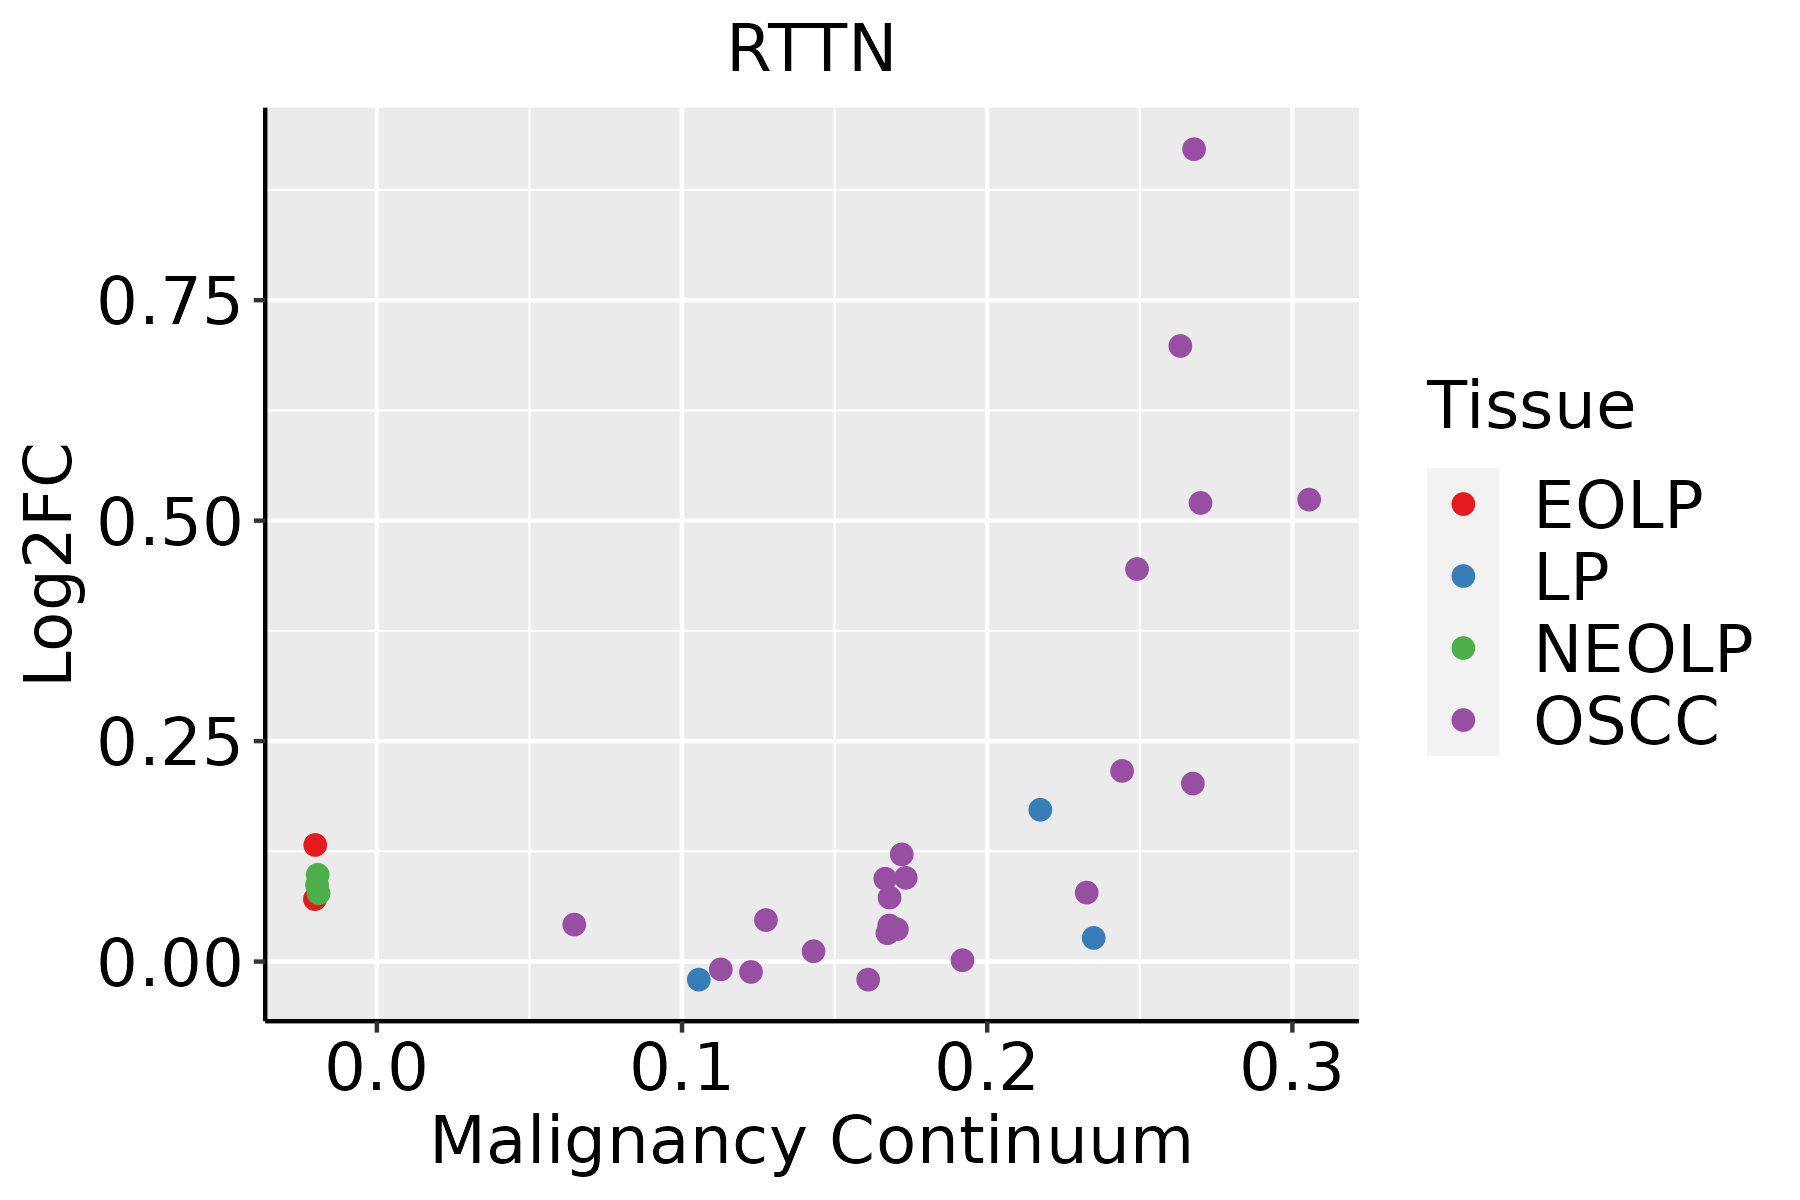 | EOLP: Erosive Oral lichen planus |
| LP: leukoplakia | ||
| NEOLP: Non-erosive oral lichen planus | ||
| OSCC: Oral squamous cell carcinoma | ||
| Skin | 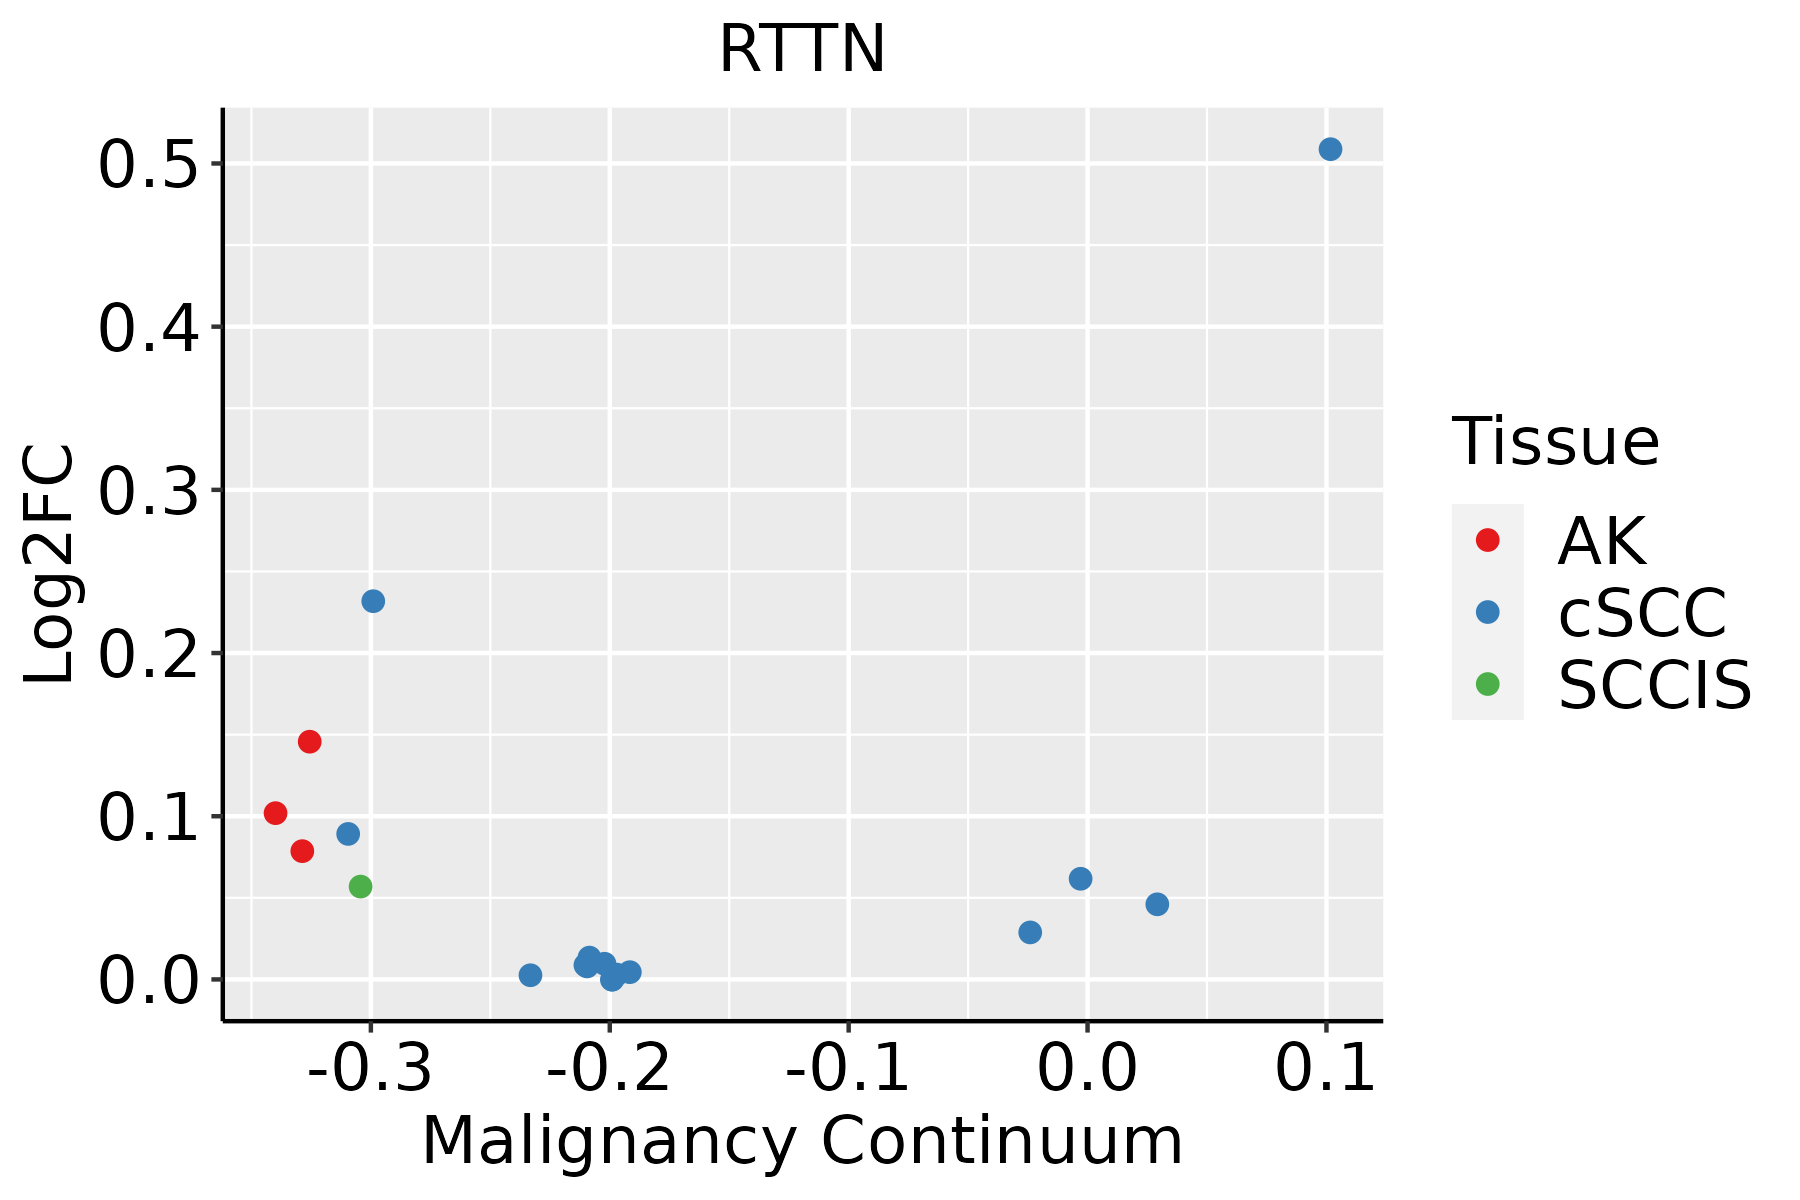 | AK: Actinic keratosis |
| cSCC: Cutaneous squamous cell carcinoma | ||
| SCCIS:squamous cell carcinoma in situ |
| ∗log2FC in expression of this searched gene in stem-like cells from each diseased tissue sample relative to stem-like cells in normal samples in each tissue plotted against the malignancy continuum. Samples are colored based on if they are from different disease stage. |
Top |
Malignant transformation related pathway analysis |
| Find out the enriched GO biological processes and KEGG pathways involved in transition from healthy to precancer to cancer |
| Tissue | Disease Stage | Enriched GO biological Processes |
| Colorectum | AD |  |
| Colorectum | SER |  |
| Colorectum | MSS |  |
| Colorectum | MSI-H |  |
| Colorectum | FAP |  |
| ∗Top 15 enriched GO BP terms are showed in the bar plot of each disease state in each tissue. Each row represents a significant GO biological process which is colored according to the -log10(p.adjust). |
| Page: 1 2 3 4 5 6 7 8 9 |
| GO ID | Tissue | Disease Stage | Description | Gene Ratio | Bg Ratio | pvalue | p.adjust | Count |
| GO:00070982 | Esophagus | ESCC | centrosome cycle | 85/8552 | 130/18723 | 4.41e-06 | 4.69e-05 | 85 |
| GO:00310233 | Esophagus | ESCC | microtubule organizing center organization | 92/8552 | 143/18723 | 5.04e-06 | 5.31e-05 | 92 |
| GO:0010457 | Esophagus | ESCC | centriole-centriole cohesion | 12/8552 | 14/18723 | 2.51e-03 | 1.08e-02 | 12 |
| GO:00070981 | Oral cavity | OSCC | centrosome cycle | 66/7305 | 130/18723 | 4.17e-03 | 1.70e-02 | 66 |
| GO:00310232 | Oral cavity | OSCC | microtubule organizing center organization | 70/7305 | 143/18723 | 9.71e-03 | 3.44e-02 | 70 |
| GO:00310234 | Skin | cSCC | microtubule organizing center organization | 58/4864 | 143/18723 | 9.47e-05 | 8.83e-04 | 58 |
| GO:00070983 | Skin | cSCC | centrosome cycle | 53/4864 | 130/18723 | 1.59e-04 | 1.39e-03 | 53 |
| Page: 1 |
| Pathway ID | Tissue | Disease Stage | Description | Gene Ratio | Bg Ratio | pvalue | p.adjust | qvalue | Count |
| Page: 1 |
Top |
Cell-cell communication analysis |
| Identification of potential cell-cell interactions between two cell types and their ligand-receptor pairs for different disease states |
| Ligand | Receptor | LRpair | Pathway | Tissue | Disease Stage |
| Page: 1 |
Top |
Single-cell gene regulatory network inference analysis |
| Find out the significant the regulons (TFs) and the target genes of each regulon across cell types for different disease states |
| TF | Cell Type | Tissue | Disease Stage | Target Gene | RSS | Regulon Activity |
| ∗The dot plots of a searched regulon are shown for all cell subpopulations in each disease state of each tissue based on the regulon specific score inferred using pySCENIC and by calculating the average expression. |
| Page: 1 |
Top |
Somatic mutation of malignant transformation related genes |
| Annotation of somatic variants for genes involved in malignant transformation |
| Hugo Symbol | Variant Class | Variant Classification | dbSNP RS | HGVSc | HGVSp | HGVSp Short | SWISSPROT | BIOTYPE | SIFT | PolyPhen | Tumor Sample Barcode | Tissue | Histology | Sex | Age | Stage | Therapy Types | Drugs | Outcome |
| RTTN | SNV | Missense_Mutation | c.5054N>C | p.Leu1685Pro | p.L1685P | protein_coding | deleterious(0) | probably_damaging(0.976) | TCGA-A2-A04R-01 | Breast | breast invasive carcinoma | Female | <65 | I/II | Chemotherapy | taxol | SD | ||
| RTTN | SNV | Missense_Mutation | novel | c.1515N>C | p.Leu505Phe | p.L505F | protein_coding | deleterious(0) | probably_damaging(0.982) | TCGA-AN-A046-01 | Breast | breast invasive carcinoma | Female | >=65 | I/II | Unknown | Unknown | SD | |
| RTTN | SNV | Missense_Mutation | c.5611N>T | p.Ala1871Ser | p.A1871S | protein_coding | deleterious(0.01) | possibly_damaging(0.684) | TCGA-BH-A0HA-01 | Breast | breast invasive carcinoma | Female | <65 | I/II | Unknown | Unknown | SD | ||
| RTTN | SNV | Missense_Mutation | c.6367A>T | p.Ile2123Phe | p.I2123F | protein_coding | deleterious(0) | probably_damaging(0.974) | TCGA-D8-A1JH-01 | Breast | breast invasive carcinoma | Female | <65 | I/II | Hormone Therapy | nolvadex | SD | ||
| RTTN | SNV | Missense_Mutation | c.1873C>A | p.His625Asn | p.H625N | protein_coding | deleterious(0) | probably_damaging(0.942) | TCGA-E2-A10C-01 | Breast | breast invasive carcinoma | Female | <65 | I/II | Chemotherapy | cytoxan | SD | ||
| RTTN | SNV | Missense_Mutation | c.4105N>T | p.Ala1369Ser | p.A1369S | protein_coding | tolerated(0.09) | possibly_damaging(0.542) | TCGA-E9-A1R2-01 | Breast | breast invasive carcinoma | Female | <65 | III/IV | Chemotherapy | taxotere | CR | ||
| RTTN | SNV | Missense_Mutation | c.4104N>T | p.Leu1368Phe | p.L1368F | protein_coding | deleterious(0) | probably_damaging(0.999) | TCGA-E9-A1R2-01 | Breast | breast invasive carcinoma | Female | <65 | III/IV | Chemotherapy | taxotere | CR | ||
| RTTN | SNV | Missense_Mutation | c.6239N>G | p.Lys2080Arg | p.K2080R | protein_coding | tolerated(0.16) | benign(0.085) | TCGA-E9-A247-01 | Breast | breast invasive carcinoma | Female | <65 | I/II | Hormone Therapy | tamoxiphen | SD | ||
| RTTN | insertion | In_Frame_Ins | novel | c.3160_3161insCAGGAAAGACTCTCAAACTGTGGGTCAGTG | p.Lys1054delinsThrGlyLysThrLeuLysLeuTrpValSerGlu | p.K1054delinsTGKTLKLWVSE | protein_coding | TCGA-A8-A08H-01 | Breast | breast invasive carcinoma | Female | >=65 | I/II | Unknown | Unknown | SD | |||
| RTTN | deletion | Frame_Shift_Del | novel | c.4029delN | p.Leu1344TrpfsTer28 | p.L1344Wfs*28 | protein_coding | TCGA-EW-A2FV-01 | Breast | breast invasive carcinoma | Female | <65 | III/IV | Chemotherapy | docetaxel | SD |
| Page: 1 2 3 4 5 6 7 8 9 10 11 12 13 14 15 16 17 18 19 20 21 22 23 24 |
Top |
Related drugs of malignant transformation related genes |
| Identification of chemicals and drugs interact with genes involved in malignant transfromation |
| (DGIdb 4.0) |
| Entrez ID | Symbol | Category | Interaction Types | Drug Claim Name | Drug Name | PMIDs |
| Page: 1 |

Copyright 2023-Present -The University of Texas Health Science Center at Houston |