
|
|||||
|
 | |
| |
| |
| |
| |
| |
|
Gene: RTRAF |
Gene summary for RTRAF |
| Gene information | Species | Human | Gene symbol | RTRAF | Gene ID | 51637 |
| Gene name | RNA transcription, translation and transport factor | |
| Gene Alias | C14orf166 | |
| Cytomap | 14q22.1 | |
| Gene Type | protein-coding | GO ID | GO:0000394 | UniProtAcc | Q549M8 |
Top |
Malignant transformation analysis |
| Identification of the aberrant gene expression in precancerous and cancerous lesions by comparing the gene expression of stem-like cells in diseased tissues with normal stem cells |
| Entrez ID | Symbol | Replicates | Species | Organ | Tissue | Adj P-value | Log2FC | Malignancy |
| 51637 | RTRAF | GSM4909281 | Human | Breast | IDC | 5.53e-03 | 3.06e-01 | 0.21 |
| 51637 | RTRAF | GSM4909282 | Human | Breast | IDC | 1.75e-19 | 6.14e-01 | -0.0288 |
| 51637 | RTRAF | GSM4909285 | Human | Breast | IDC | 7.28e-35 | 6.89e-01 | 0.21 |
| 51637 | RTRAF | GSM4909286 | Human | Breast | IDC | 7.48e-09 | 1.70e-01 | 0.1081 |
| 51637 | RTRAF | GSM4909287 | Human | Breast | IDC | 2.69e-07 | 3.38e-01 | 0.2057 |
| 51637 | RTRAF | GSM4909290 | Human | Breast | IDC | 1.31e-06 | 3.14e-01 | 0.2096 |
| 51637 | RTRAF | GSM4909293 | Human | Breast | IDC | 3.71e-11 | 2.77e-01 | 0.1581 |
| 51637 | RTRAF | GSM4909294 | Human | Breast | IDC | 5.56e-05 | 3.19e-01 | 0.2022 |
| 51637 | RTRAF | GSM4909296 | Human | Breast | IDC | 5.83e-03 | 1.90e-01 | 0.1524 |
| 51637 | RTRAF | GSM4909297 | Human | Breast | IDC | 1.49e-03 | 9.25e-02 | 0.1517 |
| 51637 | RTRAF | GSM4909298 | Human | Breast | IDC | 6.12e-03 | 2.21e-01 | 0.1551 |
| 51637 | RTRAF | GSM4909299 | Human | Breast | IDC | 3.79e-02 | 2.59e-01 | 0.035 |
| 51637 | RTRAF | GSM4909304 | Human | Breast | IDC | 6.11e-06 | 3.16e-01 | 0.1636 |
| 51637 | RTRAF | GSM4909305 | Human | Breast | IDC | 1.16e-14 | 3.46e-01 | 0.0436 |
| 51637 | RTRAF | GSM4909306 | Human | Breast | IDC | 7.14e-05 | 2.98e-01 | 0.1564 |
| 51637 | RTRAF | GSM4909308 | Human | Breast | IDC | 1.23e-23 | 5.16e-01 | 0.158 |
| 51637 | RTRAF | GSM4909311 | Human | Breast | IDC | 1.78e-16 | -2.47e-01 | 0.1534 |
| 51637 | RTRAF | GSM4909312 | Human | Breast | IDC | 5.51e-03 | 3.68e-04 | 0.1552 |
| 51637 | RTRAF | GSM4909315 | Human | Breast | IDC | 4.91e-09 | 5.16e-01 | 0.21 |
| 51637 | RTRAF | GSM4909316 | Human | Breast | IDC | 2.38e-08 | 6.08e-01 | 0.21 |
| Page: 1 2 3 4 5 6 7 8 9 |
| Tissue | Expression Dynamics | Abbreviation |
| Breast | 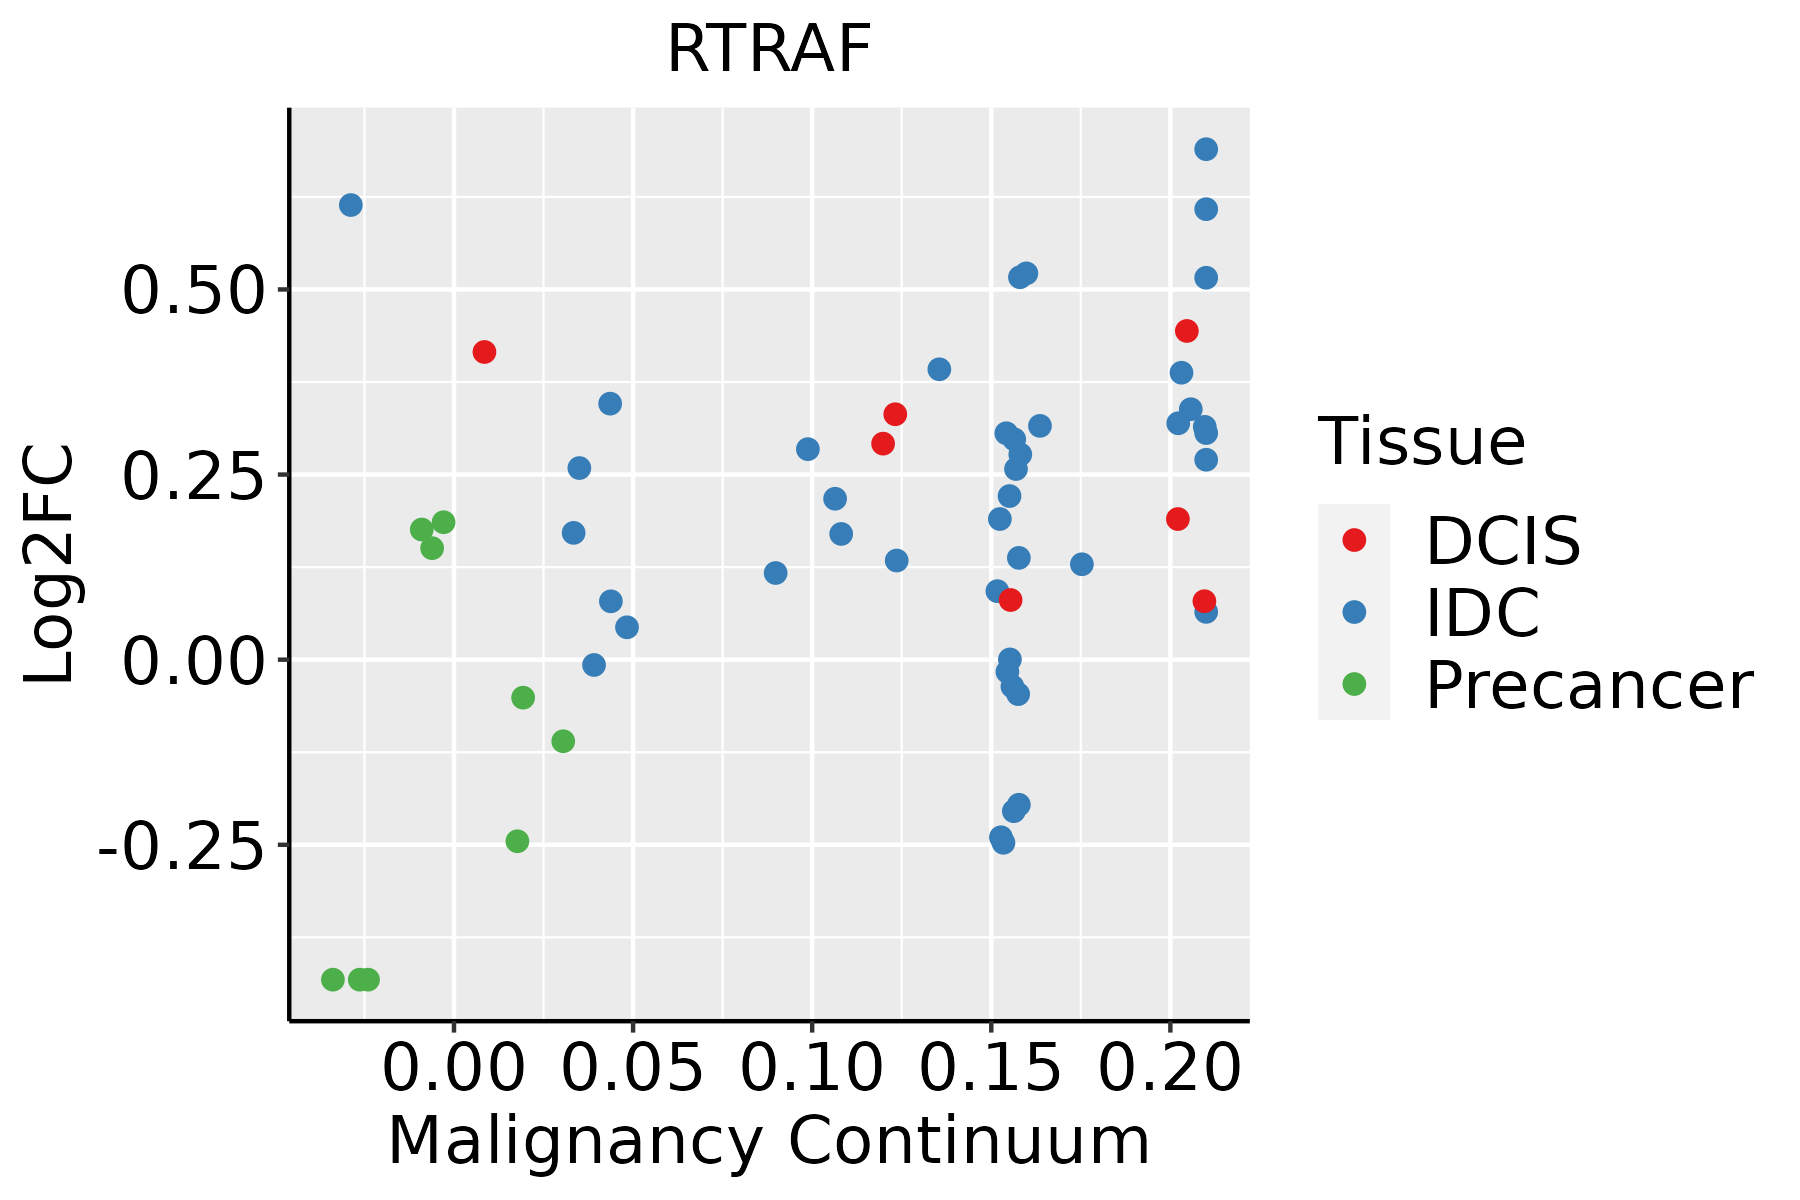 | IDC: Invasive ductal carcinoma |
| DCIS: Ductal carcinoma in situ | ||
| Precancer(BRCA1-mut): Precancerous lesion from BRCA1 mutation carriers | ||
| Cervix | 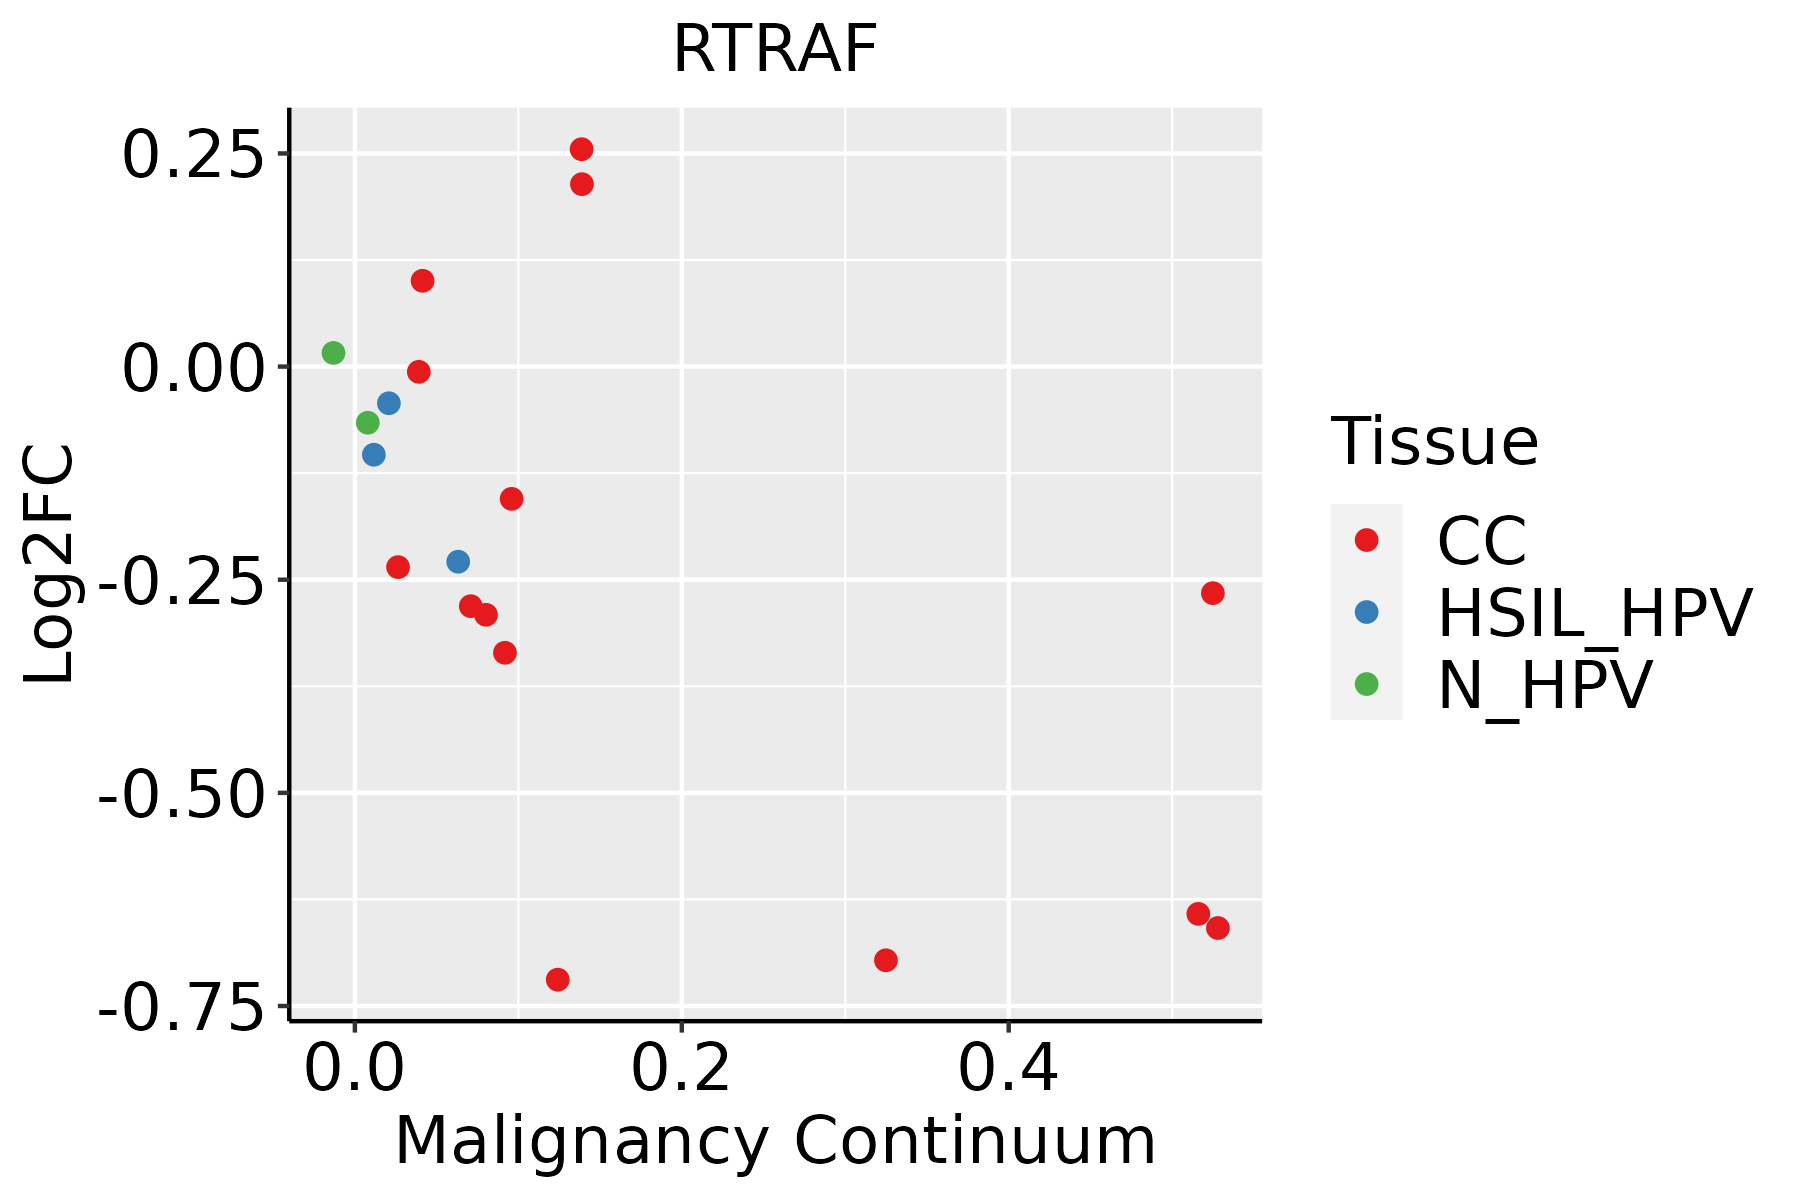 | CC: Cervix cancer |
| HSIL_HPV: HPV-infected high-grade squamous intraepithelial lesions | ||
| N_HPV: HPV-infected normal cervix | ||
| Colorectum (GSE201348) | 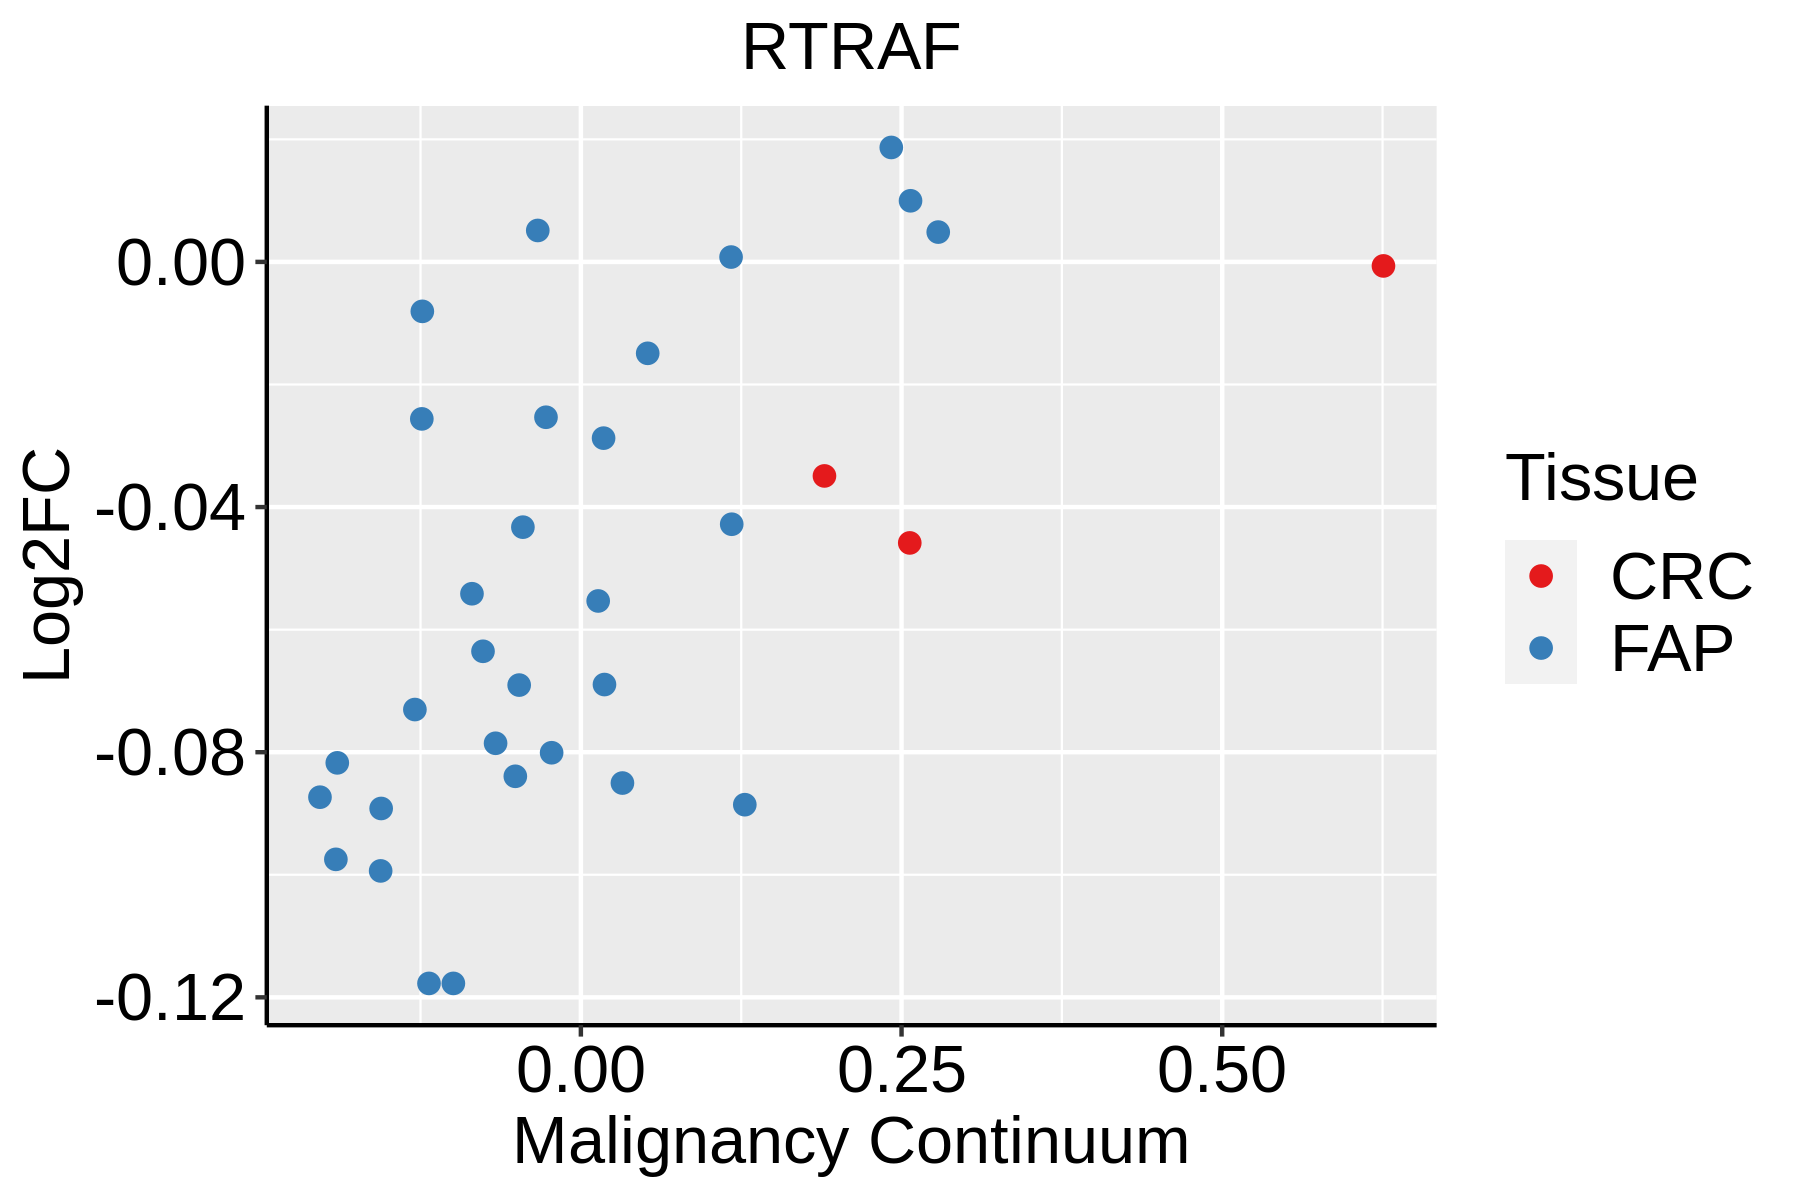 | FAP: Familial adenomatous polyposis |
| CRC: Colorectal cancer | ||
| Colorectum (HTA11) |  | AD: Adenomas |
| SER: Sessile serrated lesions | ||
| MSI-H: Microsatellite-high colorectal cancer | ||
| MSS: Microsatellite stable colorectal cancer | ||
| Endometrium | 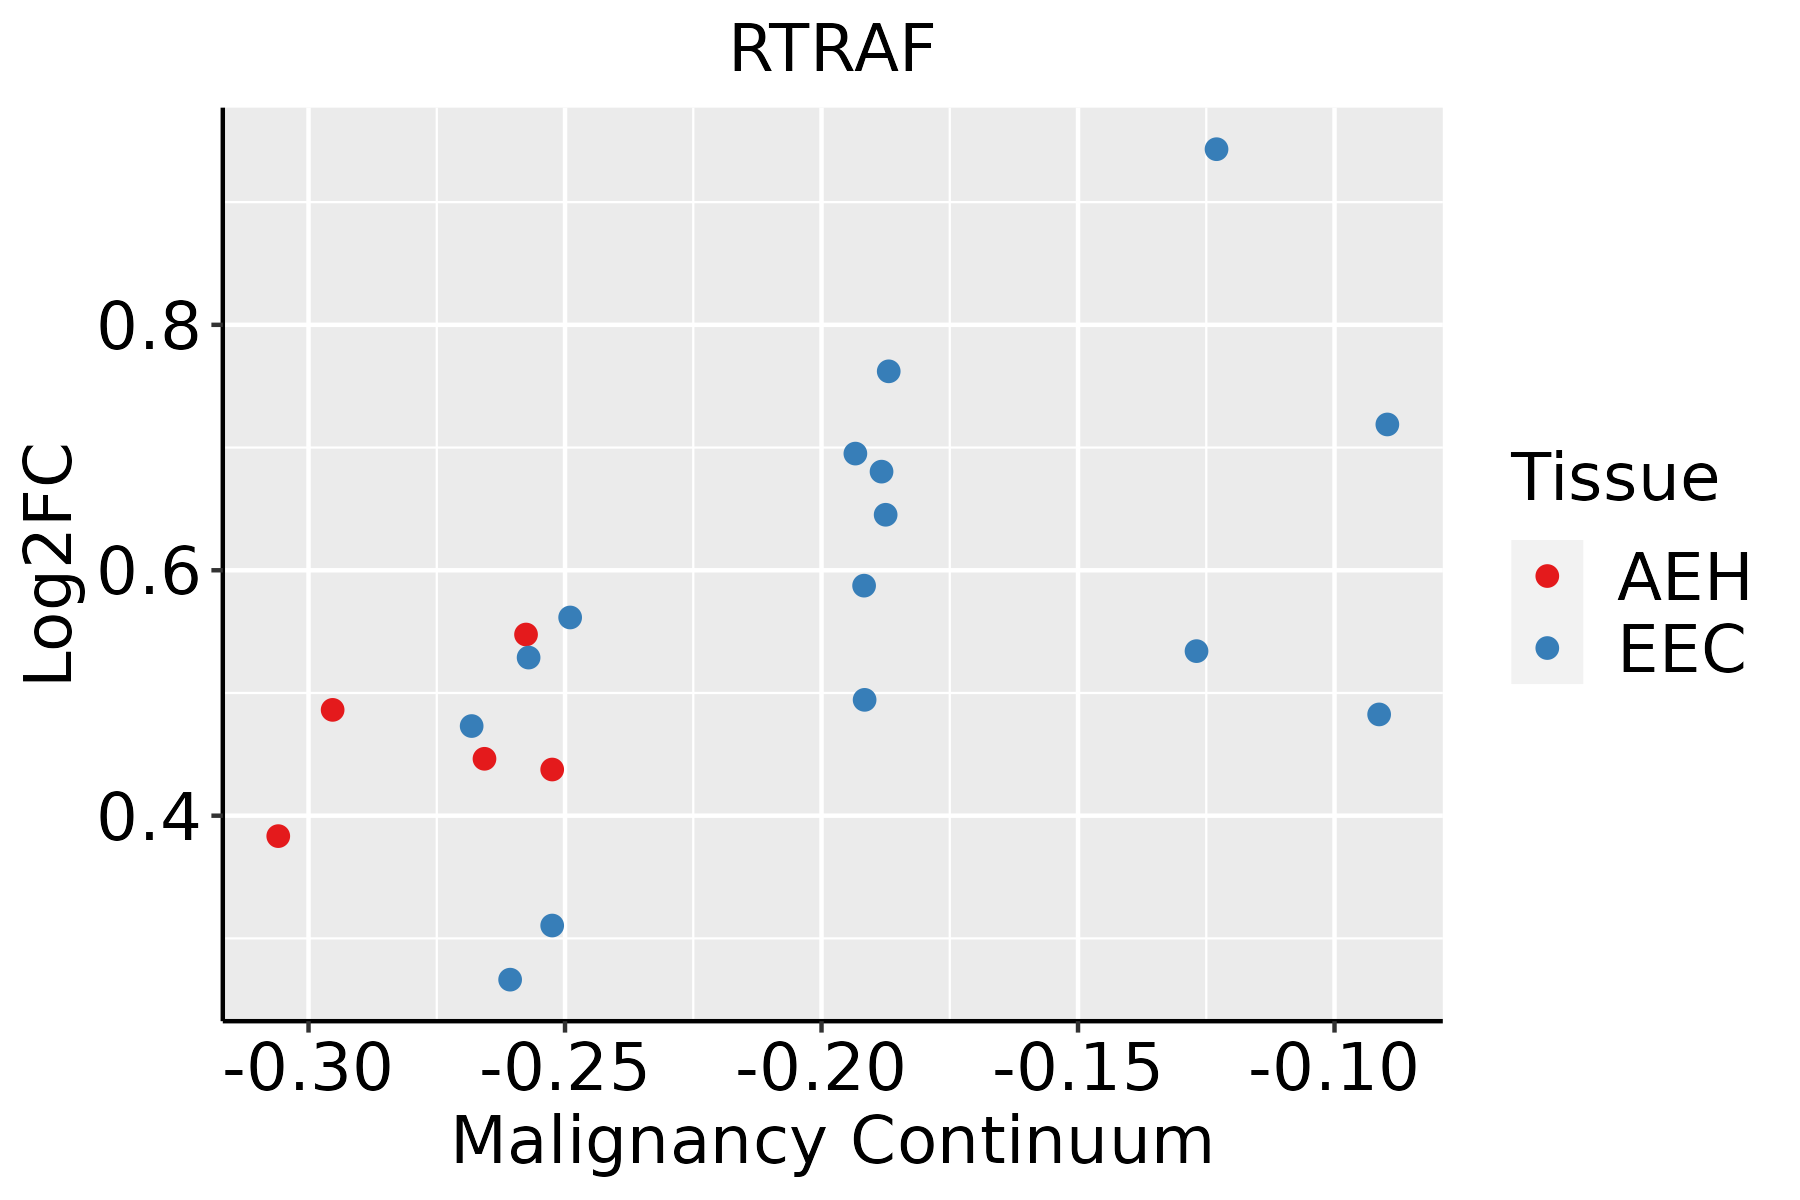 | AEH: Atypical endometrial hyperplasia |
| EEC: Endometrioid Cancer | ||
| Esophagus | 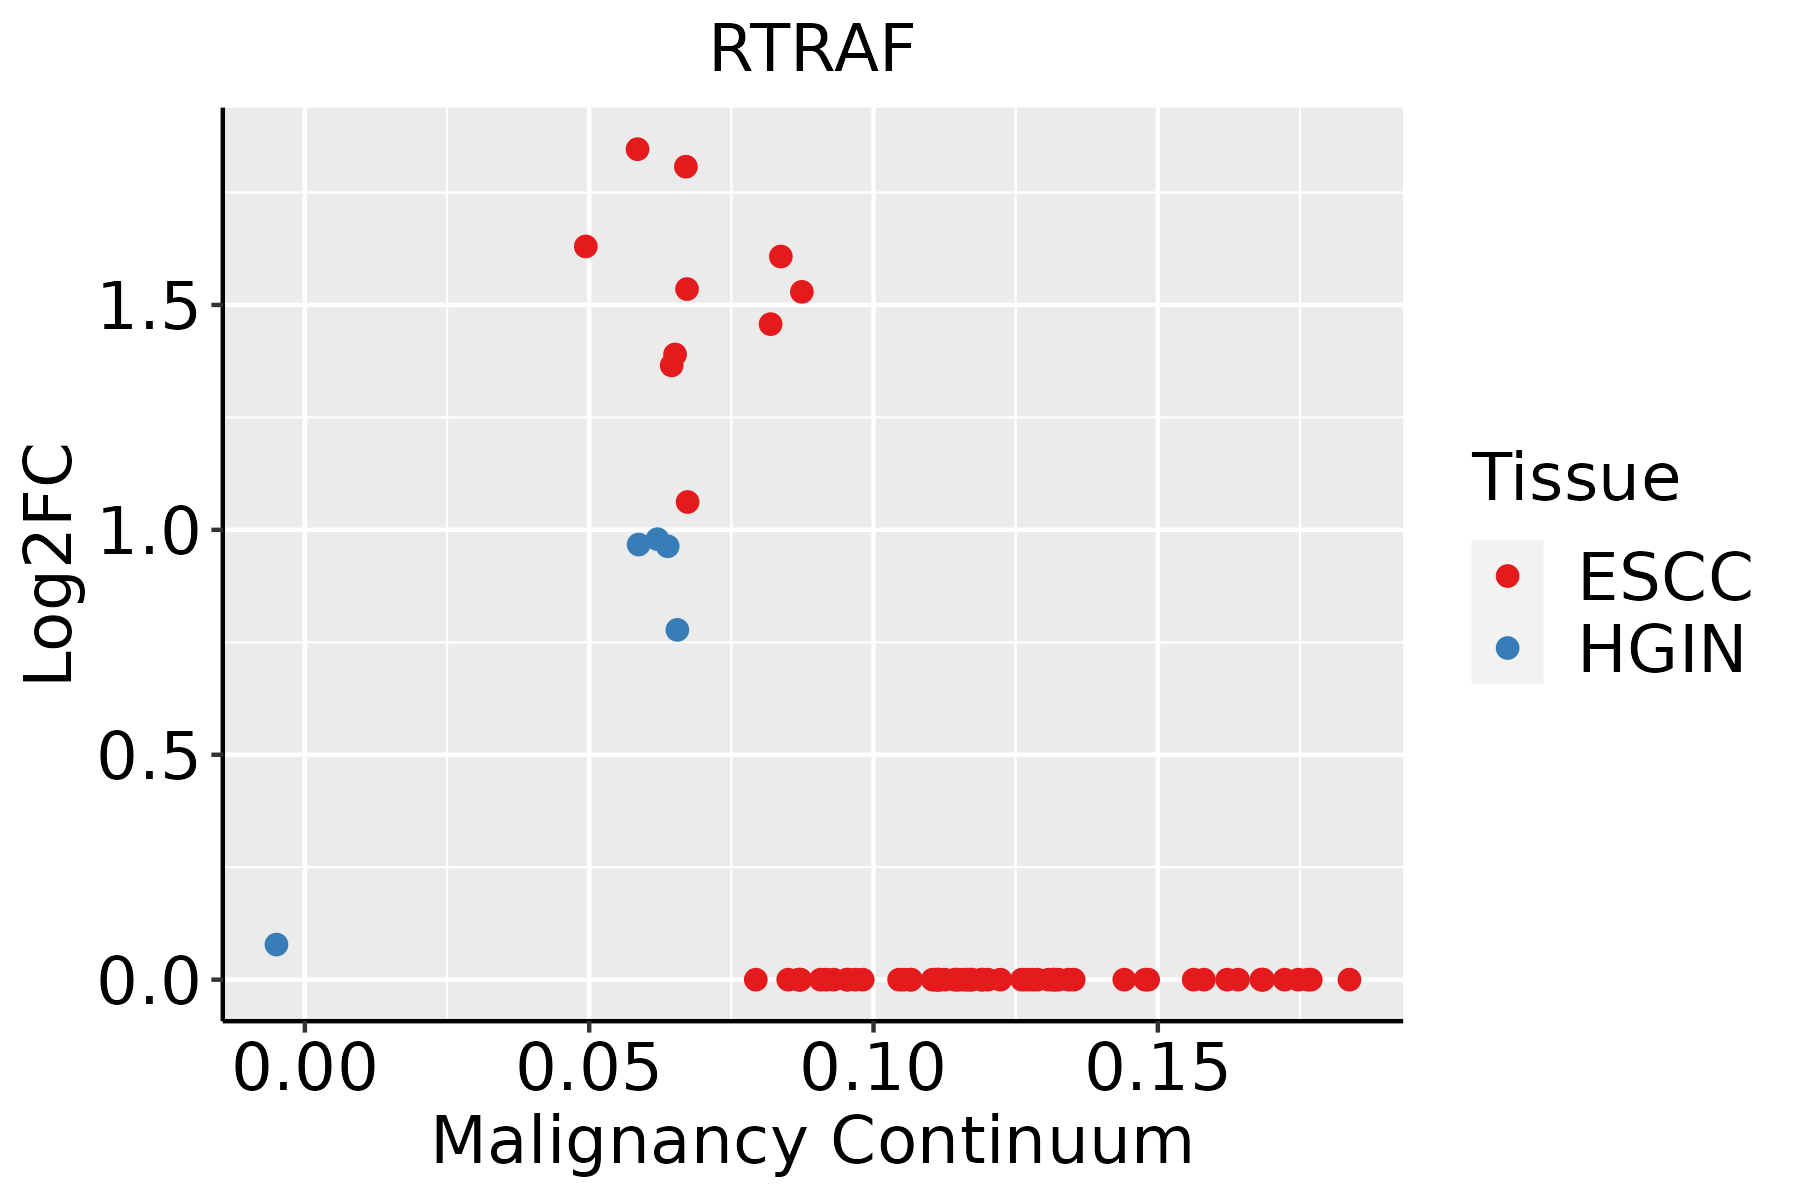 | ESCC: Esophageal squamous cell carcinoma |
| HGIN: High-grade intraepithelial neoplasias | ||
| LGIN: Low-grade intraepithelial neoplasias | ||
| GC | 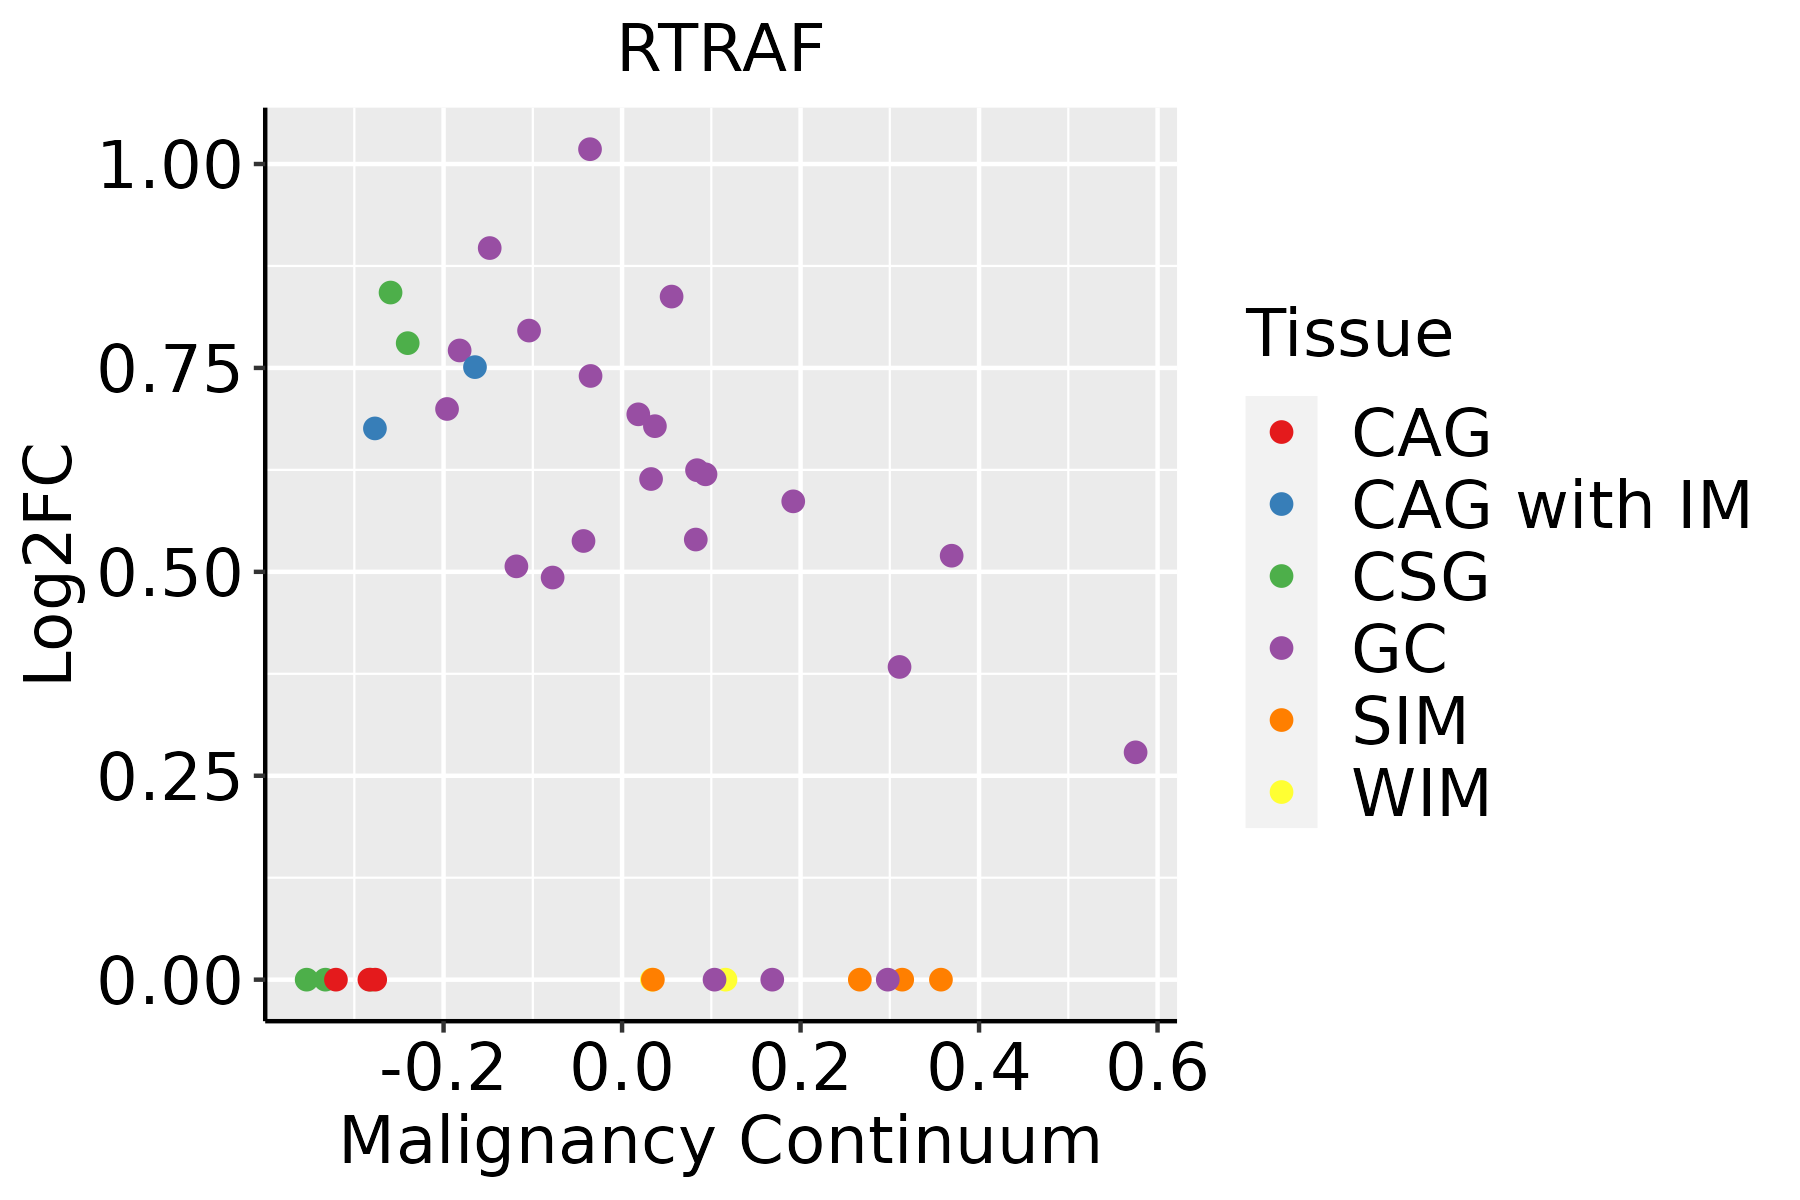 | CAG: Chronic atrophic gastritis |
| CAG with IM: Chronic atrophic gastritis with intestinal metaplasia | ||
| CSG: Chronic superficial gastritis | ||
| GC: Gastric cancer | ||
| SIM: Severe intestinal metaplasia | ||
| WIM: Wild intestinal metaplasia | ||
| Liver | 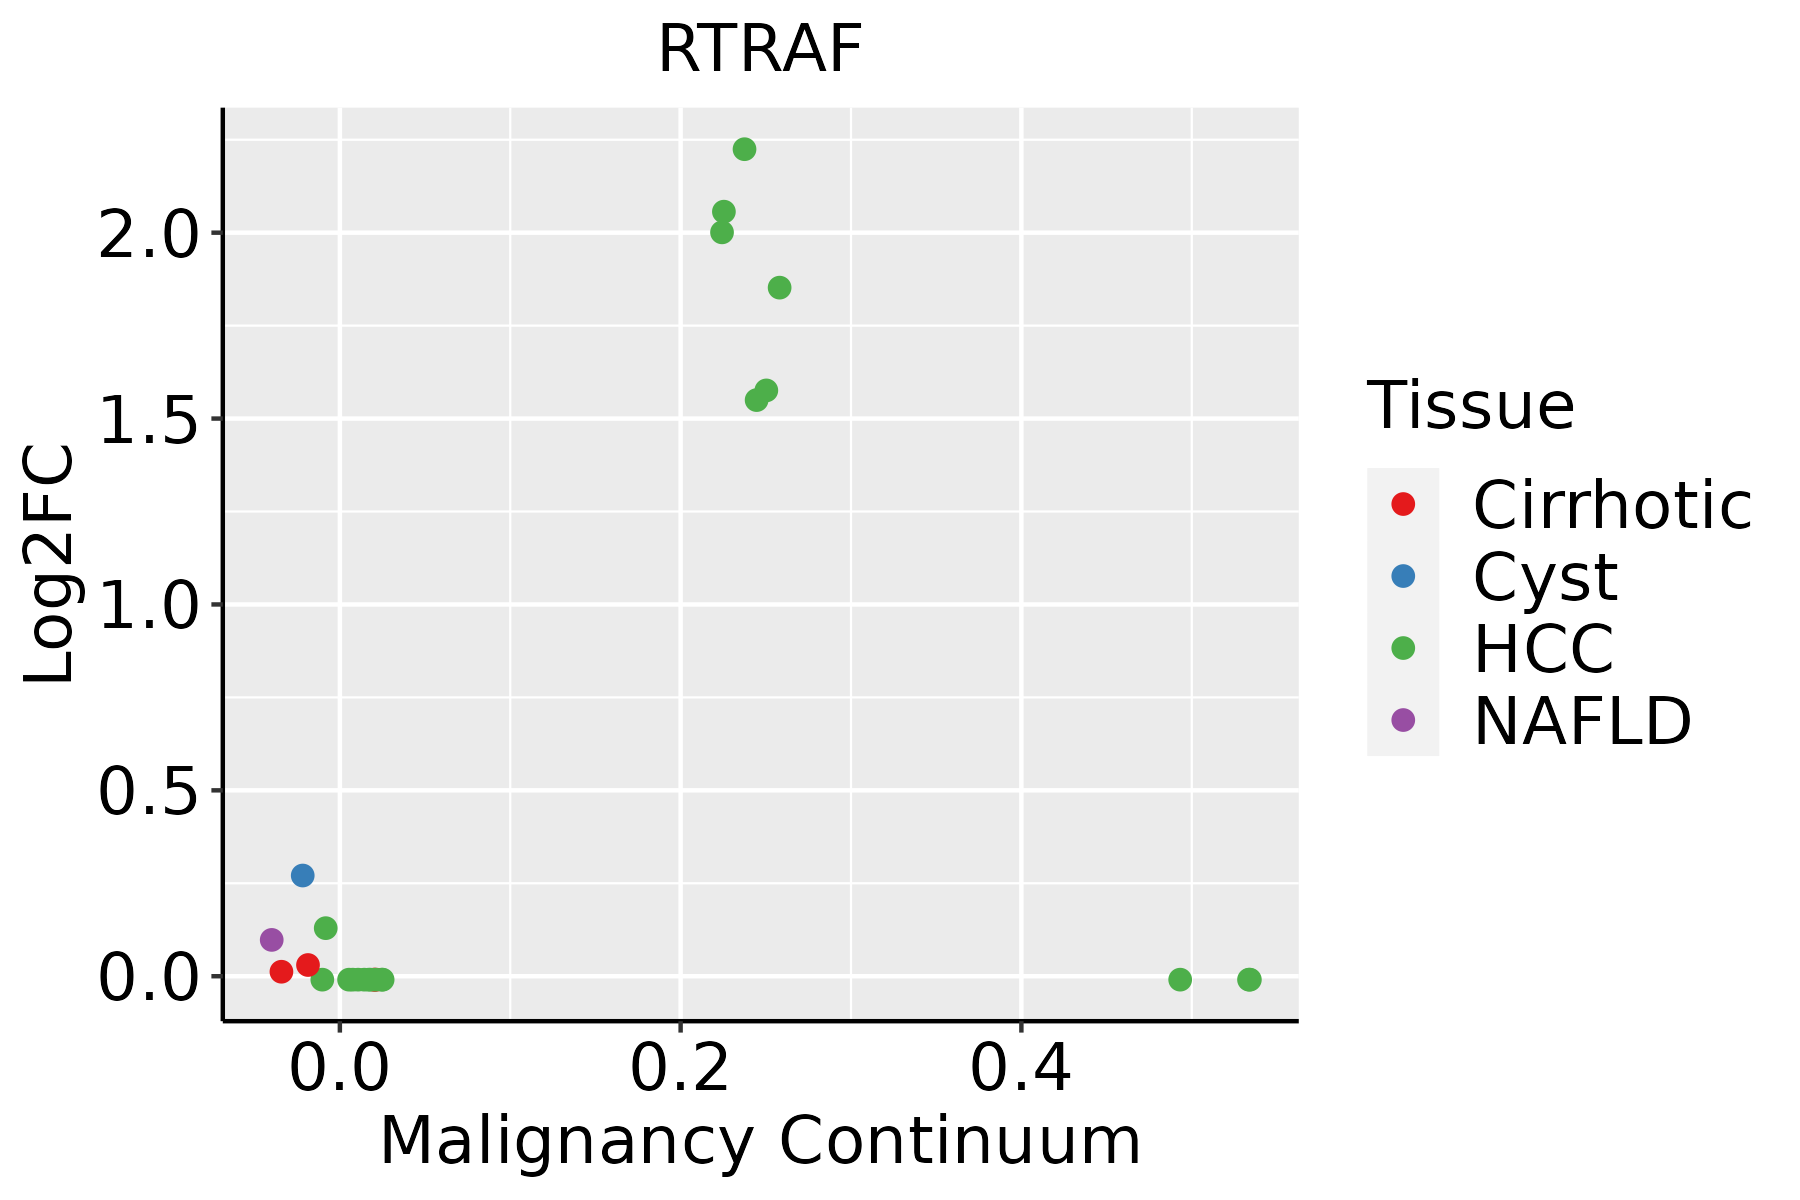 | HCC: Hepatocellular carcinoma |
| NAFLD: Non-alcoholic fatty liver disease | ||
| Prostate | 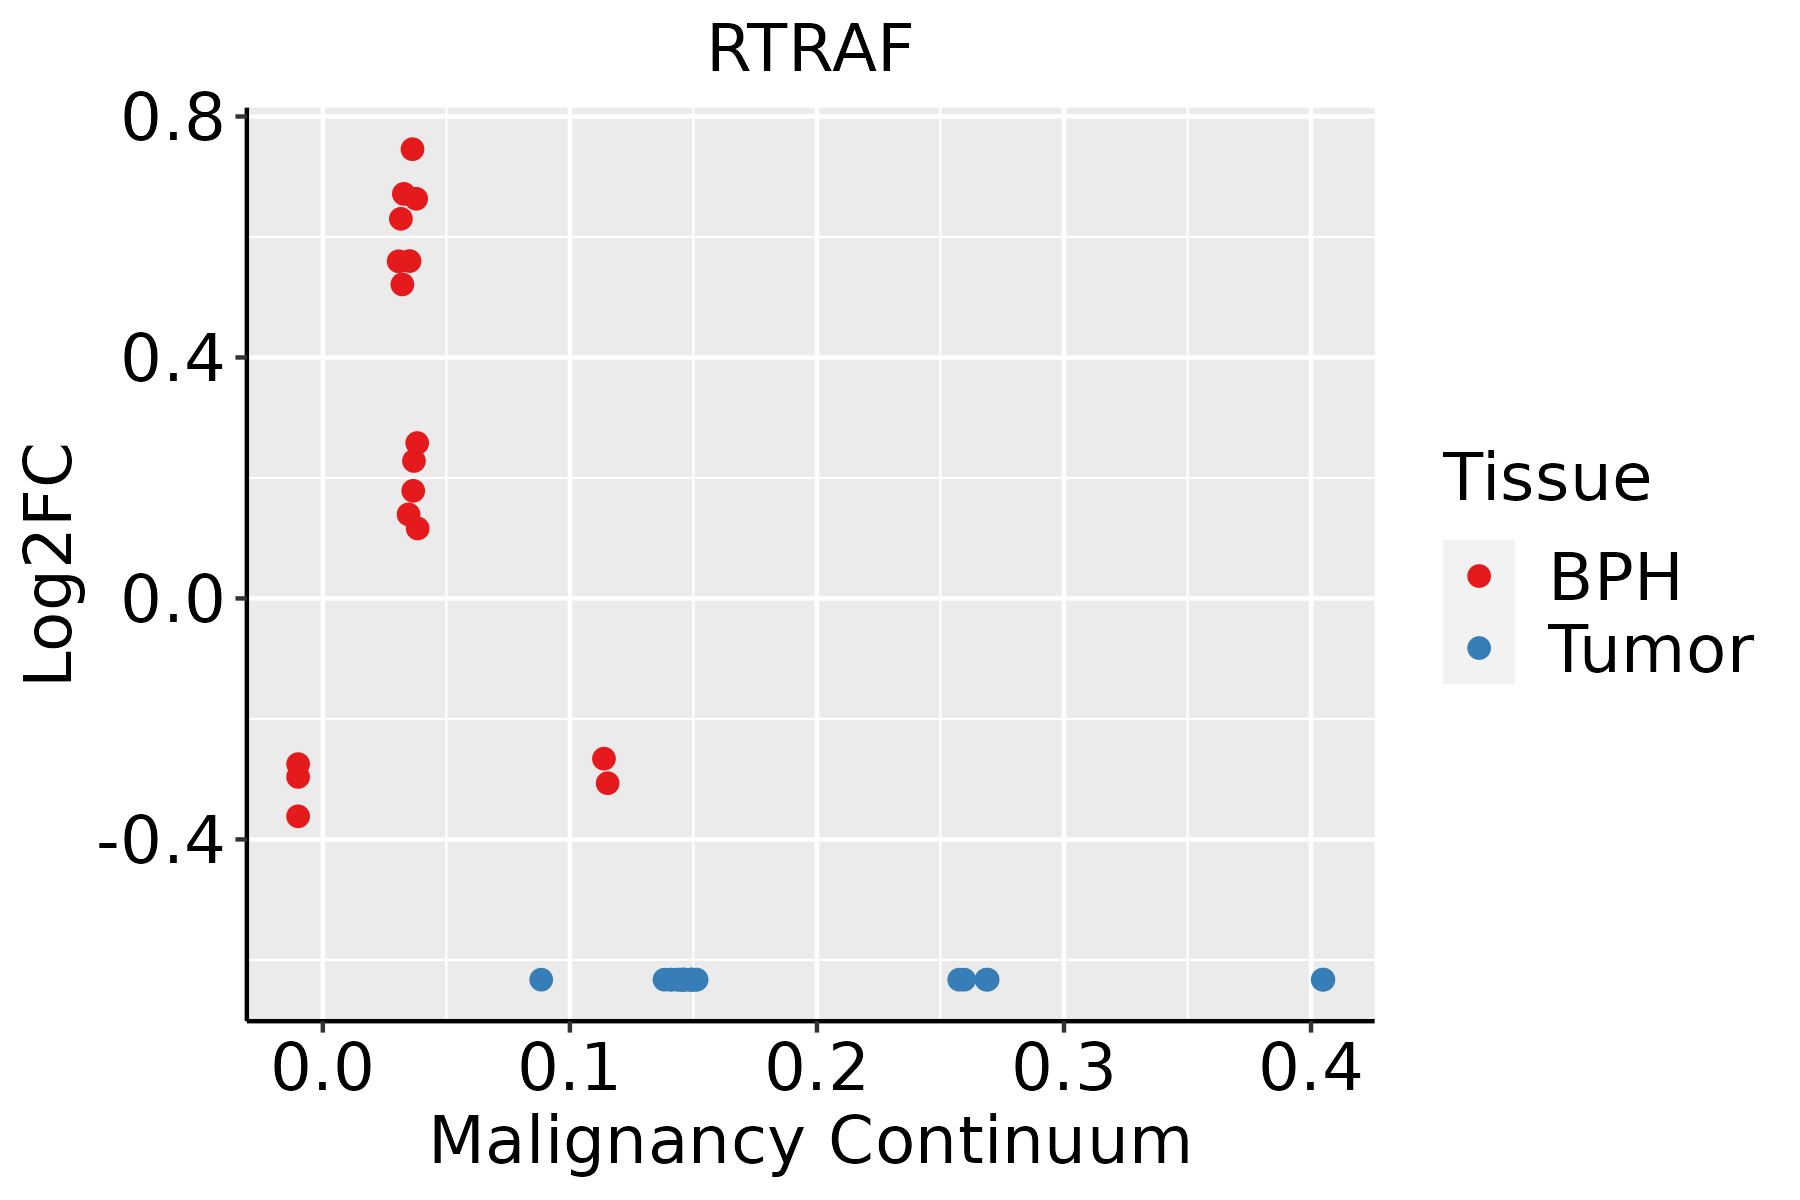 | BPH: Benign Prostatic Hyperplasia |
| Thyroid | 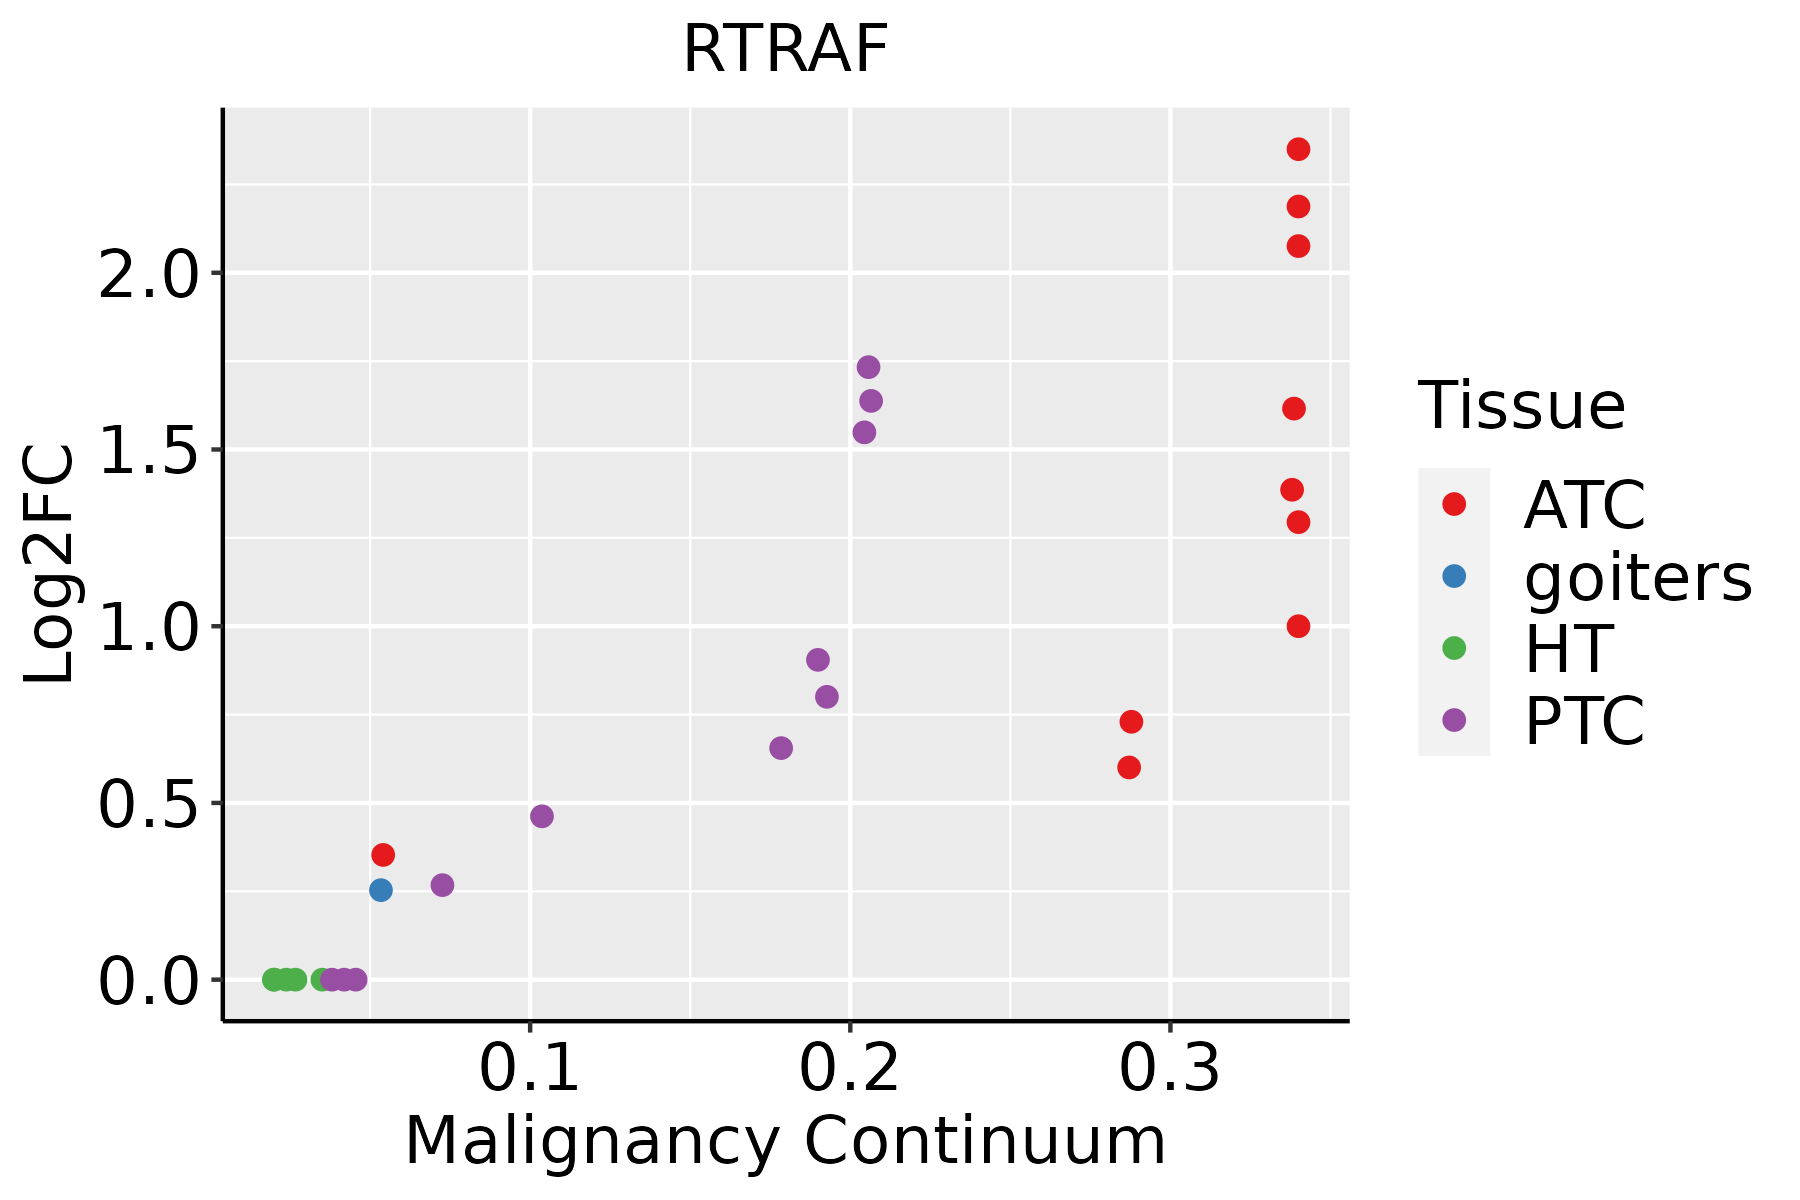 | ATC: Anaplastic thyroid cancer |
| HT: Hashimoto's thyroiditis | ||
| PTC: Papillary thyroid cancer |
| ∗log2FC in expression of this searched gene in stem-like cells from each diseased tissue sample relative to stem-like cells in normal samples in each tissue plotted against the malignancy continuum. Samples are colored based on if they are from different disease stage. |
Top |
Malignant transformation related pathway analysis |
| Find out the enriched GO biological processes and KEGG pathways involved in transition from healthy to precancer to cancer |
| Tissue | Disease Stage | Enriched GO biological Processes |
| Colorectum | AD |  |
| Colorectum | SER |  |
| Colorectum | MSS |  |
| Colorectum | MSI-H |  |
| Colorectum | FAP |  |
| ∗Top 15 enriched GO BP terms are showed in the bar plot of each disease state in each tissue. Each row represents a significant GO biological process which is colored according to the -log10(p.adjust). |
| Page: 1 2 3 4 5 6 7 8 9 |
| GO ID | Tissue | Disease Stage | Description | Gene Ratio | Bg Ratio | pvalue | p.adjust | Count |
| GO:00083809 | Breast | Precancer | RNA splicing | 65/1080 | 434/18723 | 1.27e-12 | 2.53e-10 | 65 |
| GO:00344705 | Breast | Precancer | ncRNA processing | 42/1080 | 395/18723 | 9.91e-05 | 1.83e-03 | 42 |
| GO:00346604 | Breast | Precancer | ncRNA metabolic process | 45/1080 | 485/18723 | 1.15e-03 | 1.26e-02 | 45 |
| GO:00064039 | Breast | Precancer | RNA localization | 23/1080 | 201/18723 | 1.34e-03 | 1.41e-02 | 23 |
| GO:00513489 | Breast | Precancer | negative regulation of transferase activity | 27/1080 | 268/18723 | 3.49e-03 | 2.90e-02 | 27 |
| GO:000838014 | Breast | IDC | RNA splicing | 73/1434 | 434/18723 | 1.27e-10 | 1.57e-08 | 73 |
| GO:005134814 | Breast | IDC | negative regulation of transferase activity | 39/1434 | 268/18723 | 7.89e-05 | 1.56e-03 | 39 |
| GO:00459369 | Breast | IDC | negative regulation of phosphate metabolic process | 53/1434 | 441/18723 | 7.21e-04 | 8.79e-03 | 53 |
| GO:00105639 | Breast | IDC | negative regulation of phosphorus metabolic process | 53/1434 | 442/18723 | 7.60e-04 | 9.25e-03 | 53 |
| GO:000640313 | Breast | IDC | RNA localization | 27/1434 | 201/18723 | 3.04e-03 | 2.60e-02 | 27 |
| GO:00064699 | Breast | IDC | negative regulation of protein kinase activity | 27/1434 | 212/18723 | 6.30e-03 | 4.47e-02 | 27 |
| GO:000838024 | Breast | DCIS | RNA splicing | 73/1390 | 434/18723 | 3.05e-11 | 5.08e-09 | 73 |
| GO:005134824 | Breast | DCIS | negative regulation of transferase activity | 39/1390 | 268/18723 | 4.02e-05 | 8.60e-04 | 39 |
| GO:004593614 | Breast | DCIS | negative regulation of phosphate metabolic process | 53/1390 | 441/18723 | 3.48e-04 | 4.96e-03 | 53 |
| GO:001056314 | Breast | DCIS | negative regulation of phosphorus metabolic process | 53/1390 | 442/18723 | 3.68e-04 | 5.18e-03 | 53 |
| GO:000640322 | Breast | DCIS | RNA localization | 27/1390 | 201/18723 | 1.97e-03 | 1.84e-02 | 27 |
| GO:000646913 | Breast | DCIS | negative regulation of protein kinase activity | 27/1390 | 212/18723 | 4.18e-03 | 3.30e-02 | 27 |
| GO:003447011 | Breast | DCIS | ncRNA processing | 44/1390 | 395/18723 | 4.56e-03 | 3.49e-02 | 44 |
| GO:00423269 | Breast | DCIS | negative regulation of phosphorylation | 43/1390 | 385/18723 | 4.78e-03 | 3.62e-02 | 43 |
| GO:00019339 | Breast | DCIS | negative regulation of protein phosphorylation | 39/1390 | 342/18723 | 4.94e-03 | 3.71e-02 | 39 |
| Page: 1 2 3 4 5 6 7 8 9 10 11 12 |
| Pathway ID | Tissue | Disease Stage | Description | Gene Ratio | Bg Ratio | pvalue | p.adjust | qvalue | Count |
| Page: 1 |
Top |
Cell-cell communication analysis |
| Identification of potential cell-cell interactions between two cell types and their ligand-receptor pairs for different disease states |
| Ligand | Receptor | LRpair | Pathway | Tissue | Disease Stage |
| Page: 1 |
Top |
Single-cell gene regulatory network inference analysis |
| Find out the significant the regulons (TFs) and the target genes of each regulon across cell types for different disease states |
| TF | Cell Type | Tissue | Disease Stage | Target Gene | RSS | Regulon Activity |
| ∗The dot plots of a searched regulon are shown for all cell subpopulations in each disease state of each tissue based on the regulon specific score inferred using pySCENIC and by calculating the average expression. |
| Page: 1 |
Top |
Somatic mutation of malignant transformation related genes |
| Annotation of somatic variants for genes involved in malignant transformation |
| Hugo Symbol | Variant Class | Variant Classification | dbSNP RS | HGVSc | HGVSp | HGVSp Short | SWISSPROT | BIOTYPE | SIFT | PolyPhen | Tumor Sample Barcode | Tissue | Histology | Sex | Age | Stage | Therapy Types | Drugs | Outcome |
| Page: 1 |
Top |
Related drugs of malignant transformation related genes |
| Identification of chemicals and drugs interact with genes involved in malignant transfromation |
| (DGIdb 4.0) |
| Entrez ID | Symbol | Category | Interaction Types | Drug Claim Name | Drug Name | PMIDs |
| Page: 1 |

Copyright 2023-Present -The University of Texas Health Science Center at Houston |