
|
|||||
|
 | |
| |
| |
| |
| |
| |
|
Gene: RTP4 |
Gene summary for RTP4 |
| Gene information | Species | Human | Gene symbol | RTP4 | Gene ID | 64108 |
| Gene name | receptor transporter protein 4 | |
| Gene Alias | IFRG28 | |
| Cytomap | 3q27.3 | |
| Gene Type | protein-coding | GO ID | GO:0001580 | UniProtAcc | Q96DX8 |
Top |
Malignant transformation analysis |
| Identification of the aberrant gene expression in precancerous and cancerous lesions by comparing the gene expression of stem-like cells in diseased tissues with normal stem cells |
| Entrez ID | Symbol | Replicates | Species | Organ | Tissue | Adj P-value | Log2FC | Malignancy |
| 64108 | RTP4 | LZE8T | Human | Esophagus | ESCC | 1.29e-06 | 2.05e-01 | 0.067 |
| 64108 | RTP4 | LZE20T | Human | Esophagus | ESCC | 8.77e-11 | 3.43e-01 | 0.0662 |
| 64108 | RTP4 | LZE24T | Human | Esophagus | ESCC | 2.58e-22 | 7.28e-01 | 0.0596 |
| 64108 | RTP4 | P1T-E | Human | Esophagus | ESCC | 9.66e-04 | 2.68e-01 | 0.0875 |
| 64108 | RTP4 | P2T-E | Human | Esophagus | ESCC | 1.19e-60 | 1.17e+00 | 0.1177 |
| 64108 | RTP4 | P4T-E | Human | Esophagus | ESCC | 3.96e-02 | 5.97e-02 | 0.1323 |
| 64108 | RTP4 | P5T-E | Human | Esophagus | ESCC | 2.15e-07 | 1.35e-01 | 0.1327 |
| 64108 | RTP4 | P8T-E | Human | Esophagus | ESCC | 2.62e-32 | 6.33e-01 | 0.0889 |
| 64108 | RTP4 | P9T-E | Human | Esophagus | ESCC | 6.20e-28 | 7.06e-01 | 0.1131 |
| 64108 | RTP4 | P11T-E | Human | Esophagus | ESCC | 2.24e-11 | 6.13e-01 | 0.1426 |
| 64108 | RTP4 | P15T-E | Human | Esophagus | ESCC | 2.06e-17 | 4.25e-01 | 0.1149 |
| 64108 | RTP4 | P17T-E | Human | Esophagus | ESCC | 3.96e-03 | 2.10e-01 | 0.1278 |
| 64108 | RTP4 | P20T-E | Human | Esophagus | ESCC | 1.86e-13 | 5.05e-01 | 0.1124 |
| 64108 | RTP4 | P21T-E | Human | Esophagus | ESCC | 4.27e-03 | 2.47e-01 | 0.1617 |
| 64108 | RTP4 | P22T-E | Human | Esophagus | ESCC | 1.10e-08 | 1.86e-01 | 0.1236 |
| 64108 | RTP4 | P23T-E | Human | Esophagus | ESCC | 7.57e-32 | 8.11e-01 | 0.108 |
| 64108 | RTP4 | P24T-E | Human | Esophagus | ESCC | 4.58e-29 | 7.21e-01 | 0.1287 |
| 64108 | RTP4 | P26T-E | Human | Esophagus | ESCC | 8.21e-03 | 2.18e-01 | 0.1276 |
| 64108 | RTP4 | P27T-E | Human | Esophagus | ESCC | 7.02e-19 | 5.21e-01 | 0.1055 |
| 64108 | RTP4 | P28T-E | Human | Esophagus | ESCC | 1.71e-15 | 4.77e-01 | 0.1149 |
| Page: 1 2 3 4 |
| Tissue | Expression Dynamics | Abbreviation |
| Esophagus | 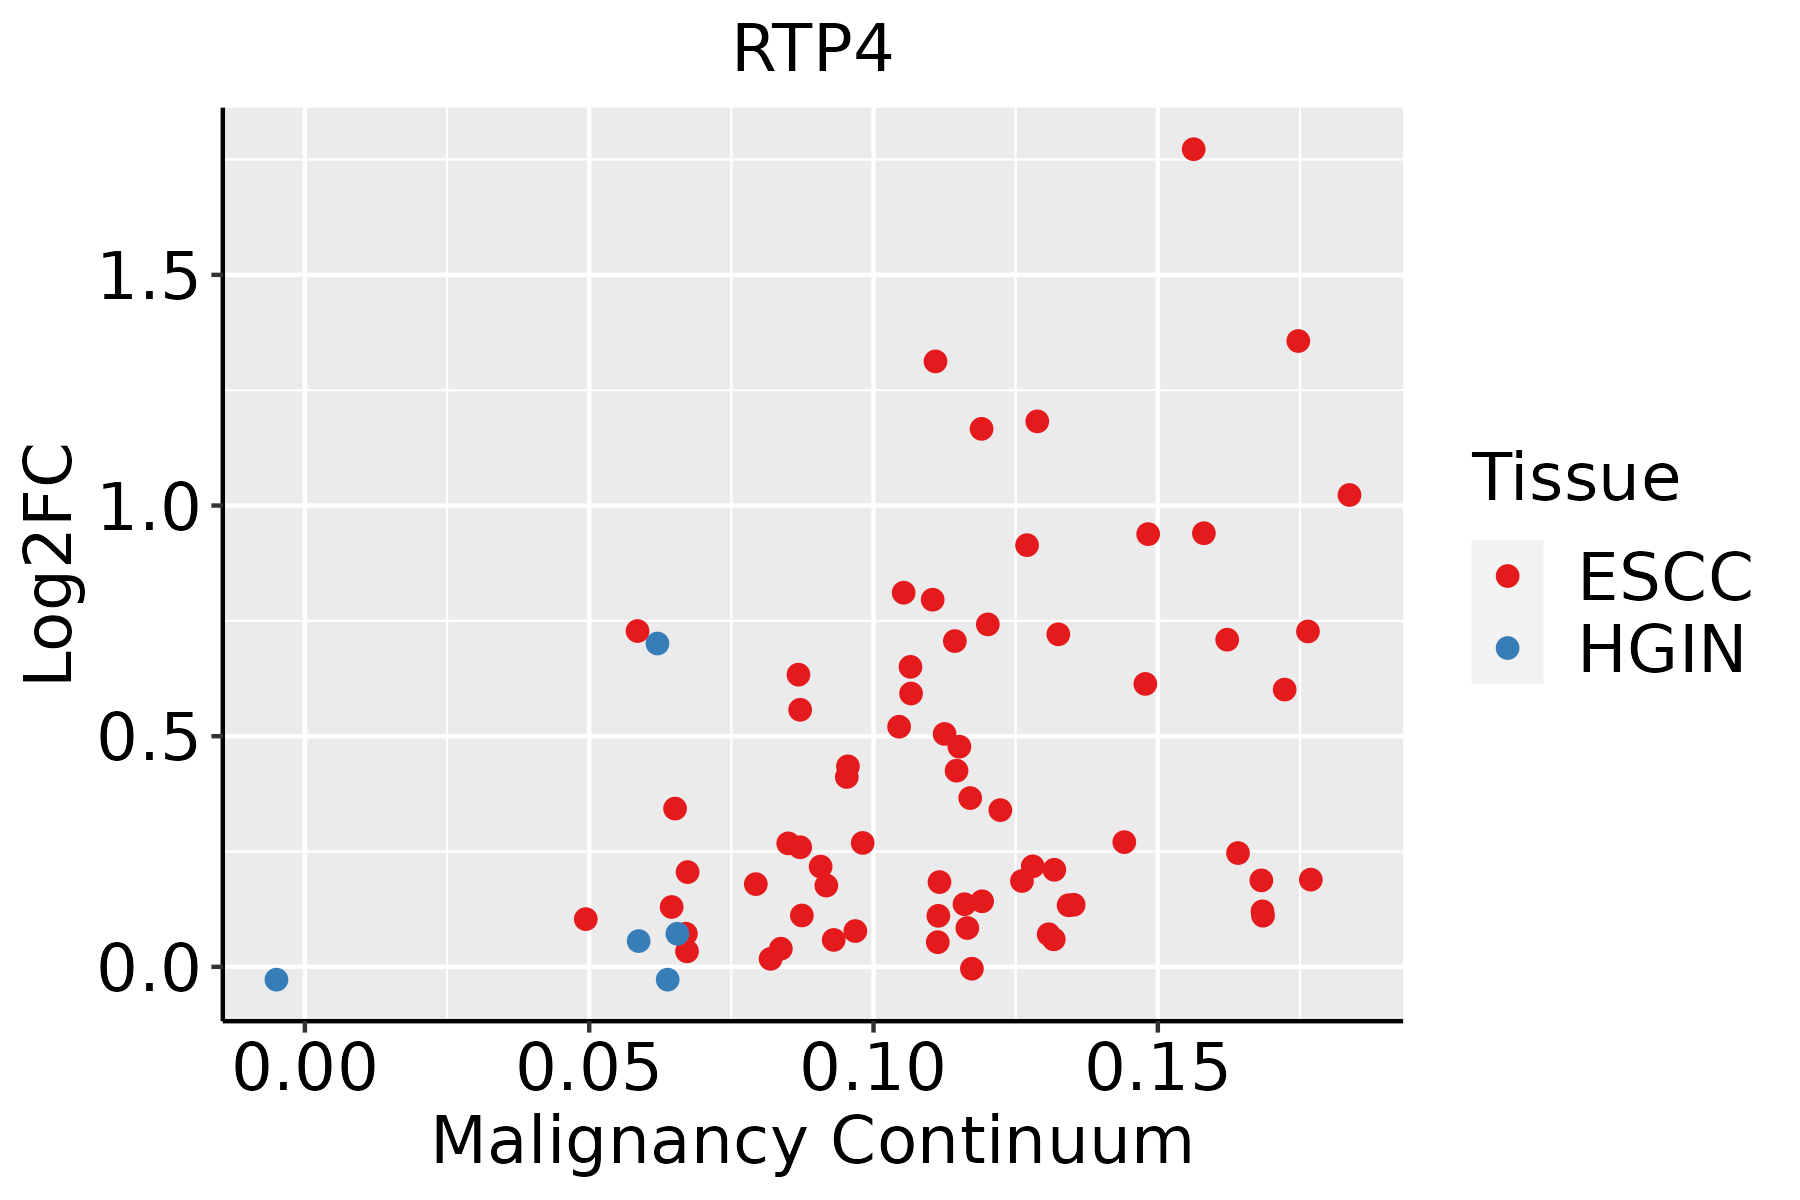 | ESCC: Esophageal squamous cell carcinoma |
| HGIN: High-grade intraepithelial neoplasias | ||
| LGIN: Low-grade intraepithelial neoplasias | ||
| Oral Cavity |  | EOLP: Erosive Oral lichen planus |
| LP: leukoplakia | ||
| NEOLP: Non-erosive oral lichen planus | ||
| OSCC: Oral squamous cell carcinoma |
| ∗log2FC in expression of this searched gene in stem-like cells from each diseased tissue sample relative to stem-like cells in normal samples in each tissue plotted against the malignancy continuum. Samples are colored based on if they are from different disease stage. |
Top |
Malignant transformation related pathway analysis |
| Find out the enriched GO biological processes and KEGG pathways involved in transition from healthy to precancer to cancer |
| Tissue | Disease Stage | Enriched GO biological Processes |
| Colorectum | AD |  |
| Colorectum | SER |  |
| Colorectum | MSS |  |
| Colorectum | MSI-H |  |
| Colorectum | FAP |  |
| ∗Top 15 enriched GO BP terms are showed in the bar plot of each disease state in each tissue. Each row represents a significant GO biological process which is colored according to the -log10(p.adjust). |
| Page: 1 2 3 4 5 6 7 8 9 |
| GO ID | Tissue | Disease Stage | Description | Gene Ratio | Bg Ratio | pvalue | p.adjust | Count |
| GO:0006605111 | Esophagus | ESCC | protein targeting | 229/8552 | 314/18723 | 4.93e-23 | 1.01e-20 | 229 |
| GO:0090150110 | Esophagus | ESCC | establishment of protein localization to membrane | 182/8552 | 260/18723 | 1.27e-15 | 8.19e-14 | 182 |
| GO:000961518 | Esophagus | ESCC | response to virus | 238/8552 | 367/18723 | 6.65e-14 | 3.32e-12 | 238 |
| GO:00516075 | Esophagus | ESCC | defense response to virus | 171/8552 | 265/18723 | 3.91e-10 | 1.05e-08 | 171 |
| GO:01405465 | Esophagus | ESCC | defense response to symbiont | 171/8552 | 265/18723 | 3.91e-10 | 1.05e-08 | 171 |
| GO:005120515 | Esophagus | ESCC | protein insertion into membrane | 46/8552 | 57/18723 | 5.90e-08 | 1.04e-06 | 46 |
| GO:00066124 | Esophagus | ESCC | protein targeting to membrane | 83/8552 | 131/18723 | 3.31e-05 | 2.73e-04 | 83 |
| GO:000660520 | Oral cavity | OSCC | protein targeting | 204/7305 | 314/18723 | 6.78e-21 | 1.13e-18 | 204 |
| GO:009015018 | Oral cavity | OSCC | establishment of protein localization to membrane | 163/7305 | 260/18723 | 7.13e-15 | 4.47e-13 | 163 |
| GO:000961515 | Oral cavity | OSCC | response to virus | 215/7305 | 367/18723 | 1.63e-14 | 9.41e-13 | 215 |
| GO:00516074 | Oral cavity | OSCC | defense response to virus | 154/7305 | 265/18723 | 1.96e-10 | 5.63e-09 | 154 |
| GO:01405464 | Oral cavity | OSCC | defense response to symbiont | 154/7305 | 265/18723 | 1.96e-10 | 5.63e-09 | 154 |
| GO:00512056 | Oral cavity | OSCC | protein insertion into membrane | 40/7305 | 57/18723 | 1.81e-06 | 2.34e-05 | 40 |
| GO:00066123 | Oral cavity | OSCC | protein targeting to membrane | 75/7305 | 131/18723 | 1.72e-05 | 1.69e-04 | 75 |
| GO:0006605110 | Oral cavity | LP | protein targeting | 156/4623 | 314/18723 | 5.43e-22 | 1.62e-19 | 156 |
| GO:009015019 | Oral cavity | LP | establishment of protein localization to membrane | 128/4623 | 260/18723 | 7.19e-18 | 1.19e-15 | 128 |
| GO:000961516 | Oral cavity | LP | response to virus | 143/4623 | 367/18723 | 7.42e-10 | 3.52e-08 | 143 |
| GO:005120514 | Oral cavity | LP | protein insertion into membrane | 35/4623 | 57/18723 | 4.38e-09 | 1.86e-07 | 35 |
| GO:000661211 | Oral cavity | LP | protein targeting to membrane | 60/4623 | 131/18723 | 1.10e-07 | 3.59e-06 | 60 |
| GO:005160711 | Oral cavity | LP | defense response to virus | 97/4623 | 265/18723 | 9.31e-06 | 1.74e-04 | 97 |
| Page: 1 2 |
| Pathway ID | Tissue | Disease Stage | Description | Gene Ratio | Bg Ratio | pvalue | p.adjust | qvalue | Count |
| Page: 1 |
Top |
Cell-cell communication analysis |
| Identification of potential cell-cell interactions between two cell types and their ligand-receptor pairs for different disease states |
| Ligand | Receptor | LRpair | Pathway | Tissue | Disease Stage |
| Page: 1 |
Top |
Single-cell gene regulatory network inference analysis |
| Find out the significant the regulons (TFs) and the target genes of each regulon across cell types for different disease states |
| TF | Cell Type | Tissue | Disease Stage | Target Gene | RSS | Regulon Activity |
| ∗The dot plots of a searched regulon are shown for all cell subpopulations in each disease state of each tissue based on the regulon specific score inferred using pySCENIC and by calculating the average expression. |
| Page: 1 |
Top |
Somatic mutation of malignant transformation related genes |
| Annotation of somatic variants for genes involved in malignant transformation |
| Hugo Symbol | Variant Class | Variant Classification | dbSNP RS | HGVSc | HGVSp | HGVSp Short | SWISSPROT | BIOTYPE | SIFT | PolyPhen | Tumor Sample Barcode | Tissue | Histology | Sex | Age | Stage | Therapy Types | Drugs | Outcome |
| RTP4 | SNV | Missense_Mutation | c.24N>T | p.Trp8Cys | p.W8C | Q96DX8 | protein_coding | deleterious(0) | probably_damaging(1) | TCGA-AN-A0AK-01 | Breast | breast invasive carcinoma | Female | >=65 | I/II | Unknown | Unknown | SD | |
| RTP4 | insertion | Nonsense_Mutation | novel | c.543_544insCATAGTACTCTTTAGGGTCGACATGAT | p.Leu181_Lys182insHisSerThrLeuTerGlyArgHisAsp | p.L181_K182insHSTL*GRHD | Q96DX8 | protein_coding | TCGA-AO-A0JJ-01 | Breast | breast invasive carcinoma | Female | <65 | I/II | Chemotherapy | cyclophospamide | SD | ||
| RTP4 | SNV | Missense_Mutation | rs745497502 | c.304G>A | p.Glu102Lys | p.E102K | Q96DX8 | protein_coding | deleterious(0) | probably_damaging(0.996) | TCGA-VS-A9V3-01 | Cervix | cervical & endocervical cancer | Female | <65 | I/II | Chemotherapy | cisplatin | PD |
| RTP4 | SNV | Missense_Mutation | rs756068946 | c.160N>T | p.Arg54Trp | p.R54W | Q96DX8 | protein_coding | tolerated(0.13) | benign(0.017) | TCGA-G4-6309-01 | Colorectum | colon adenocarcinoma | Female | <65 | III/IV | Chemotherapy | xeloda | PD |
| RTP4 | SNV | Missense_Mutation | novel | c.318N>A | p.Phe106Leu | p.F106L | Q96DX8 | protein_coding | deleterious(0) | probably_damaging(0.96) | TCGA-AG-A002-01 | Colorectum | rectum adenocarcinoma | Male | <65 | I/II | Unknown | Unknown | SD |
| RTP4 | SNV | Missense_Mutation | rs776702663 | c.323N>T | p.Ser108Leu | p.S108L | Q96DX8 | protein_coding | tolerated(0.28) | benign(0.053) | TCGA-F5-6814-01 | Colorectum | rectum adenocarcinoma | Male | <65 | I/II | Unknown | Unknown | SD |
| RTP4 | deletion | Frame_Shift_Del | c.498delN | p.Ser168AlafsTer3 | p.S168Afs*3 | Q96DX8 | protein_coding | TCGA-AA-A02R-01 | Colorectum | colon adenocarcinoma | Female | >=65 | I/II | Unknown | Unknown | PD | |||
| RTP4 | SNV | Missense_Mutation | rs770515149 | c.229C>T | p.His77Tyr | p.H77Y | Q96DX8 | protein_coding | deleterious(0.04) | possibly_damaging(0.805) | TCGA-AJ-A3BG-01 | Endometrium | uterine corpus endometrioid carcinoma | Female | >=65 | I/II | Chemotherapy | carboplatin | PD |
| RTP4 | SNV | Missense_Mutation | rs776702663 | c.323N>T | p.Ser108Leu | p.S108L | Q96DX8 | protein_coding | tolerated(0.28) | benign(0.053) | TCGA-AJ-A3BH-01 | Endometrium | uterine corpus endometrioid carcinoma | Female | Unknown | I/II | Unknown | Unknown | SD |
| RTP4 | SNV | Missense_Mutation | novel | c.141N>T | p.Gln47His | p.Q47H | Q96DX8 | protein_coding | deleterious(0.03) | possibly_damaging(0.496) | TCGA-AP-A1DV-01 | Endometrium | uterine corpus endometrioid carcinoma | Female | <65 | I/II | Unknown | Unknown | SD |
| Page: 1 2 3 4 |
Top |
Related drugs of malignant transformation related genes |
| Identification of chemicals and drugs interact with genes involved in malignant transfromation |
| (DGIdb 4.0) |
| Entrez ID | Symbol | Category | Interaction Types | Drug Claim Name | Drug Name | PMIDs |
| Page: 1 |

Copyright 2023-Present -The University of Texas Health Science Center at Houston |