
|
|||||
|
 | |
| |
| |
| |
| |
| |
|
Gene: RTN4 |
Gene summary for RTN4 |
| Gene information | Species | Human | Gene symbol | RTN4 | Gene ID | 57142 |
| Gene name | reticulon 4 | |
| Gene Alias | ASY | |
| Cytomap | 2p16.1 | |
| Gene Type | protein-coding | GO ID | GO:0000902 | UniProtAcc | Q9NQC3 |
Top |
Malignant transformation analysis |
| Identification of the aberrant gene expression in precancerous and cancerous lesions by comparing the gene expression of stem-like cells in diseased tissues with normal stem cells |
| Entrez ID | Symbol | Replicates | Species | Organ | Tissue | Adj P-value | Log2FC | Malignancy |
| 57142 | RTN4 | GSM4909282 | Human | Breast | IDC | 8.74e-05 | 2.28e-01 | -0.0288 |
| 57142 | RTN4 | GSM4909286 | Human | Breast | IDC | 3.74e-18 | -4.73e-01 | 0.1081 |
| 57142 | RTN4 | GSM4909291 | Human | Breast | IDC | 2.10e-09 | -5.84e-01 | 0.1753 |
| 57142 | RTN4 | GSM4909294 | Human | Breast | IDC | 1.64e-16 | -4.07e-01 | 0.2022 |
| 57142 | RTN4 | GSM4909296 | Human | Breast | IDC | 1.71e-23 | -5.88e-01 | 0.1524 |
| 57142 | RTN4 | GSM4909297 | Human | Breast | IDC | 2.30e-31 | -6.23e-01 | 0.1517 |
| 57142 | RTN4 | GSM4909298 | Human | Breast | IDC | 2.91e-08 | -3.06e-01 | 0.1551 |
| 57142 | RTN4 | GSM4909301 | Human | Breast | IDC | 1.58e-06 | -3.75e-01 | 0.1577 |
| 57142 | RTN4 | GSM4909302 | Human | Breast | IDC | 3.57e-14 | -5.61e-01 | 0.1545 |
| 57142 | RTN4 | GSM4909308 | Human | Breast | IDC | 2.13e-06 | 2.69e-01 | 0.158 |
| 57142 | RTN4 | GSM4909309 | Human | Breast | IDC | 4.42e-10 | -5.16e-01 | 0.0483 |
| 57142 | RTN4 | GSM4909311 | Human | Breast | IDC | 8.17e-58 | -8.40e-01 | 0.1534 |
| 57142 | RTN4 | GSM4909312 | Human | Breast | IDC | 8.12e-16 | -3.53e-01 | 0.1552 |
| 57142 | RTN4 | GSM4909315 | Human | Breast | IDC | 1.70e-03 | -2.17e-01 | 0.21 |
| 57142 | RTN4 | GSM4909318 | Human | Breast | IDC | 1.69e-04 | -6.32e-01 | 0.2031 |
| 57142 | RTN4 | GSM4909319 | Human | Breast | IDC | 2.26e-61 | -7.34e-01 | 0.1563 |
| 57142 | RTN4 | GSM4909320 | Human | Breast | IDC | 1.58e-13 | -7.17e-01 | 0.1575 |
| 57142 | RTN4 | GSM4909321 | Human | Breast | IDC | 9.94e-19 | -2.80e-01 | 0.1559 |
| 57142 | RTN4 | brca1 | Human | Breast | Precancer | 2.77e-11 | 3.28e-01 | -0.0338 |
| 57142 | RTN4 | brca2 | Human | Breast | Precancer | 1.20e-02 | 1.91e-01 | -0.024 |
| Page: 1 2 3 4 5 6 7 8 9 10 11 12 13 14 |
| Tissue | Expression Dynamics | Abbreviation |
| Breast | 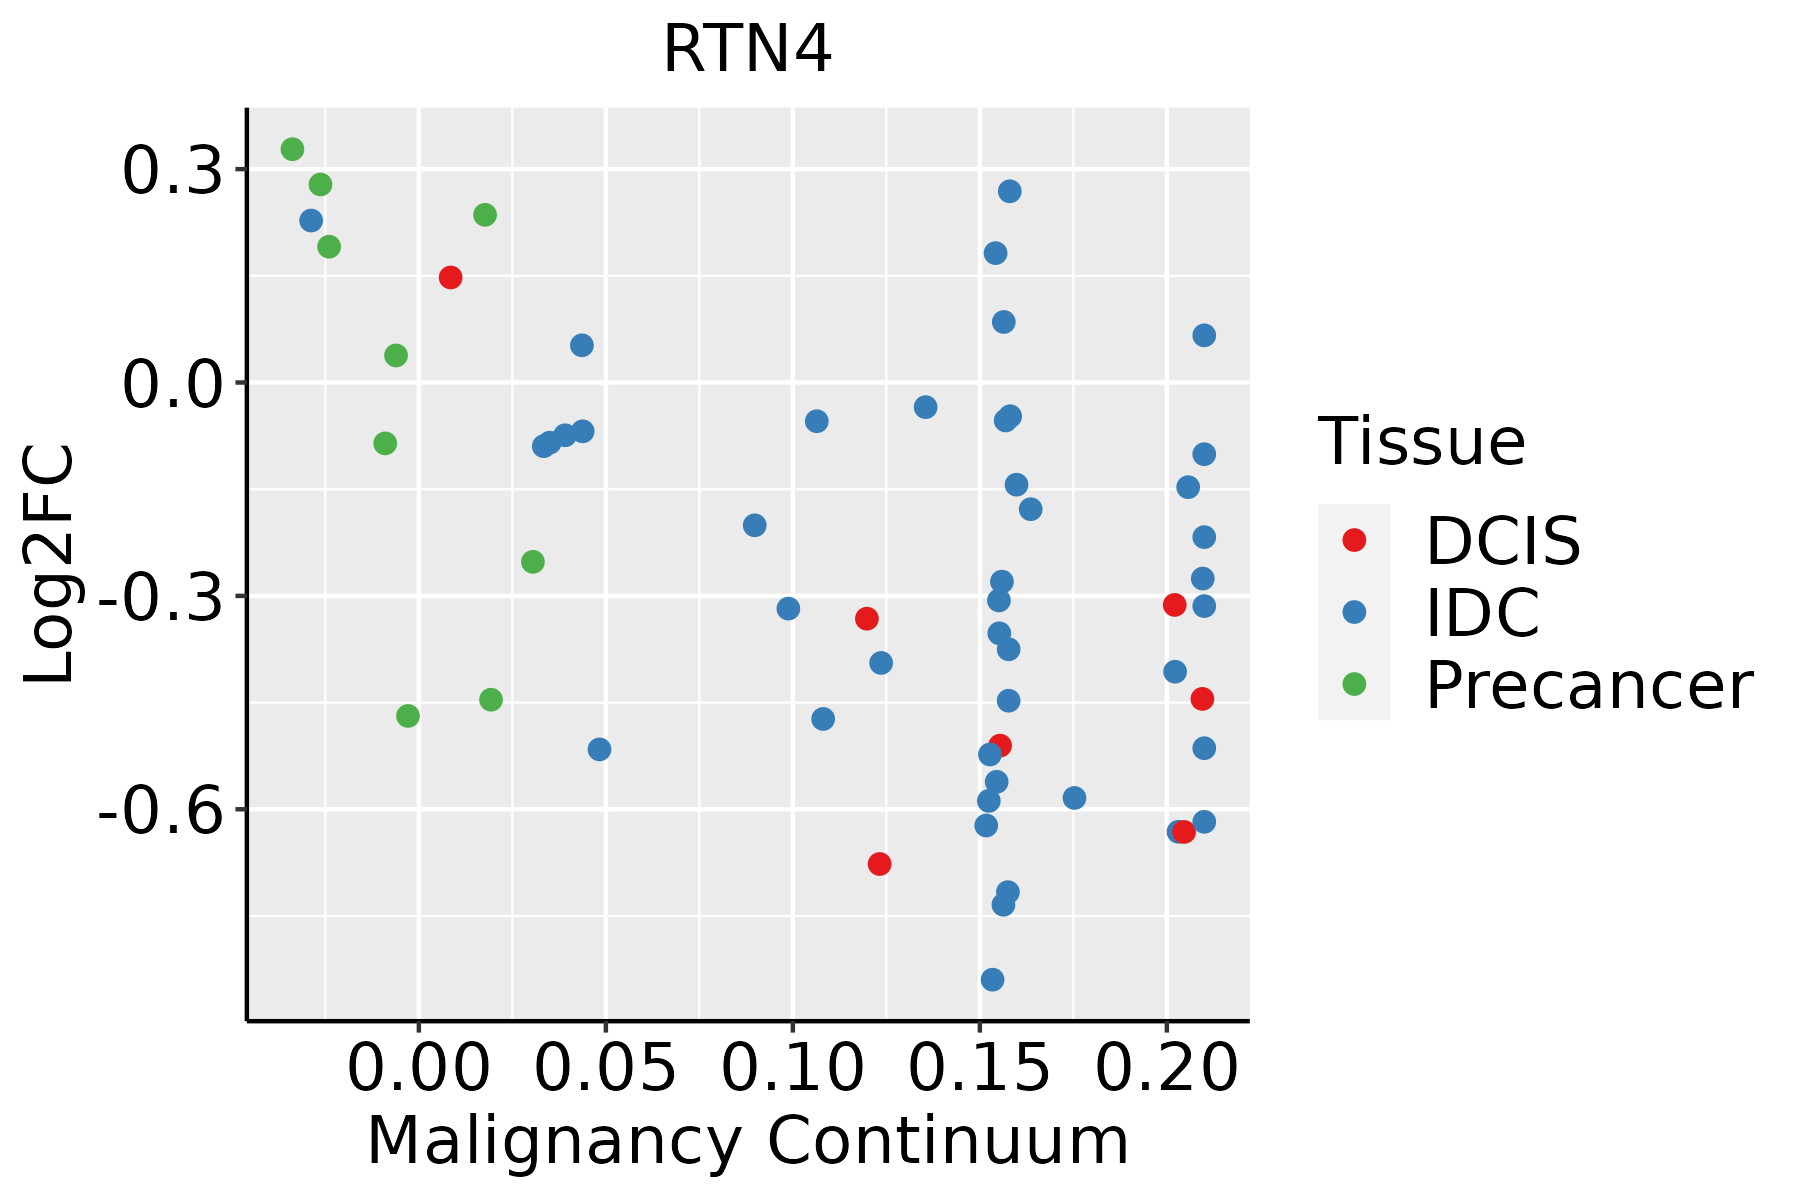 | IDC: Invasive ductal carcinoma |
| DCIS: Ductal carcinoma in situ | ||
| Precancer(BRCA1-mut): Precancerous lesion from BRCA1 mutation carriers | ||
| Cervix | 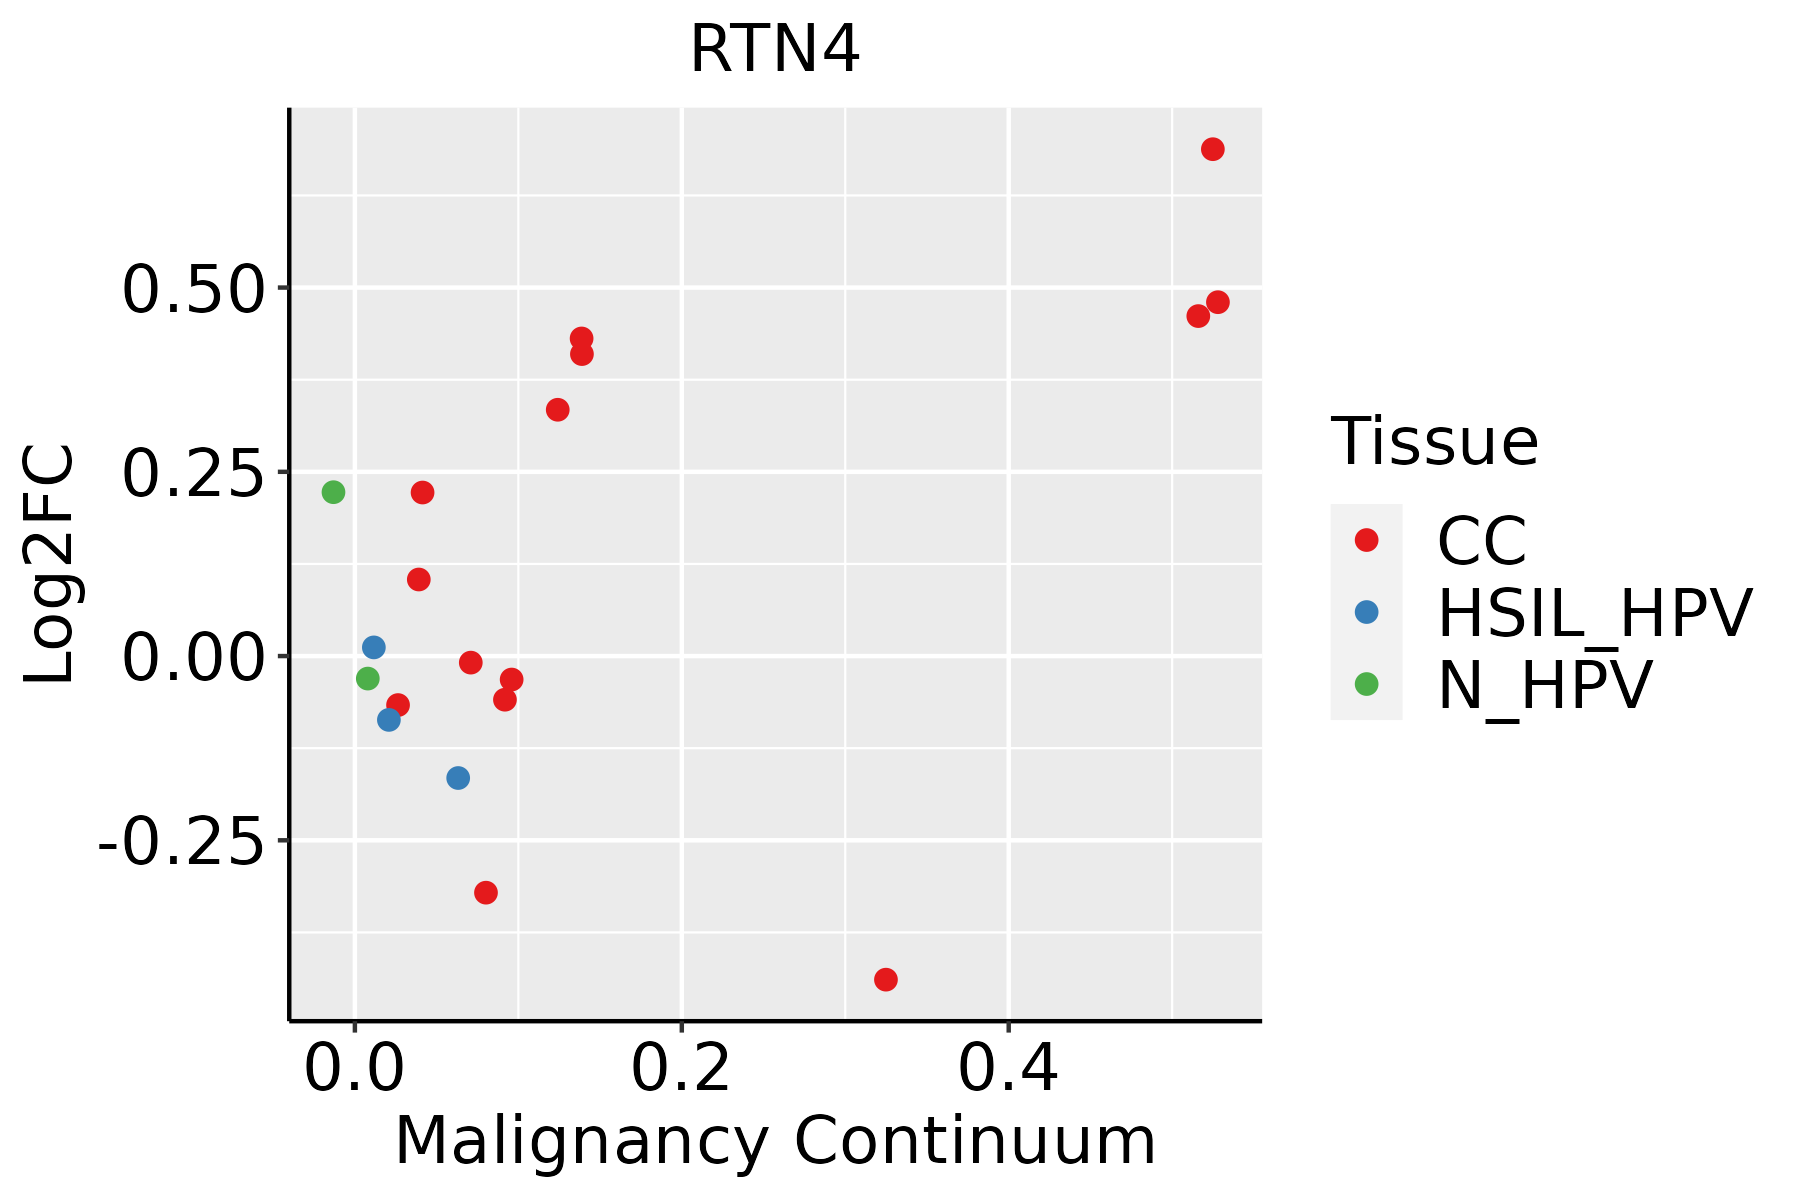 | CC: Cervix cancer |
| HSIL_HPV: HPV-infected high-grade squamous intraepithelial lesions | ||
| N_HPV: HPV-infected normal cervix | ||
| Colorectum (GSE201348) |  | FAP: Familial adenomatous polyposis |
| CRC: Colorectal cancer | ||
| Colorectum (HTA11) |  | AD: Adenomas |
| SER: Sessile serrated lesions | ||
| MSI-H: Microsatellite-high colorectal cancer | ||
| MSS: Microsatellite stable colorectal cancer | ||
| Endometrium | 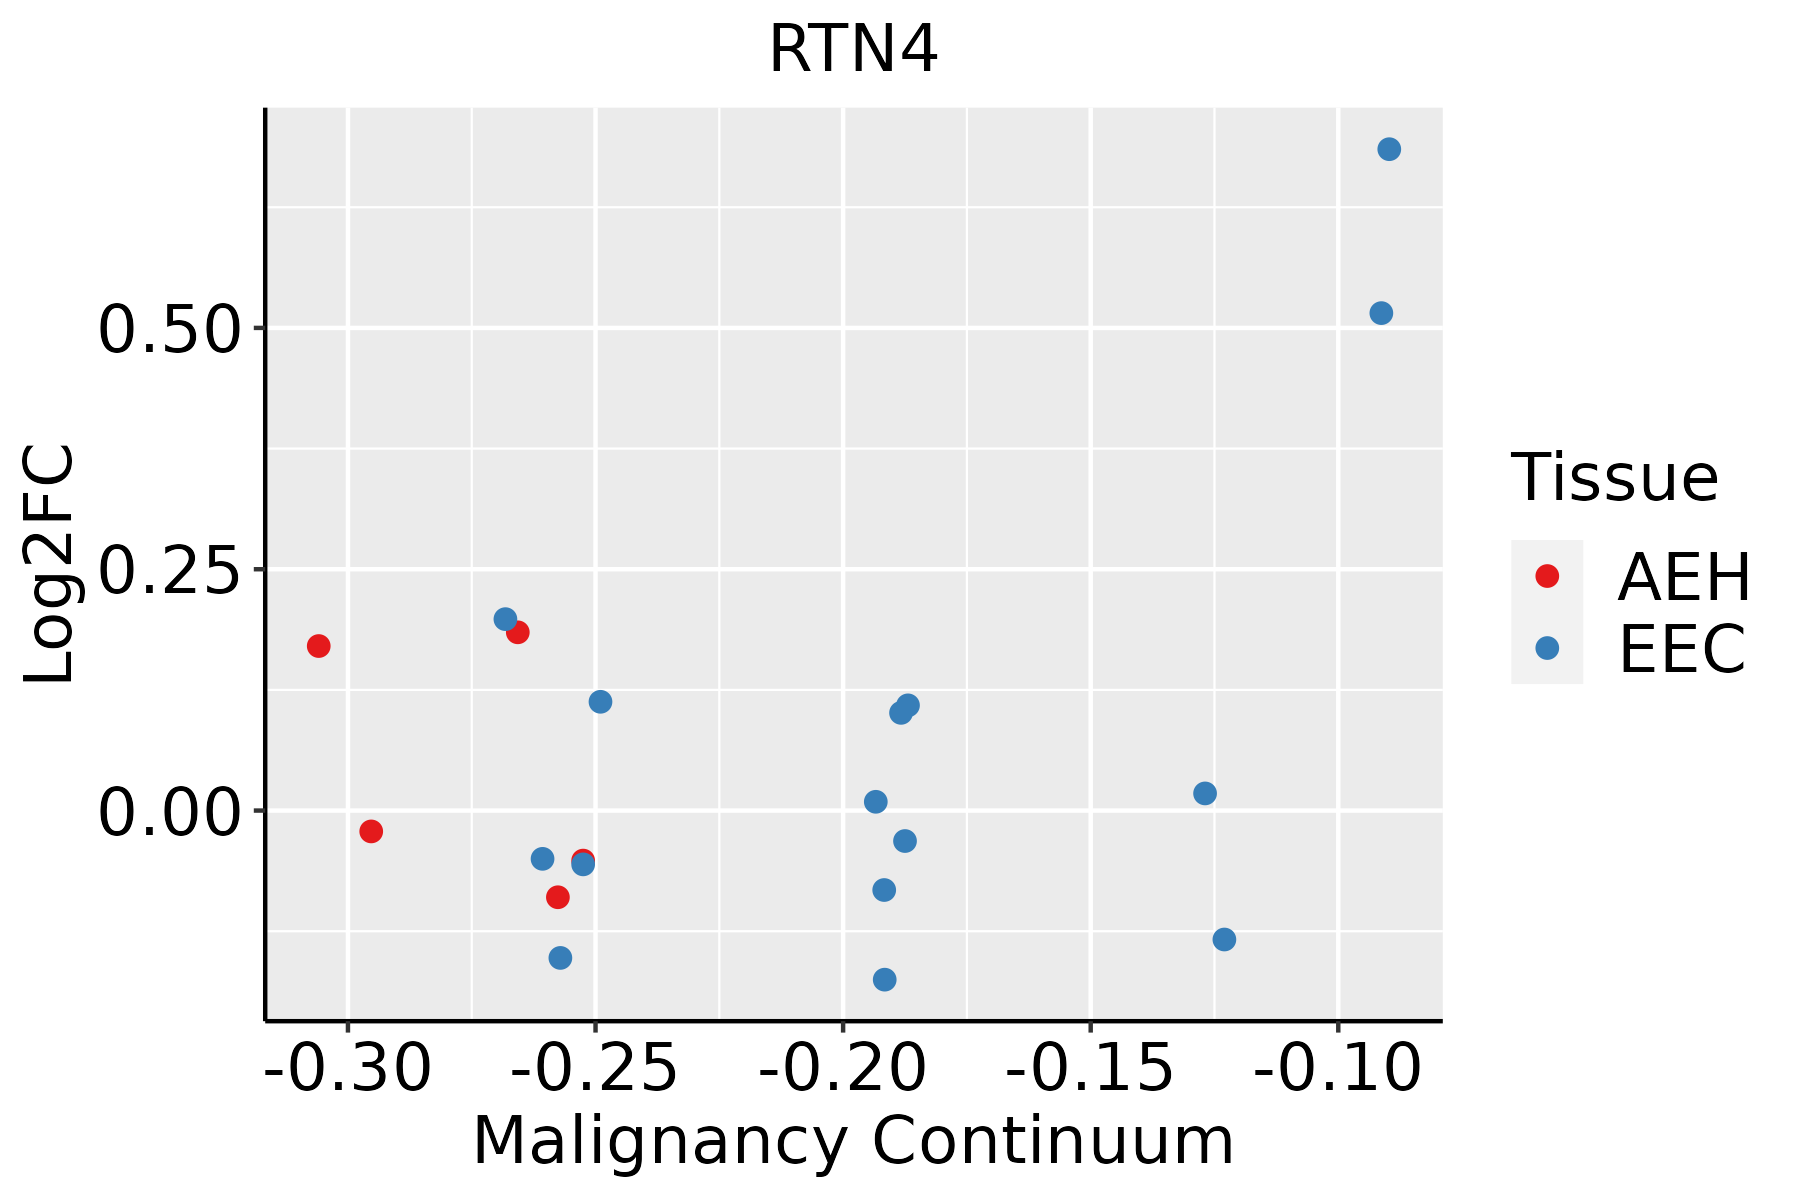 | AEH: Atypical endometrial hyperplasia |
| EEC: Endometrioid Cancer | ||
| Esophagus |  | ESCC: Esophageal squamous cell carcinoma |
| HGIN: High-grade intraepithelial neoplasias | ||
| LGIN: Low-grade intraepithelial neoplasias | ||
| Liver | 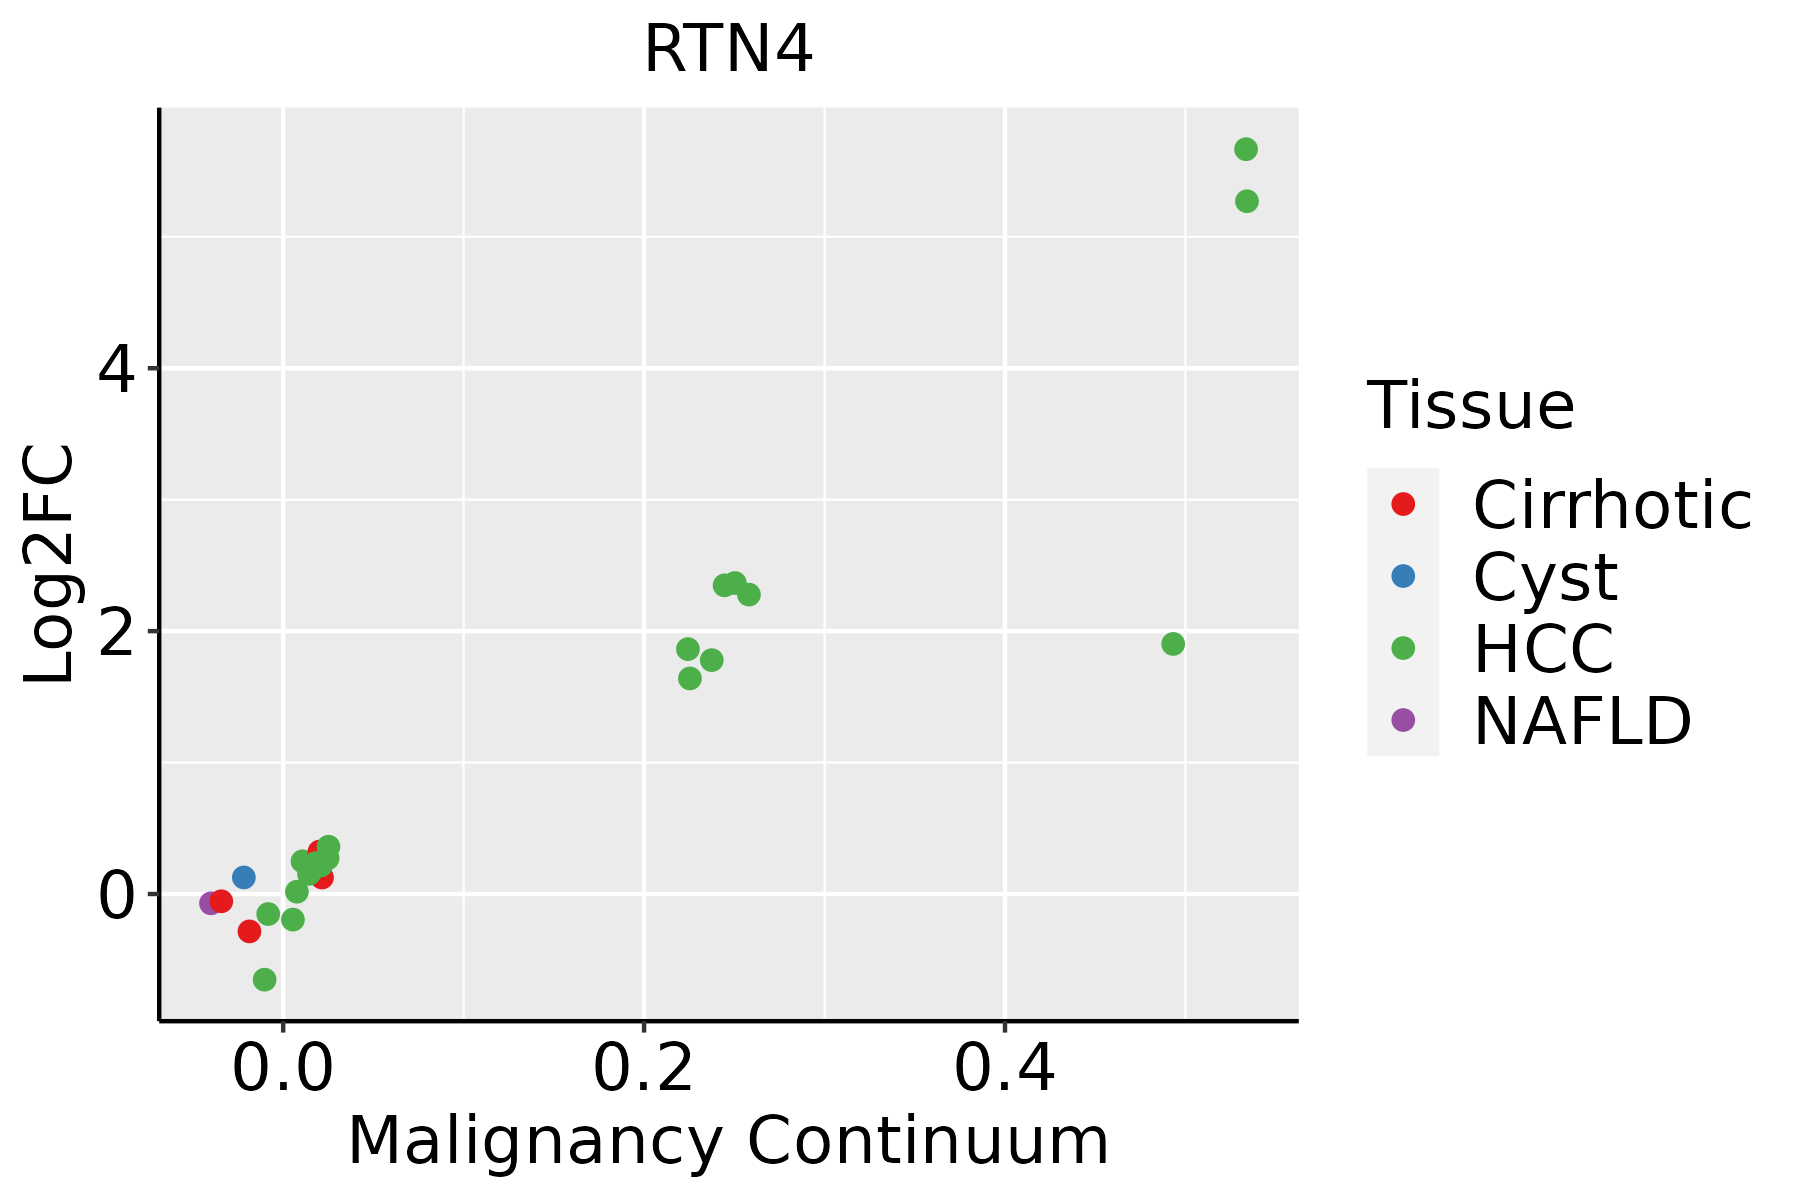 | HCC: Hepatocellular carcinoma |
| NAFLD: Non-alcoholic fatty liver disease | ||
| Oral Cavity |  | EOLP: Erosive Oral lichen planus |
| LP: leukoplakia | ||
| NEOLP: Non-erosive oral lichen planus | ||
| OSCC: Oral squamous cell carcinoma | ||
| Prostate | 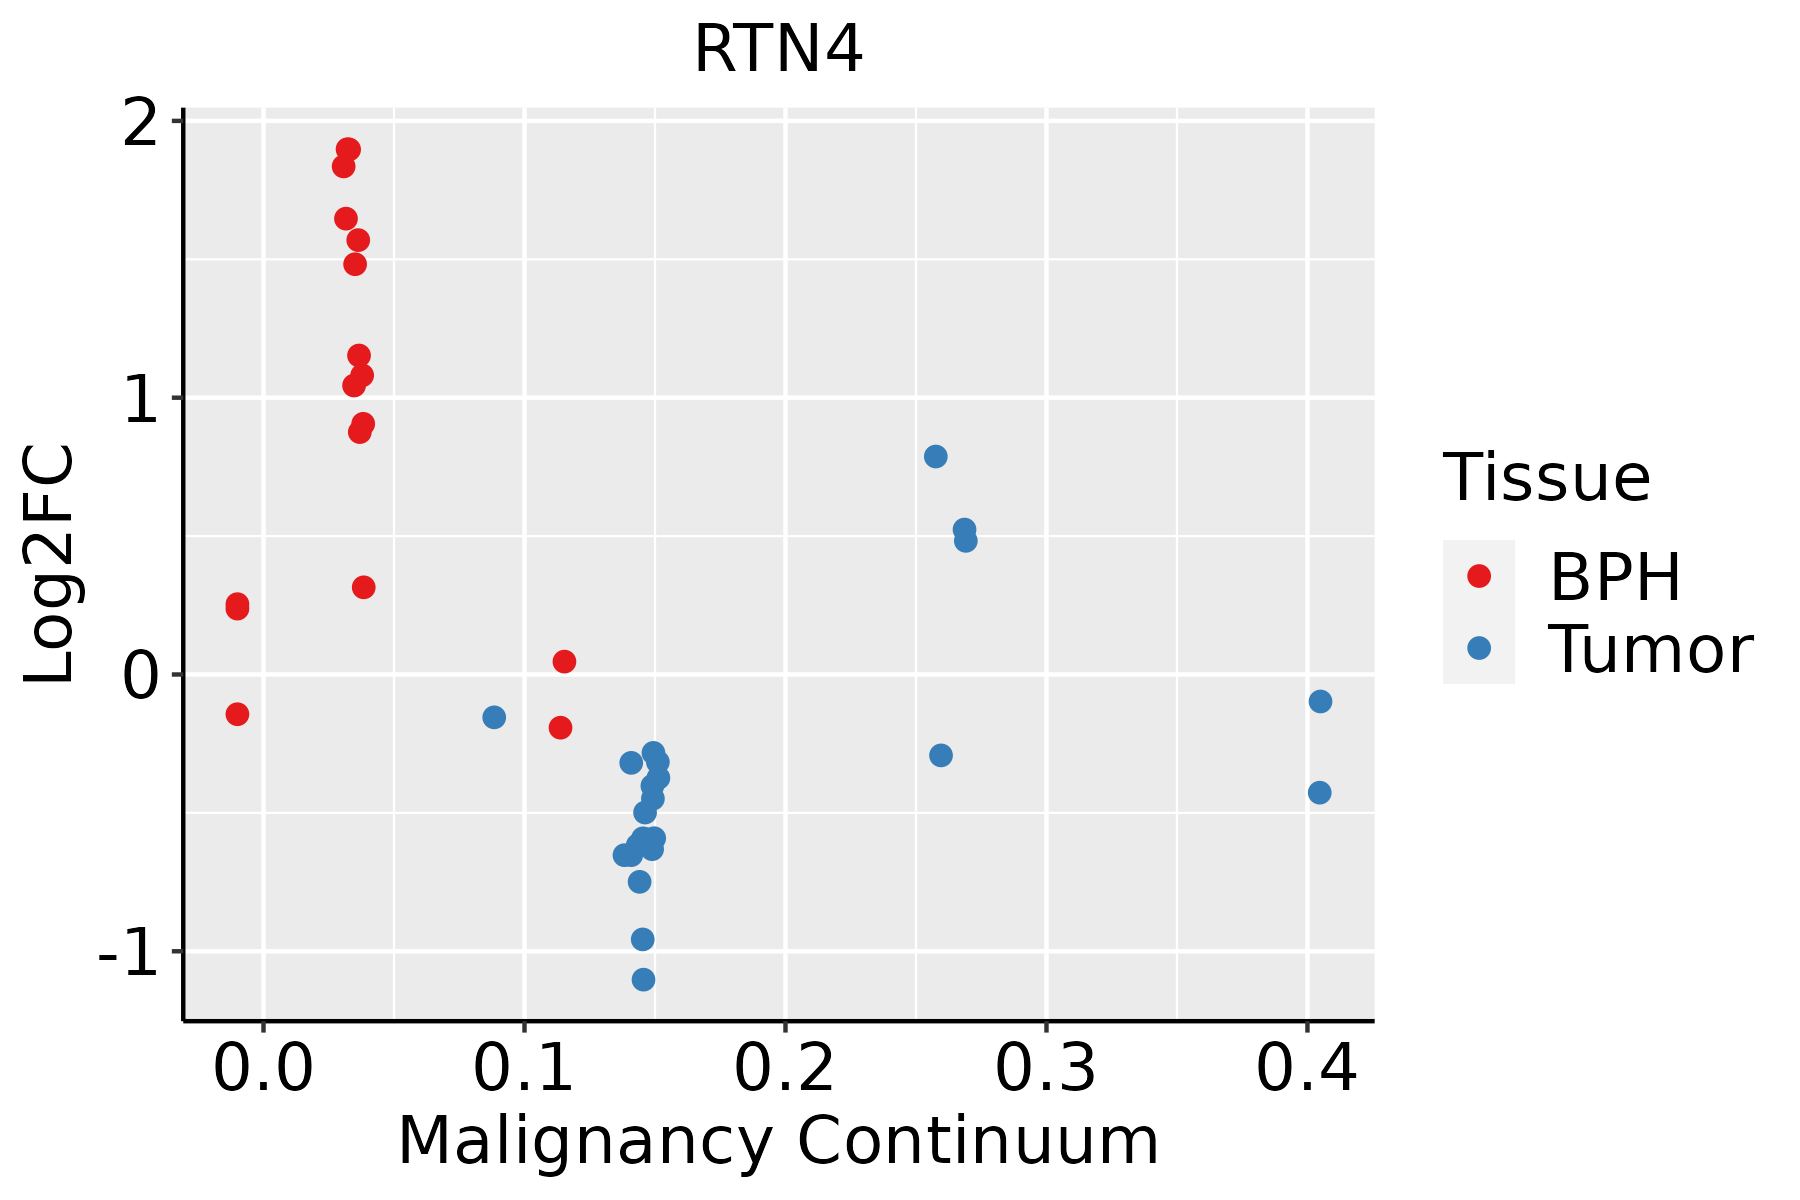 | BPH: Benign Prostatic Hyperplasia |
| Skin | 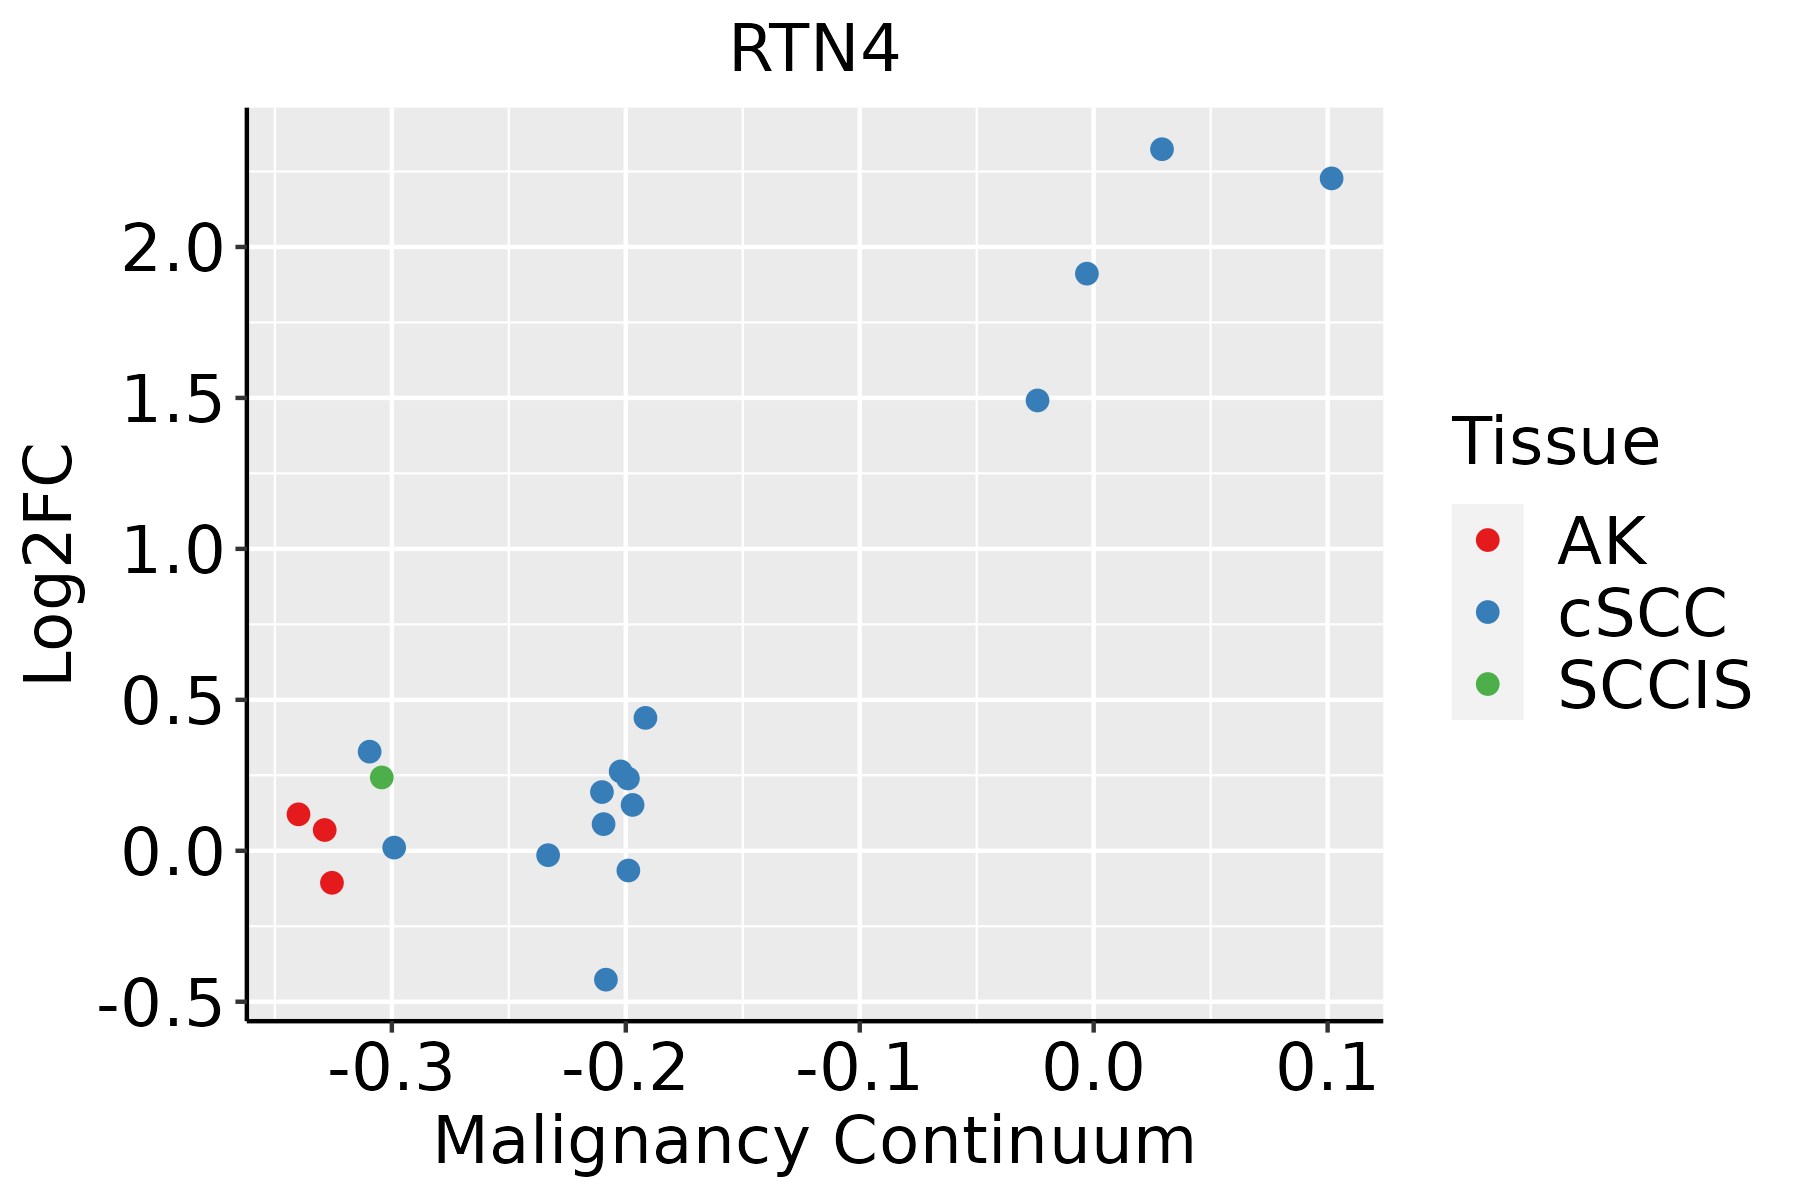 | AK: Actinic keratosis |
| cSCC: Cutaneous squamous cell carcinoma | ||
| SCCIS:squamous cell carcinoma in situ | ||
| Thyroid |  | ATC: Anaplastic thyroid cancer |
| HT: Hashimoto's thyroiditis | ||
| PTC: Papillary thyroid cancer |
| ∗log2FC in expression of this searched gene in stem-like cells from each diseased tissue sample relative to stem-like cells in normal samples in each tissue plotted against the malignancy continuum. Samples are colored based on if they are from different disease stage. |
Top |
Malignant transformation related pathway analysis |
| Find out the enriched GO biological processes and KEGG pathways involved in transition from healthy to precancer to cancer |
| Tissue | Disease Stage | Enriched GO biological Processes |
| Colorectum | AD |  |
| Colorectum | SER |  |
| Colorectum | MSS |  |
| Colorectum | MSI-H |  |
| Colorectum | FAP |  |
| ∗Top 15 enriched GO BP terms are showed in the bar plot of each disease state in each tissue. Each row represents a significant GO biological process which is colored according to the -log10(p.adjust). |
| Page: 1 2 3 4 5 6 7 8 9 |
| GO ID | Tissue | Disease Stage | Description | Gene Ratio | Bg Ratio | pvalue | p.adjust | Count |
| GO:00508219 | Breast | Precancer | protein stabilization | 29/1080 | 191/18723 | 1.67e-06 | 6.08e-05 | 29 |
| GO:00316479 | Breast | Precancer | regulation of protein stability | 38/1080 | 298/18723 | 3.73e-06 | 1.19e-04 | 38 |
| GO:00487329 | Breast | Precancer | gland development | 49/1080 | 436/18723 | 6.11e-06 | 1.73e-04 | 49 |
| GO:00709725 | Breast | Precancer | protein localization to endoplasmic reticulum | 15/1080 | 74/18723 | 1.74e-05 | 4.17e-04 | 15 |
| GO:00106348 | Breast | Precancer | positive regulation of epithelial cell migration | 25/1080 | 176/18723 | 2.75e-05 | 6.21e-04 | 25 |
| GO:00106319 | Breast | Precancer | epithelial cell migration | 40/1080 | 357/18723 | 4.57e-05 | 9.71e-04 | 40 |
| GO:00901329 | Breast | Precancer | epithelium migration | 40/1080 | 360/18723 | 5.51e-05 | 1.14e-03 | 40 |
| GO:00506736 | Breast | Precancer | epithelial cell proliferation | 46/1080 | 437/18723 | 6.02e-05 | 1.23e-03 | 46 |
| GO:00335983 | Breast | Precancer | mammary gland epithelial cell proliferation | 8/1080 | 26/18723 | 7.33e-05 | 1.44e-03 | 8 |
| GO:00901309 | Breast | Precancer | tissue migration | 40/1080 | 365/18723 | 7.48e-05 | 1.47e-03 | 40 |
| GO:00106329 | Breast | Precancer | regulation of epithelial cell migration | 33/1080 | 292/18723 | 1.74e-04 | 2.86e-03 | 33 |
| GO:00506786 | Breast | Precancer | regulation of epithelial cell proliferation | 40/1080 | 381/18723 | 1.88e-04 | 3.03e-03 | 40 |
| GO:00016678 | Breast | Precancer | ameboidal-type cell migration | 47/1080 | 475/18723 | 2.19e-04 | 3.35e-03 | 47 |
| GO:00420633 | Breast | Precancer | gliogenesis | 33/1080 | 301/18723 | 3.06e-04 | 4.40e-03 | 33 |
| GO:00160497 | Breast | Precancer | cell growth | 46/1080 | 482/18723 | 5.63e-04 | 7.16e-03 | 46 |
| GO:19038299 | Breast | Precancer | positive regulation of cellular protein localization | 30/1080 | 276/18723 | 6.48e-04 | 7.99e-03 | 30 |
| GO:00506793 | Breast | Precancer | positive regulation of epithelial cell proliferation | 24/1080 | 207/18723 | 8.88e-04 | 1.02e-02 | 24 |
| GO:00018373 | Breast | Precancer | epithelial to mesenchymal transition | 19/1080 | 157/18723 | 1.78e-03 | 1.75e-02 | 19 |
| GO:00015587 | Breast | Precancer | regulation of cell growth | 39/1080 | 414/18723 | 1.81e-03 | 1.78e-02 | 39 |
| GO:00017017 | Breast | Precancer | in utero embryonic development | 35/1080 | 367/18723 | 2.47e-03 | 2.27e-02 | 35 |
| Page: 1 2 3 4 5 6 7 8 9 10 11 12 13 14 15 16 17 18 19 20 21 22 23 24 25 26 27 28 29 30 31 32 33 34 35 36 37 38 39 40 41 42 43 44 45 46 47 48 49 50 51 52 53 54 55 56 57 |
| Pathway ID | Tissue | Disease Stage | Description | Gene Ratio | Bg Ratio | pvalue | p.adjust | qvalue | Count |
| hsa0501016 | Breast | Precancer | Alzheimer disease | 103/684 | 384/8465 | 1.03e-29 | 4.66e-28 | 3.57e-28 | 103 |
| hsa0501017 | Breast | Precancer | Alzheimer disease | 103/684 | 384/8465 | 1.03e-29 | 4.66e-28 | 3.57e-28 | 103 |
| hsa0501023 | Breast | IDC | Alzheimer disease | 107/867 | 384/8465 | 1.70e-23 | 7.88e-22 | 5.90e-22 | 107 |
| hsa0501033 | Breast | IDC | Alzheimer disease | 107/867 | 384/8465 | 1.70e-23 | 7.88e-22 | 5.90e-22 | 107 |
| hsa0501043 | Breast | DCIS | Alzheimer disease | 105/846 | 384/8465 | 3.23e-23 | 1.49e-21 | 1.10e-21 | 105 |
| hsa0501053 | Breast | DCIS | Alzheimer disease | 105/846 | 384/8465 | 3.23e-23 | 1.49e-21 | 1.10e-21 | 105 |
| hsa0501018 | Cervix | CC | Alzheimer disease | 113/1267 | 384/8465 | 9.67e-14 | 3.92e-12 | 2.32e-12 | 113 |
| hsa0501019 | Cervix | CC | Alzheimer disease | 113/1267 | 384/8465 | 9.67e-14 | 3.92e-12 | 2.32e-12 | 113 |
| hsa0501044 | Cervix | N_HPV | Alzheimer disease | 41/349 | 384/8465 | 1.50e-08 | 3.13e-07 | 2.45e-07 | 41 |
| hsa0501054 | Cervix | N_HPV | Alzheimer disease | 41/349 | 384/8465 | 1.50e-08 | 3.13e-07 | 2.45e-07 | 41 |
| hsa05010 | Colorectum | AD | Alzheimer disease | 174/2092 | 384/8465 | 1.82e-19 | 9.26e-18 | 5.91e-18 | 174 |
| hsa050101 | Colorectum | AD | Alzheimer disease | 174/2092 | 384/8465 | 1.82e-19 | 9.26e-18 | 5.91e-18 | 174 |
| hsa050104 | Colorectum | MSS | Alzheimer disease | 169/1875 | 384/8465 | 1.21e-22 | 1.01e-20 | 6.21e-21 | 169 |
| hsa050105 | Colorectum | MSS | Alzheimer disease | 169/1875 | 384/8465 | 1.21e-22 | 1.01e-20 | 6.21e-21 | 169 |
| hsa050108 | Colorectum | FAP | Alzheimer disease | 105/1404 | 384/8465 | 3.74e-08 | 1.04e-06 | 6.33e-07 | 105 |
| hsa050109 | Colorectum | FAP | Alzheimer disease | 105/1404 | 384/8465 | 3.74e-08 | 1.04e-06 | 6.33e-07 | 105 |
| hsa0501020 | Endometrium | AEH | Alzheimer disease | 124/1197 | 384/8465 | 1.20e-20 | 3.91e-19 | 2.86e-19 | 124 |
| hsa05010110 | Endometrium | AEH | Alzheimer disease | 124/1197 | 384/8465 | 1.20e-20 | 3.91e-19 | 2.86e-19 | 124 |
| hsa0501025 | Endometrium | EEC | Alzheimer disease | 126/1237 | 384/8465 | 2.25e-20 | 7.40e-19 | 5.52e-19 | 126 |
| hsa0501035 | Endometrium | EEC | Alzheimer disease | 126/1237 | 384/8465 | 2.25e-20 | 7.40e-19 | 5.52e-19 | 126 |
| Page: 1 2 |
Top |
Cell-cell communication analysis |
| Identification of potential cell-cell interactions between two cell types and their ligand-receptor pairs for different disease states |
| Ligand | Receptor | LRpair | Pathway | Tissue | Disease Stage |
| Page: 1 |
Top |
Single-cell gene regulatory network inference analysis |
| Find out the significant the regulons (TFs) and the target genes of each regulon across cell types for different disease states |
| TF | Cell Type | Tissue | Disease Stage | Target Gene | RSS | Regulon Activity |
| ∗The dot plots of a searched regulon are shown for all cell subpopulations in each disease state of each tissue based on the regulon specific score inferred using pySCENIC and by calculating the average expression. |
| Page: 1 |
Top |
Somatic mutation of malignant transformation related genes |
| Annotation of somatic variants for genes involved in malignant transformation |
| Hugo Symbol | Variant Class | Variant Classification | dbSNP RS | HGVSc | HGVSp | HGVSp Short | SWISSPROT | BIOTYPE | SIFT | PolyPhen | Tumor Sample Barcode | Tissue | Histology | Sex | Age | Stage | Therapy Types | Drugs | Outcome |
| RTN4 | SNV | Missense_Mutation | c.1778C>A | p.Ala593Glu | p.A593E | Q9NQC3 | protein_coding | deleterious(0.01) | benign(0.273) | TCGA-A1-A0SO-01 | Breast | breast invasive carcinoma | Female | >=65 | I/II | Chemotherapy | SD | ||
| RTN4 | SNV | Missense_Mutation | c.1574C>T | p.Ser525Phe | p.S525F | Q9NQC3 | protein_coding | deleterious(0) | benign(0.343) | TCGA-AN-A041-01 | Breast | breast invasive carcinoma | Female | <65 | I/II | Unknown | Unknown | SD | |
| RTN4 | SNV | Missense_Mutation | c.3296N>G | p.Val1099Gly | p.V1099G | Q9NQC3 | protein_coding | deleterious(0) | probably_damaging(0.994) | TCGA-AO-A03T-01 | Breast | breast invasive carcinoma | Female | <65 | I/II | Chemotherapy | cyclophosphamide | SD | |
| RTN4 | SNV | Missense_Mutation | c.3359N>C | p.Lys1120Thr | p.K1120T | Q9NQC3 | protein_coding | deleterious(0) | probably_damaging(0.999) | TCGA-AO-A128-01 | Breast | breast invasive carcinoma | Female | <65 | I/II | Chemotherapy | doxorubicin | SD | |
| RTN4 | SNV | Missense_Mutation | c.1960N>A | p.Glu654Lys | p.E654K | Q9NQC3 | protein_coding | deleterious(0) | probably_damaging(0.985) | TCGA-E2-A1IN-01 | Breast | breast invasive carcinoma | Female | <65 | I/II | Hormone Therapy | arimidex | SD | |
| RTN4 | SNV | Missense_Mutation | c.2798N>C | p.Ser933Thr | p.S933T | Q9NQC3 | protein_coding | tolerated(0.33) | benign(0.015) | TCGA-E9-A244-01 | Breast | breast invasive carcinoma | Female | <65 | I/II | Chemotherapy | cyclophosphamide | SD | |
| RTN4 | SNV | Missense_Mutation | c.1261N>C | p.Asp421His | p.D421H | Q9NQC3 | protein_coding | deleterious(0.01) | probably_damaging(0.915) | TCGA-GM-A2DB-01 | Breast | breast invasive carcinoma | Female | <65 | I/II | Chemotherapy | taxol | CR | |
| RTN4 | insertion | Frame_Shift_Ins | novel | c.3048_3049insGTATCACCAGAGGTAAGAGAGCATTGCAGATTGGGAAAACCAT | p.Thr1017ValfsTer53 | p.T1017Vfs*53 | Q9NQC3 | protein_coding | TCGA-A8-A0A4-01 | Breast | breast invasive carcinoma | Female | >=65 | I/II | Hormone Therapy | tamoxiphen | CR | ||
| RTN4 | insertion | In_Frame_Ins | novel | c.2685_2686insTATAAACATAATATAAAA | p.Ser895_His896insTyrLysHisAsnIleLys | p.S895_H896insYKHNIK | Q9NQC3 | protein_coding | TCGA-AR-A0U2-01 | Breast | breast invasive carcinoma | Female | <65 | III/IV | Hormone Therapy | tamoxiphen | PD | ||
| RTN4 | SNV | Missense_Mutation | novel | c.1315N>C | p.Glu439Gln | p.E439Q | Q9NQC3 | protein_coding | deleterious(0) | probably_damaging(0.946) | TCGA-C5-A1MH-01 | Cervix | cervical & endocervical cancer | Female | >=65 | III/IV | Chemotherapy | cisplatin | PD |
| Page: 1 2 3 4 5 6 7 8 9 10 11 12 |
Top |
Related drugs of malignant transformation related genes |
| Identification of chemicals and drugs interact with genes involved in malignant transfromation |
| (DGIdb 4.0) |
| Entrez ID | Symbol | Category | Interaction Types | Drug Claim Name | Drug Name | PMIDs |
| 57142 | RTN4 | DRUGGABLE GENOME | HYPERBARIC OXYGEN | 12951059 | ||
| 57142 | RTN4 | DRUGGABLE GENOME | inhibitor | CHEMBL2108679 | OZANEZUMAB | |
| 57142 | RTN4 | DRUGGABLE GENOME | ATI-355 | ATINUMAB | 22544872 | |
| 57142 | RTN4 | DRUGGABLE GENOME | ANTISENSE OLIGONUCLEOTIDES | 14574981 | ||
| 57142 | RTN4 | DRUGGABLE GENOME | antibody | 249565934 | OZANEZUMAB |
| Page: 1 |

Copyright 2023-Present -The University of Texas Health Science Center at Houston |