
|
|||||
|
 | |
| |
| |
| |
| |
| |
|
Gene: RTN3 |
Gene summary for RTN3 |
| Gene information | Species | Human | Gene symbol | RTN3 | Gene ID | 10313 |
| Gene name | reticulon 3 | |
| Gene Alias | ASYIP | |
| Cytomap | 11q13.1 | |
| Gene Type | protein-coding | GO ID | GO:0006518 | UniProtAcc | O95197 |
Top |
Malignant transformation analysis |
| Identification of the aberrant gene expression in precancerous and cancerous lesions by comparing the gene expression of stem-like cells in diseased tissues with normal stem cells |
| Entrez ID | Symbol | Replicates | Species | Organ | Tissue | Adj P-value | Log2FC | Malignancy |
| 10313 | RTN3 | HTA11_3410_2000001011 | Human | Colorectum | AD | 2.40e-03 | -9.09e-02 | 0.0155 |
| 10313 | RTN3 | HTA11_1938_2000001011 | Human | Colorectum | AD | 1.13e-05 | 4.72e-01 | -0.0811 |
| 10313 | RTN3 | HTA11_347_2000001011 | Human | Colorectum | AD | 9.67e-12 | 5.71e-01 | -0.1954 |
| 10313 | RTN3 | HTA11_83_2000001011 | Human | Colorectum | SER | 3.20e-06 | 6.09e-01 | -0.1526 |
| 10313 | RTN3 | HTA11_1391_2000001011 | Human | Colorectum | AD | 4.19e-09 | 6.12e-01 | -0.059 |
| 10313 | RTN3 | HTA11_6801_2000001011 | Human | Colorectum | SER | 1.22e-02 | 3.96e-01 | 0.0171 |
| 10313 | RTN3 | HTA11_99999965062_69753 | Human | Colorectum | MSI-H | 4.54e-05 | 1.04e+00 | 0.3487 |
| 10313 | RTN3 | HTA11_99999974143_84620 | Human | Colorectum | MSS | 7.86e-06 | -3.11e-01 | 0.3005 |
| 10313 | RTN3 | A015-C-203 | Human | Colorectum | FAP | 1.91e-16 | -2.98e-01 | -0.1294 |
| 10313 | RTN3 | A002-C-201 | Human | Colorectum | FAP | 3.28e-05 | -2.73e-01 | 0.0324 |
| 10313 | RTN3 | A001-C-108 | Human | Colorectum | FAP | 1.38e-05 | -1.78e-01 | -0.0272 |
| 10313 | RTN3 | A002-C-205 | Human | Colorectum | FAP | 1.35e-09 | -3.27e-01 | -0.1236 |
| 10313 | RTN3 | A001-C-104 | Human | Colorectum | FAP | 2.10e-02 | -2.03e-01 | 0.0184 |
| 10313 | RTN3 | A015-C-006 | Human | Colorectum | FAP | 1.10e-06 | -2.73e-01 | -0.0994 |
| 10313 | RTN3 | A015-C-106 | Human | Colorectum | FAP | 2.74e-05 | -1.86e-01 | -0.0511 |
| 10313 | RTN3 | A002-C-114 | Human | Colorectum | FAP | 7.48e-06 | -2.75e-01 | -0.1561 |
| 10313 | RTN3 | A015-C-104 | Human | Colorectum | FAP | 1.57e-16 | -2.91e-01 | -0.1899 |
| 10313 | RTN3 | A001-C-014 | Human | Colorectum | FAP | 1.06e-06 | -2.11e-01 | 0.0135 |
| 10313 | RTN3 | A002-C-016 | Human | Colorectum | FAP | 2.54e-10 | -2.19e-01 | 0.0521 |
| 10313 | RTN3 | A015-C-002 | Human | Colorectum | FAP | 1.42e-07 | -4.66e-01 | -0.0763 |
| Page: 1 2 3 4 5 6 7 8 |
| Tissue | Expression Dynamics | Abbreviation |
| Colorectum (GSE201348) |  | FAP: Familial adenomatous polyposis |
| CRC: Colorectal cancer | ||
| Colorectum (HTA11) |  | AD: Adenomas |
| SER: Sessile serrated lesions | ||
| MSI-H: Microsatellite-high colorectal cancer | ||
| MSS: Microsatellite stable colorectal cancer | ||
| Esophagus | 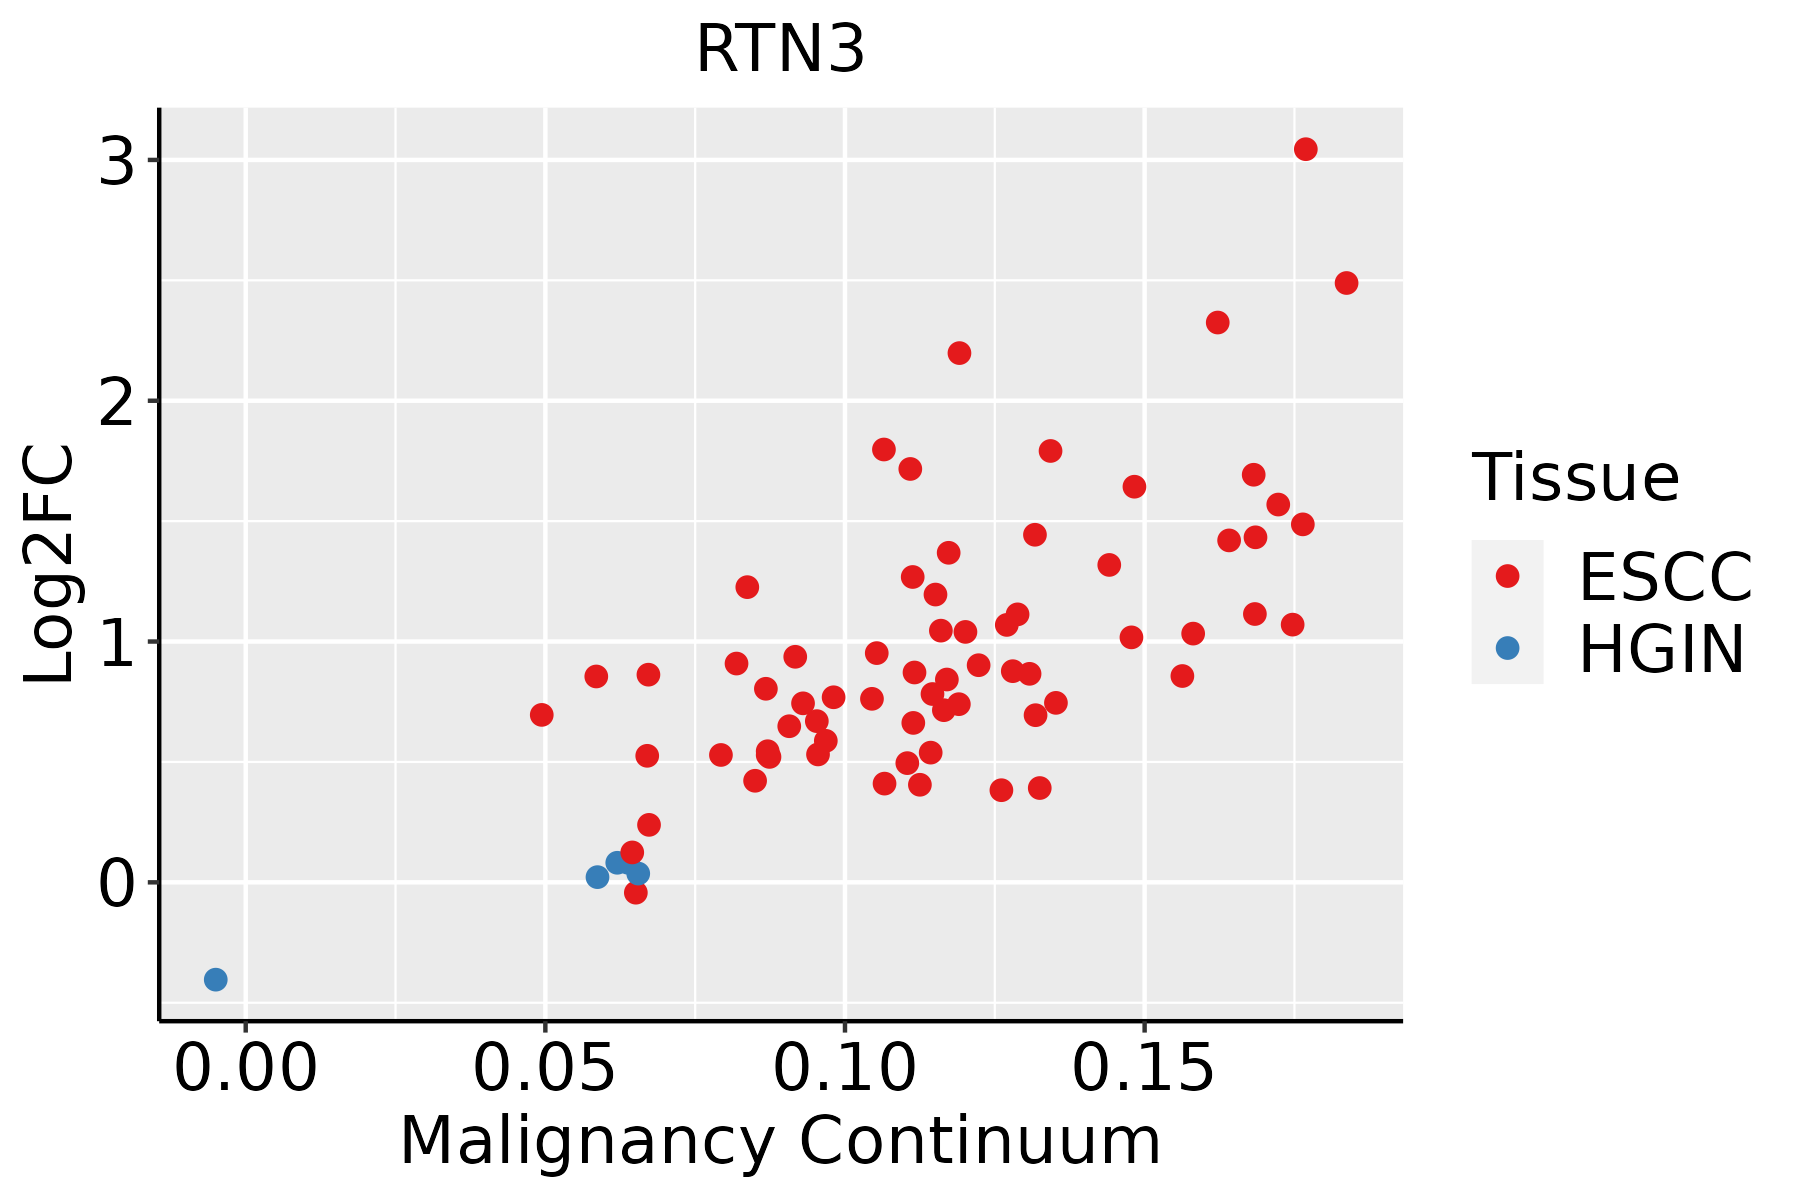 | ESCC: Esophageal squamous cell carcinoma |
| HGIN: High-grade intraepithelial neoplasias | ||
| LGIN: Low-grade intraepithelial neoplasias | ||
| Liver | 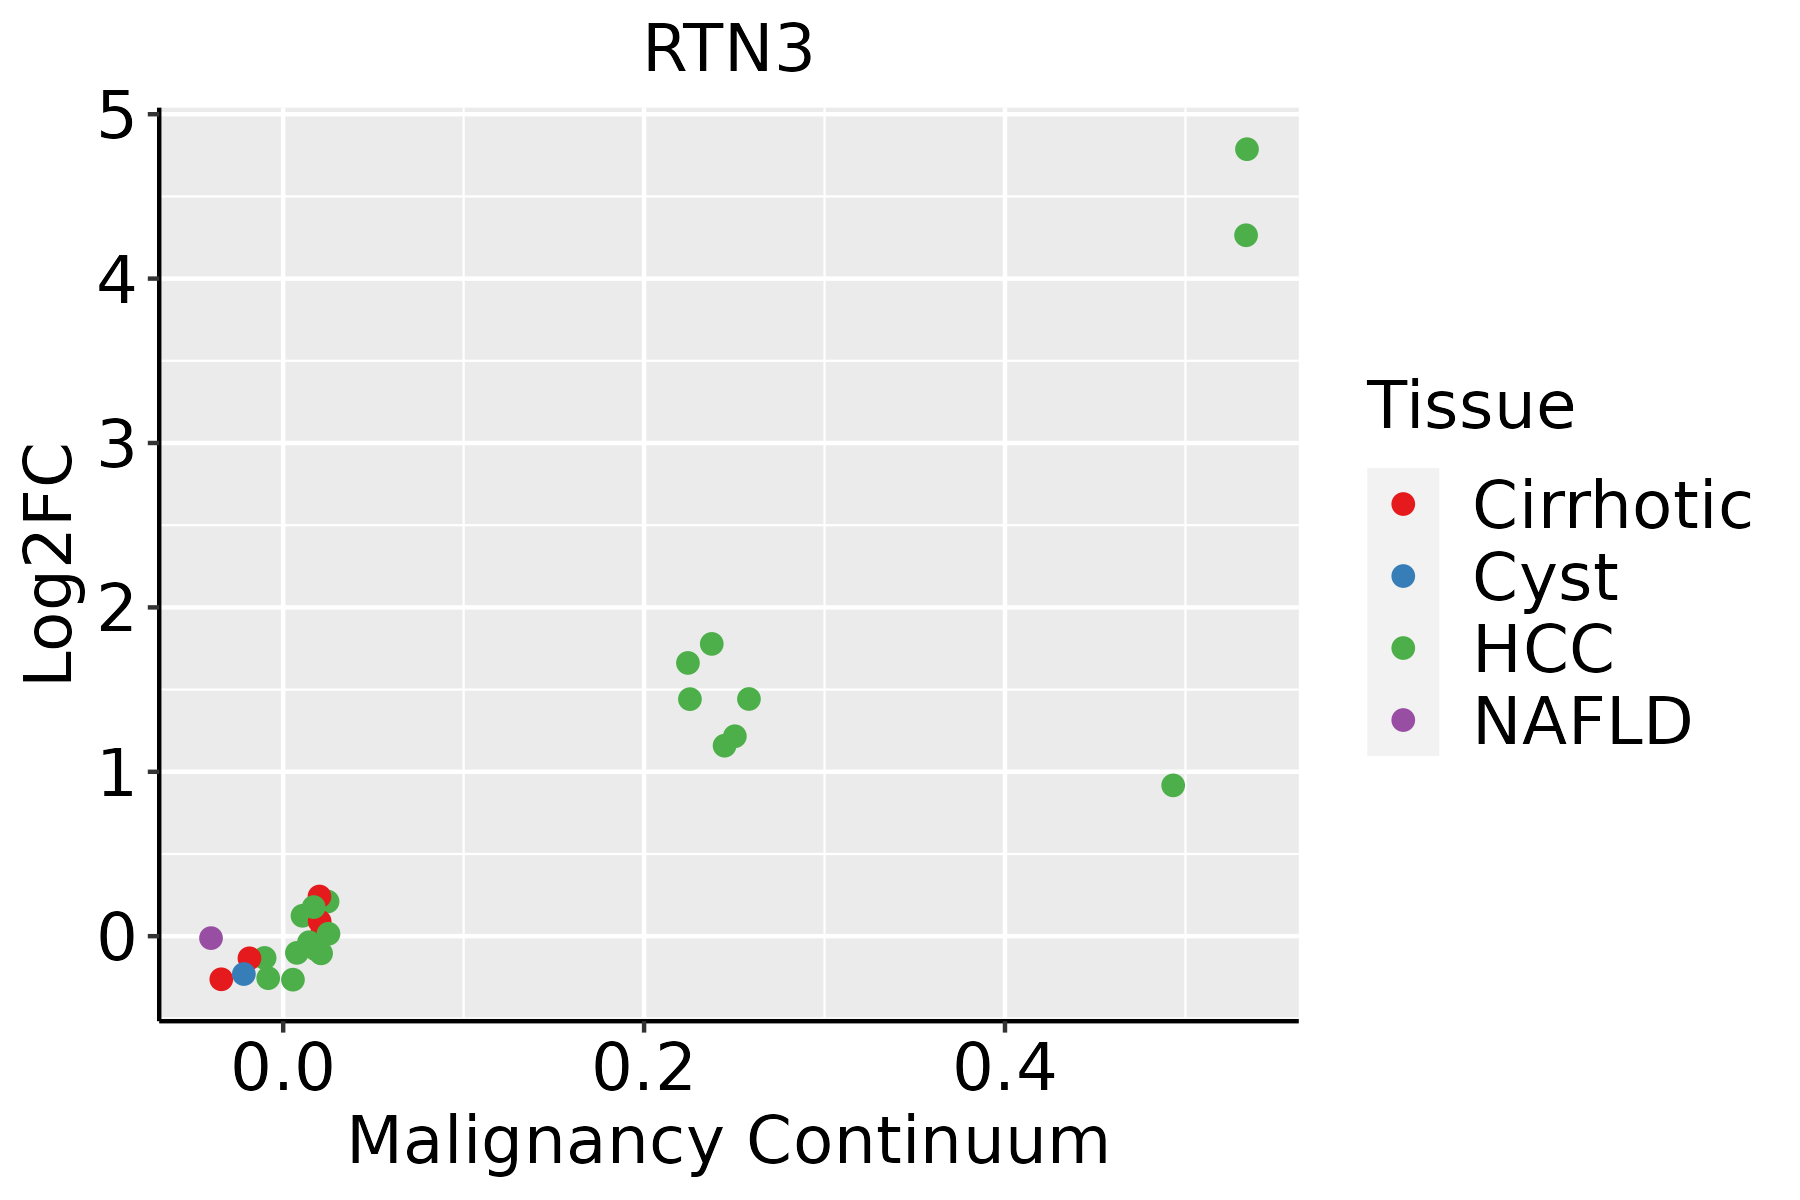 | HCC: Hepatocellular carcinoma |
| NAFLD: Non-alcoholic fatty liver disease | ||
| Oral Cavity | 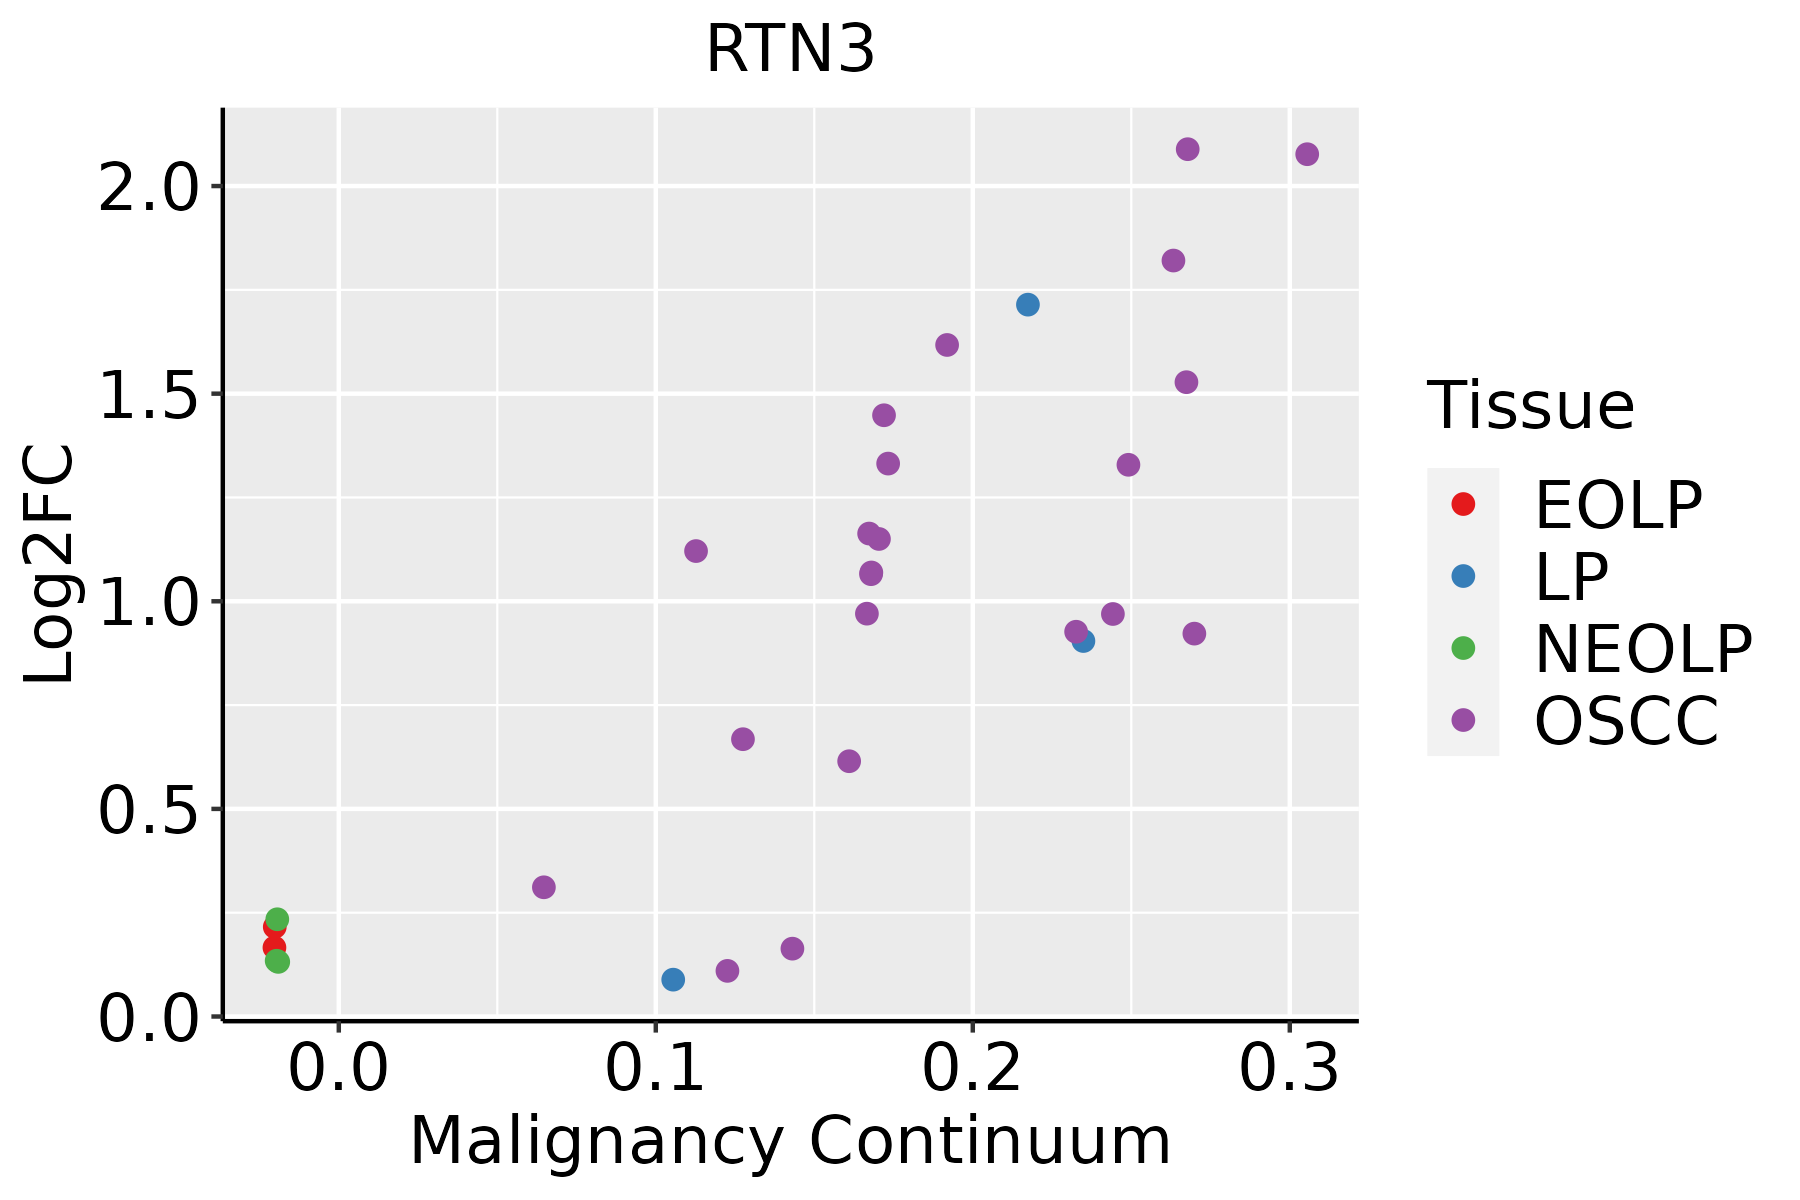 | EOLP: Erosive Oral lichen planus |
| LP: leukoplakia | ||
| NEOLP: Non-erosive oral lichen planus | ||
| OSCC: Oral squamous cell carcinoma | ||
| Skin | 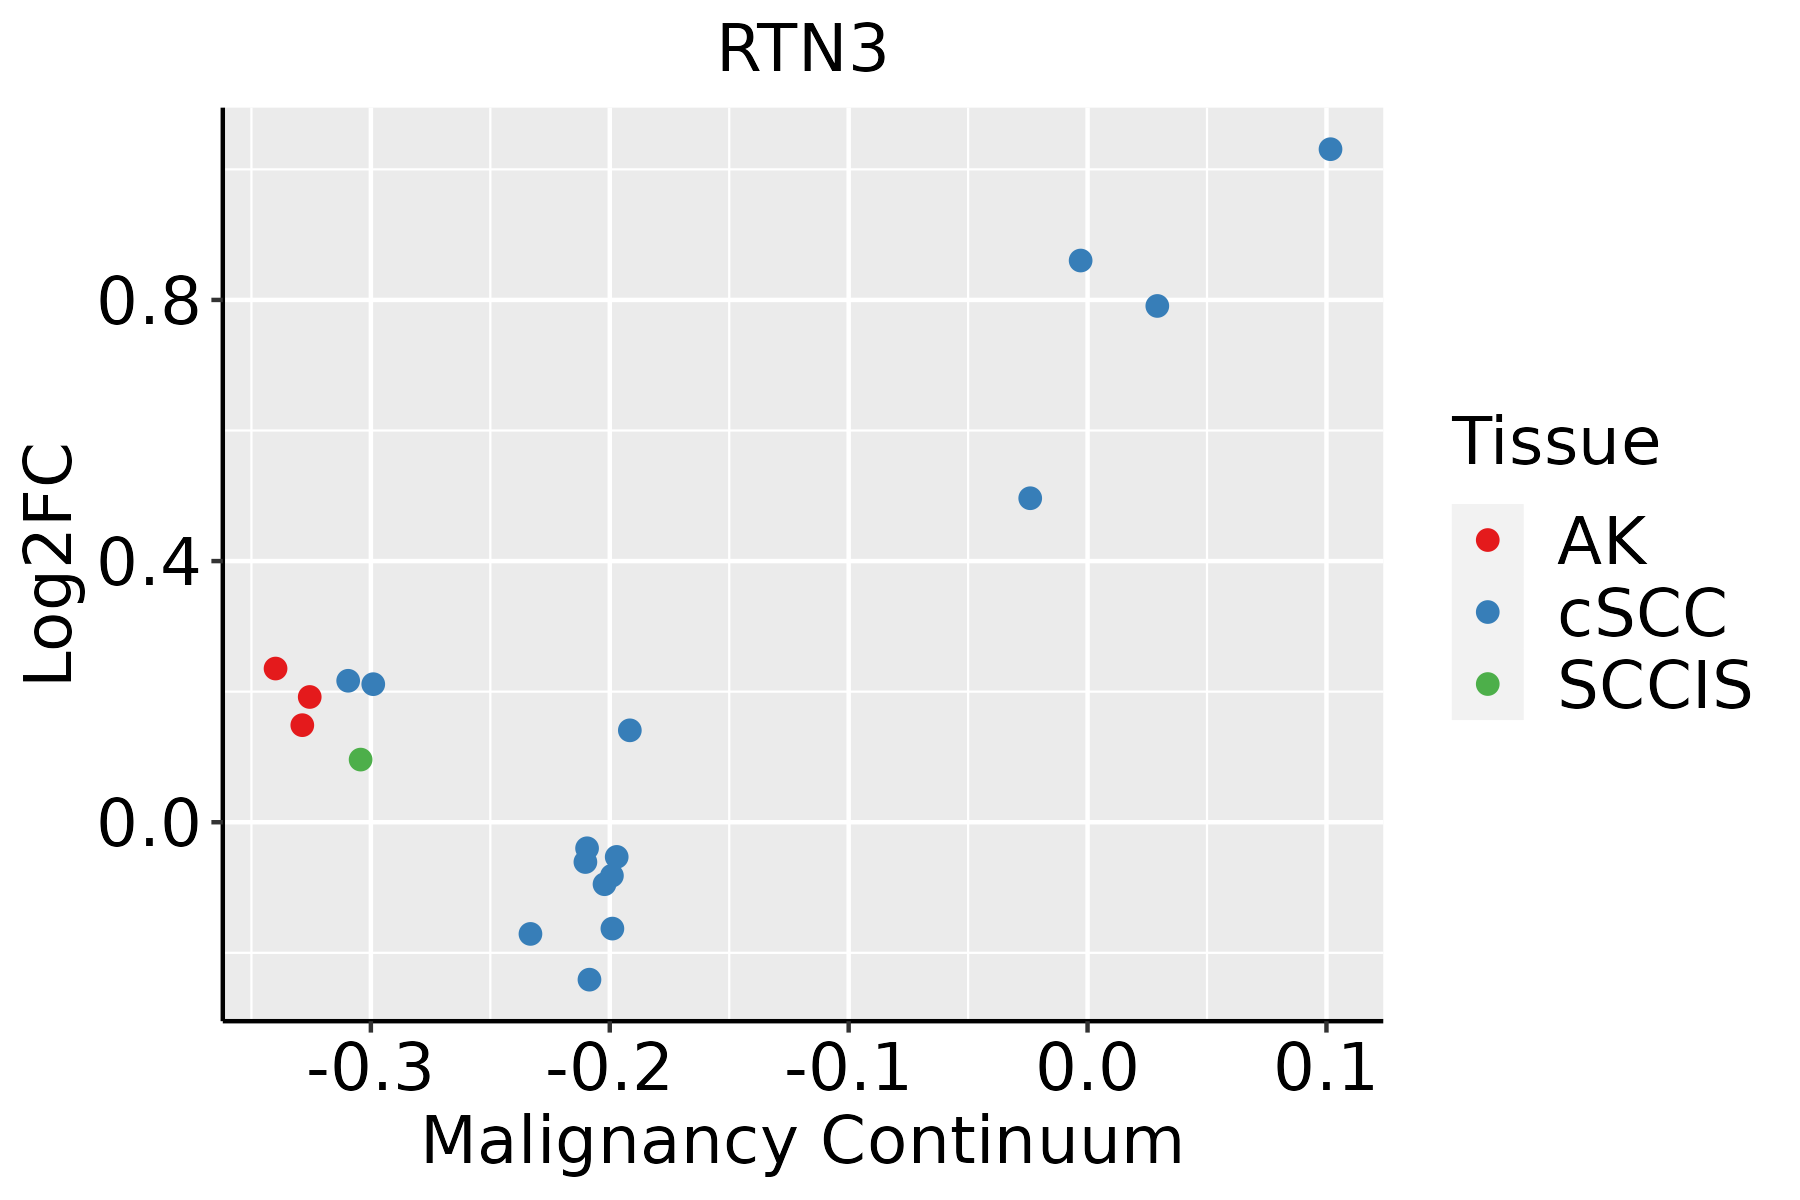 | AK: Actinic keratosis |
| cSCC: Cutaneous squamous cell carcinoma | ||
| SCCIS:squamous cell carcinoma in situ | ||
| Thyroid | 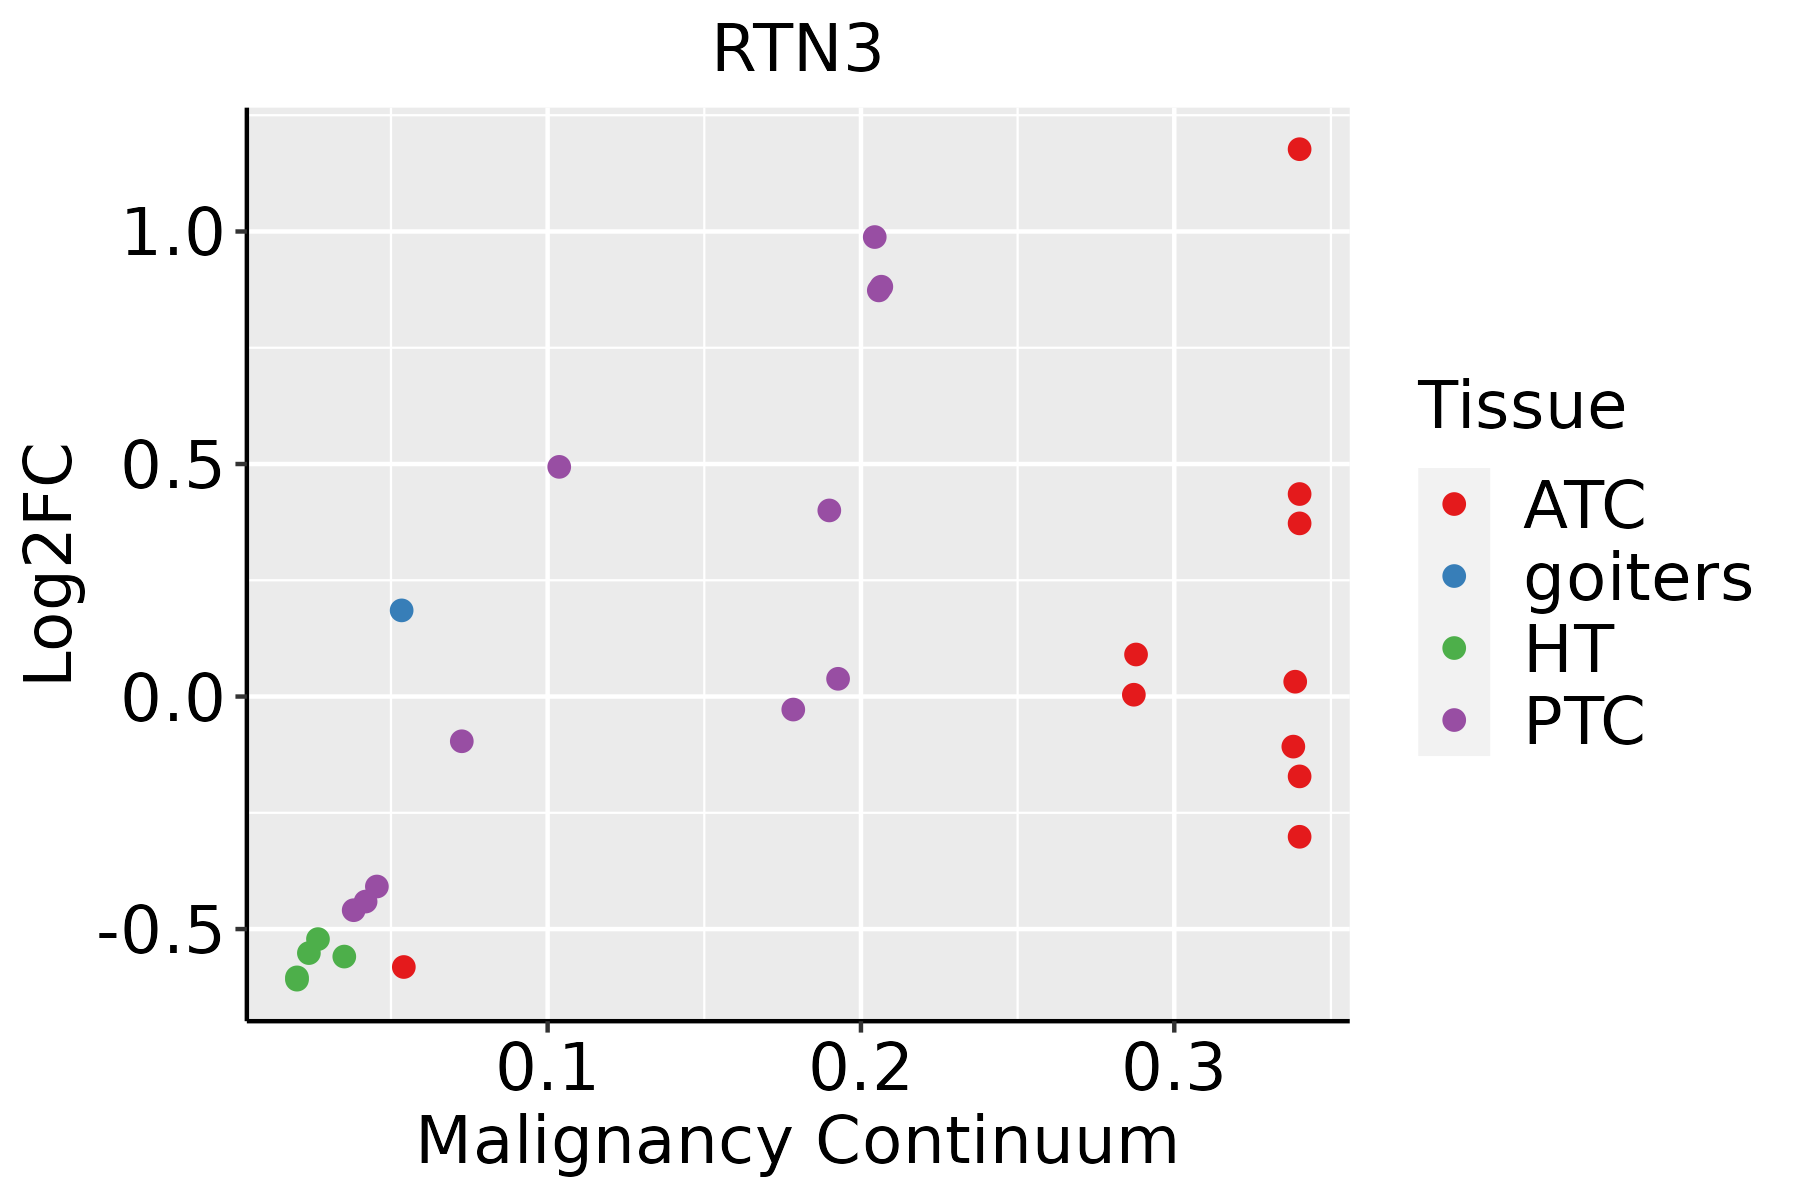 | ATC: Anaplastic thyroid cancer |
| HT: Hashimoto's thyroiditis | ||
| PTC: Papillary thyroid cancer |
| ∗log2FC in expression of this searched gene in stem-like cells from each diseased tissue sample relative to stem-like cells in normal samples in each tissue plotted against the malignancy continuum. Samples are colored based on if they are from different disease stage. |
Top |
Malignant transformation related pathway analysis |
| Find out the enriched GO biological processes and KEGG pathways involved in transition from healthy to precancer to cancer |
| Tissue | Disease Stage | Enriched GO biological Processes |
| Colorectum | AD |  |
| Colorectum | SER |  |
| Colorectum | MSS |  |
| Colorectum | MSI-H |  |
| Colorectum | FAP |  |
| ∗Top 15 enriched GO BP terms are showed in the bar plot of each disease state in each tissue. Each row represents a significant GO biological process which is colored according to the -log10(p.adjust). |
| Page: 1 2 3 4 5 6 7 8 9 |
| GO ID | Tissue | Disease Stage | Description | Gene Ratio | Bg Ratio | pvalue | p.adjust | Count |
| GO:0007029 | Colorectum | AD | endoplasmic reticulum organization | 31/3918 | 87/18723 | 1.08e-03 | 1.00e-02 | 31 |
| GO:0071786 | Colorectum | AD | endoplasmic reticulum tubular network organization | 9/3918 | 18/18723 | 5.82e-03 | 3.67e-02 | 9 |
| GO:00070291 | Colorectum | SER | endoplasmic reticulum organization | 23/2897 | 87/18723 | 5.77e-03 | 4.23e-02 | 23 |
| GO:0034249 | Colorectum | MSS | negative regulation of cellular amide metabolic process | 70/3467 | 273/18723 | 2.07e-03 | 1.76e-02 | 70 |
| GO:0050435 | Colorectum | MSS | amyloid-beta metabolic process | 21/3467 | 67/18723 | 7.90e-03 | 4.84e-02 | 21 |
| GO:00342491 | Colorectum | FAP | negative regulation of cellular amide metabolic process | 54/2622 | 273/18723 | 5.00e-03 | 3.33e-02 | 54 |
| GO:00342492 | Colorectum | CRC | negative regulation of cellular amide metabolic process | 45/2078 | 273/18723 | 4.35e-03 | 3.47e-02 | 45 |
| GO:000702914 | Esophagus | ESCC | endoplasmic reticulum organization | 65/8552 | 87/18723 | 3.28e-08 | 6.08e-07 | 65 |
| GO:00717865 | Esophagus | ESCC | endoplasmic reticulum tubular network organization | 15/8552 | 18/18723 | 1.20e-03 | 5.88e-03 | 15 |
| GO:003424914 | Esophagus | ESCC | negative regulation of cellular amide metabolic process | 144/8552 | 273/18723 | 1.08e-02 | 3.67e-02 | 144 |
| GO:00070292 | Liver | Cirrhotic | endoplasmic reticulum organization | 42/4634 | 87/18723 | 1.67e-06 | 3.22e-05 | 42 |
| GO:003424911 | Liver | Cirrhotic | negative regulation of cellular amide metabolic process | 100/4634 | 273/18723 | 7.34e-06 | 1.13e-04 | 100 |
| GO:00717861 | Liver | Cirrhotic | endoplasmic reticulum tubular network organization | 11/4634 | 18/18723 | 1.13e-03 | 7.73e-03 | 11 |
| GO:000702911 | Liver | HCC | endoplasmic reticulum organization | 64/7958 | 87/18723 | 3.92e-09 | 1.04e-07 | 64 |
| GO:003424921 | Liver | HCC | negative regulation of cellular amide metabolic process | 144/7958 | 273/18723 | 3.80e-04 | 2.61e-03 | 144 |
| GO:00717862 | Liver | HCC | endoplasmic reticulum tubular network organization | 15/7958 | 18/18723 | 4.74e-04 | 3.12e-03 | 15 |
| GO:00070294 | Oral cavity | OSCC | endoplasmic reticulum organization | 58/7305 | 87/18723 | 1.59e-07 | 2.61e-06 | 58 |
| GO:00429873 | Oral cavity | OSCC | amyloid precursor protein catabolic process | 40/7305 | 68/18723 | 7.28e-04 | 3.98e-03 | 40 |
| GO:00717864 | Oral cavity | OSCC | endoplasmic reticulum tubular network organization | 14/7305 | 18/18723 | 9.51e-04 | 4.96e-03 | 14 |
| GO:00429823 | Oral cavity | OSCC | amyloid precursor protein metabolic process | 52/7305 | 95/18723 | 1.33e-03 | 6.62e-03 | 52 |
| Page: 1 2 3 |
| Pathway ID | Tissue | Disease Stage | Description | Gene Ratio | Bg Ratio | pvalue | p.adjust | qvalue | Count |
| hsa05010 | Colorectum | AD | Alzheimer disease | 174/2092 | 384/8465 | 1.82e-19 | 9.26e-18 | 5.91e-18 | 174 |
| hsa050101 | Colorectum | AD | Alzheimer disease | 174/2092 | 384/8465 | 1.82e-19 | 9.26e-18 | 5.91e-18 | 174 |
| hsa050102 | Colorectum | SER | Alzheimer disease | 146/1580 | 384/8465 | 6.52e-20 | 2.40e-18 | 1.75e-18 | 146 |
| hsa050103 | Colorectum | SER | Alzheimer disease | 146/1580 | 384/8465 | 6.52e-20 | 2.40e-18 | 1.75e-18 | 146 |
| hsa050106 | Colorectum | MSI-H | Alzheimer disease | 91/797 | 384/8465 | 1.76e-17 | 6.41e-16 | 5.37e-16 | 91 |
| hsa050107 | Colorectum | MSI-H | Alzheimer disease | 91/797 | 384/8465 | 1.76e-17 | 6.41e-16 | 5.37e-16 | 91 |
| hsa050108 | Colorectum | FAP | Alzheimer disease | 105/1404 | 384/8465 | 3.74e-08 | 1.04e-06 | 6.33e-07 | 105 |
| hsa050109 | Colorectum | FAP | Alzheimer disease | 105/1404 | 384/8465 | 3.74e-08 | 1.04e-06 | 6.33e-07 | 105 |
| hsa05010210 | Esophagus | ESCC | Alzheimer disease | 263/4205 | 384/8465 | 1.80e-14 | 5.47e-13 | 2.80e-13 | 263 |
| hsa0501038 | Esophagus | ESCC | Alzheimer disease | 263/4205 | 384/8465 | 1.80e-14 | 5.47e-13 | 2.80e-13 | 263 |
| hsa0501014 | Liver | Cirrhotic | Alzheimer disease | 180/2530 | 384/8465 | 5.52e-13 | 1.36e-11 | 8.36e-12 | 180 |
| hsa0501015 | Liver | Cirrhotic | Alzheimer disease | 180/2530 | 384/8465 | 5.52e-13 | 1.36e-11 | 8.36e-12 | 180 |
| hsa0501022 | Liver | HCC | Alzheimer disease | 254/4020 | 384/8465 | 3.75e-14 | 8.97e-13 | 4.99e-13 | 254 |
| hsa0501032 | Liver | HCC | Alzheimer disease | 254/4020 | 384/8465 | 3.75e-14 | 8.97e-13 | 4.99e-13 | 254 |
| hsa0501028 | Oral cavity | OSCC | Alzheimer disease | 244/3704 | 384/8465 | 1.18e-15 | 3.60e-14 | 1.83e-14 | 244 |
| hsa05010112 | Oral cavity | OSCC | Alzheimer disease | 244/3704 | 384/8465 | 1.18e-15 | 3.60e-14 | 1.83e-14 | 244 |
| hsa0501029 | Oral cavity | LP | Alzheimer disease | 197/2418 | 384/8465 | 6.66e-22 | 3.69e-20 | 2.38e-20 | 197 |
| hsa0501037 | Oral cavity | LP | Alzheimer disease | 197/2418 | 384/8465 | 6.66e-22 | 3.69e-20 | 2.38e-20 | 197 |
| hsa0501062 | Oral cavity | NEOLP | Alzheimer disease | 97/1112 | 384/8465 | 3.97e-11 | 1.57e-09 | 9.89e-10 | 97 |
| hsa0501072 | Oral cavity | NEOLP | Alzheimer disease | 97/1112 | 384/8465 | 3.97e-11 | 1.57e-09 | 9.89e-10 | 97 |
| Page: 1 |
Top |
Cell-cell communication analysis |
| Identification of potential cell-cell interactions between two cell types and their ligand-receptor pairs for different disease states |
| Ligand | Receptor | LRpair | Pathway | Tissue | Disease Stage |
| Page: 1 |
Top |
Single-cell gene regulatory network inference analysis |
| Find out the significant the regulons (TFs) and the target genes of each regulon across cell types for different disease states |
| TF | Cell Type | Tissue | Disease Stage | Target Gene | RSS | Regulon Activity |
| ∗The dot plots of a searched regulon are shown for all cell subpopulations in each disease state of each tissue based on the regulon specific score inferred using pySCENIC and by calculating the average expression. |
| Page: 1 |
Top |
Somatic mutation of malignant transformation related genes |
| Annotation of somatic variants for genes involved in malignant transformation |
| Hugo Symbol | Variant Class | Variant Classification | dbSNP RS | HGVSc | HGVSp | HGVSp Short | SWISSPROT | BIOTYPE | SIFT | PolyPhen | Tumor Sample Barcode | Tissue | Histology | Sex | Age | Stage | Therapy Types | Drugs | Outcome |
| RTN3 | SNV | Missense_Mutation | novel | c.1316A>G | p.Asn439Ser | p.N439S | O95197 | protein_coding | tolerated(1) | benign(0.001) | TCGA-A7-A3IY-01 | Breast | breast invasive carcinoma | Female | >=65 | I/II | Hormone Therapy | anastrozole | SD |
| RTN3 | SNV | Missense_Mutation | novel | c.1435N>C | p.Asp479His | p.D479H | O95197 | protein_coding | deleterious(0.03) | possibly_damaging(0.72) | TCGA-A7-A4SE-01 | Breast | breast invasive carcinoma | Female | <65 | I/II | Chemotherapy | adriamycin | CR |
| RTN3 | SNV | Missense_Mutation | rs375692793 | c.1012N>A | p.Glu338Lys | p.E338K | O95197 | protein_coding | deleterious(0) | probably_damaging(0.986) | TCGA-AN-A046-01 | Breast | breast invasive carcinoma | Female | >=65 | I/II | Unknown | Unknown | SD |
| RTN3 | SNV | Missense_Mutation | c.1621N>C | p.Glu541Gln | p.E541Q | O95197 | protein_coding | deleterious(0.02) | benign(0.216) | TCGA-BH-A208-01 | Breast | breast invasive carcinoma | Female | <65 | I/II | Unknown | Unknown | SD | |
| RTN3 | SNV | Missense_Mutation | c.3080C>T | p.Ala1027Val | p.A1027V | O95197 | protein_coding | tolerated(0.16) | benign(0.396) | TCGA-E9-A229-01 | Breast | breast invasive carcinoma | Female | <65 | I/II | Chemotherapy | 5-fluorouracil | SD | |
| RTN3 | insertion | Nonsense_Mutation | novel | c.3007_3008insCTGGCTAACACGGTGAAACCCCGTCTCTACTAAAAATATAAA | p.His1003delinsProGlyTerHisGlyGluThrProSerLeuLeuLysIleTerAsn | p.H1003delinsPG*HGETPSLLKI*N | O95197 | protein_coding | TCGA-B6-A0I6-01 | Breast | breast invasive carcinoma | Female | <65 | I/II | Unknown | Unknown | PD | ||
| RTN3 | SNV | Missense_Mutation | rs770372955 | c.464N>A | p.Arg155His | p.R155H | O95197 | protein_coding | tolerated(0.57) | benign(0.001) | TCGA-2W-A8YY-01 | Cervix | cervical & endocervical cancer | Female | <65 | I/II | Chemotherapy | cisplatin | CR |
| RTN3 | SNV | Missense_Mutation | novel | c.1420N>A | p.Asp474Asn | p.D474N | O95197 | protein_coding | tolerated(0.06) | benign(0.153) | TCGA-C5-A1BJ-01 | Cervix | cervical & endocervical cancer | Female | <65 | I/II | Unknown | Unknown | SD |
| RTN3 | SNV | Missense_Mutation | novel | c.2120N>C | p.Gly707Ala | p.G707A | O95197 | protein_coding | tolerated(0.14) | benign(0.011) | TCGA-C5-A1BJ-01 | Cervix | cervical & endocervical cancer | Female | <65 | I/II | Unknown | Unknown | SD |
| RTN3 | SNV | Missense_Mutation | novel | c.1115C>T | p.Ser372Leu | p.S372L | O95197 | protein_coding | deleterious(0) | possibly_damaging(0.617) | TCGA-C5-A2LY-01 | Cervix | cervical & endocervical cancer | Female | <65 | I/II | Chemotherapy | cisplatin | SD |
| Page: 1 2 3 4 5 6 7 8 9 |
Top |
Related drugs of malignant transformation related genes |
| Identification of chemicals and drugs interact with genes involved in malignant transfromation |
| (DGIdb 4.0) |
| Entrez ID | Symbol | Category | Interaction Types | Drug Claim Name | Drug Name | PMIDs |
| Page: 1 |

Copyright 2023-Present -The University of Texas Health Science Center at Houston |