
|
|||||
|
 | |
| |
| |
| |
| |
| |
|
Gene: RTKN2 |
Gene summary for RTKN2 |
| Gene information | Species | Human | Gene symbol | RTKN2 | Gene ID | 219790 |
| Gene name | rhotekin 2 | |
| Gene Alias | PLEKHK1 | |
| Cytomap | 10q21.2 | |
| Gene Type | protein-coding | GO ID | GO:0002376 | UniProtAcc | Q8IZC4 |
Top |
Malignant transformation analysis |
| Identification of the aberrant gene expression in precancerous and cancerous lesions by comparing the gene expression of stem-like cells in diseased tissues with normal stem cells |
| Entrez ID | Symbol | Replicates | Species | Organ | Tissue | Adj P-value | Log2FC | Malignancy |
| 219790 | RTKN2 | CA_HPV_2 | Human | Cervix | CC | 1.39e-07 | 3.44e-01 | 0.0391 |
| 219790 | RTKN2 | CCI_1 | Human | Cervix | CC | 8.30e-10 | 7.55e-01 | 0.528 |
| 219790 | RTKN2 | CCI_2 | Human | Cervix | CC | 8.98e-09 | 7.22e-01 | 0.5249 |
| 219790 | RTKN2 | CCI_3 | Human | Cervix | CC | 1.42e-12 | 6.52e-01 | 0.516 |
| 219790 | RTKN2 | Tumor | Human | Cervix | CC | 1.25e-02 | 1.85e-01 | 0.1241 |
| 219790 | RTKN2 | sample3 | Human | Cervix | CC | 1.16e-14 | 2.90e-01 | 0.1387 |
| 219790 | RTKN2 | H2 | Human | Cervix | HSIL_HPV | 1.29e-05 | 2.41e-01 | 0.0632 |
| 219790 | RTKN2 | T1 | Human | Cervix | CC | 9.84e-03 | 1.78e-01 | 0.0918 |
| 219790 | RTKN2 | T3 | Human | Cervix | CC | 5.65e-09 | 2.28e-01 | 0.1389 |
| 219790 | RTKN2 | C30 | Human | Oral cavity | OSCC | 1.83e-25 | 1.02e+00 | 0.3055 |
| 219790 | RTKN2 | C38 | Human | Oral cavity | OSCC | 1.79e-05 | 2.89e-01 | 0.172 |
| 219790 | RTKN2 | C46 | Human | Oral cavity | OSCC | 7.91e-10 | 1.72e-01 | 0.1673 |
| 219790 | RTKN2 | C57 | Human | Oral cavity | OSCC | 4.85e-16 | 5.53e-01 | 0.1679 |
| 219790 | RTKN2 | LN46 | Human | Oral cavity | OSCC | 3.43e-10 | 4.56e-01 | 0.1666 |
| 219790 | RTKN2 | LP15 | Human | Oral cavity | LP | 2.89e-03 | 2.85e-01 | 0.2174 |
| Page: 1 |
| Tissue | Expression Dynamics | Abbreviation |
| Cervix | 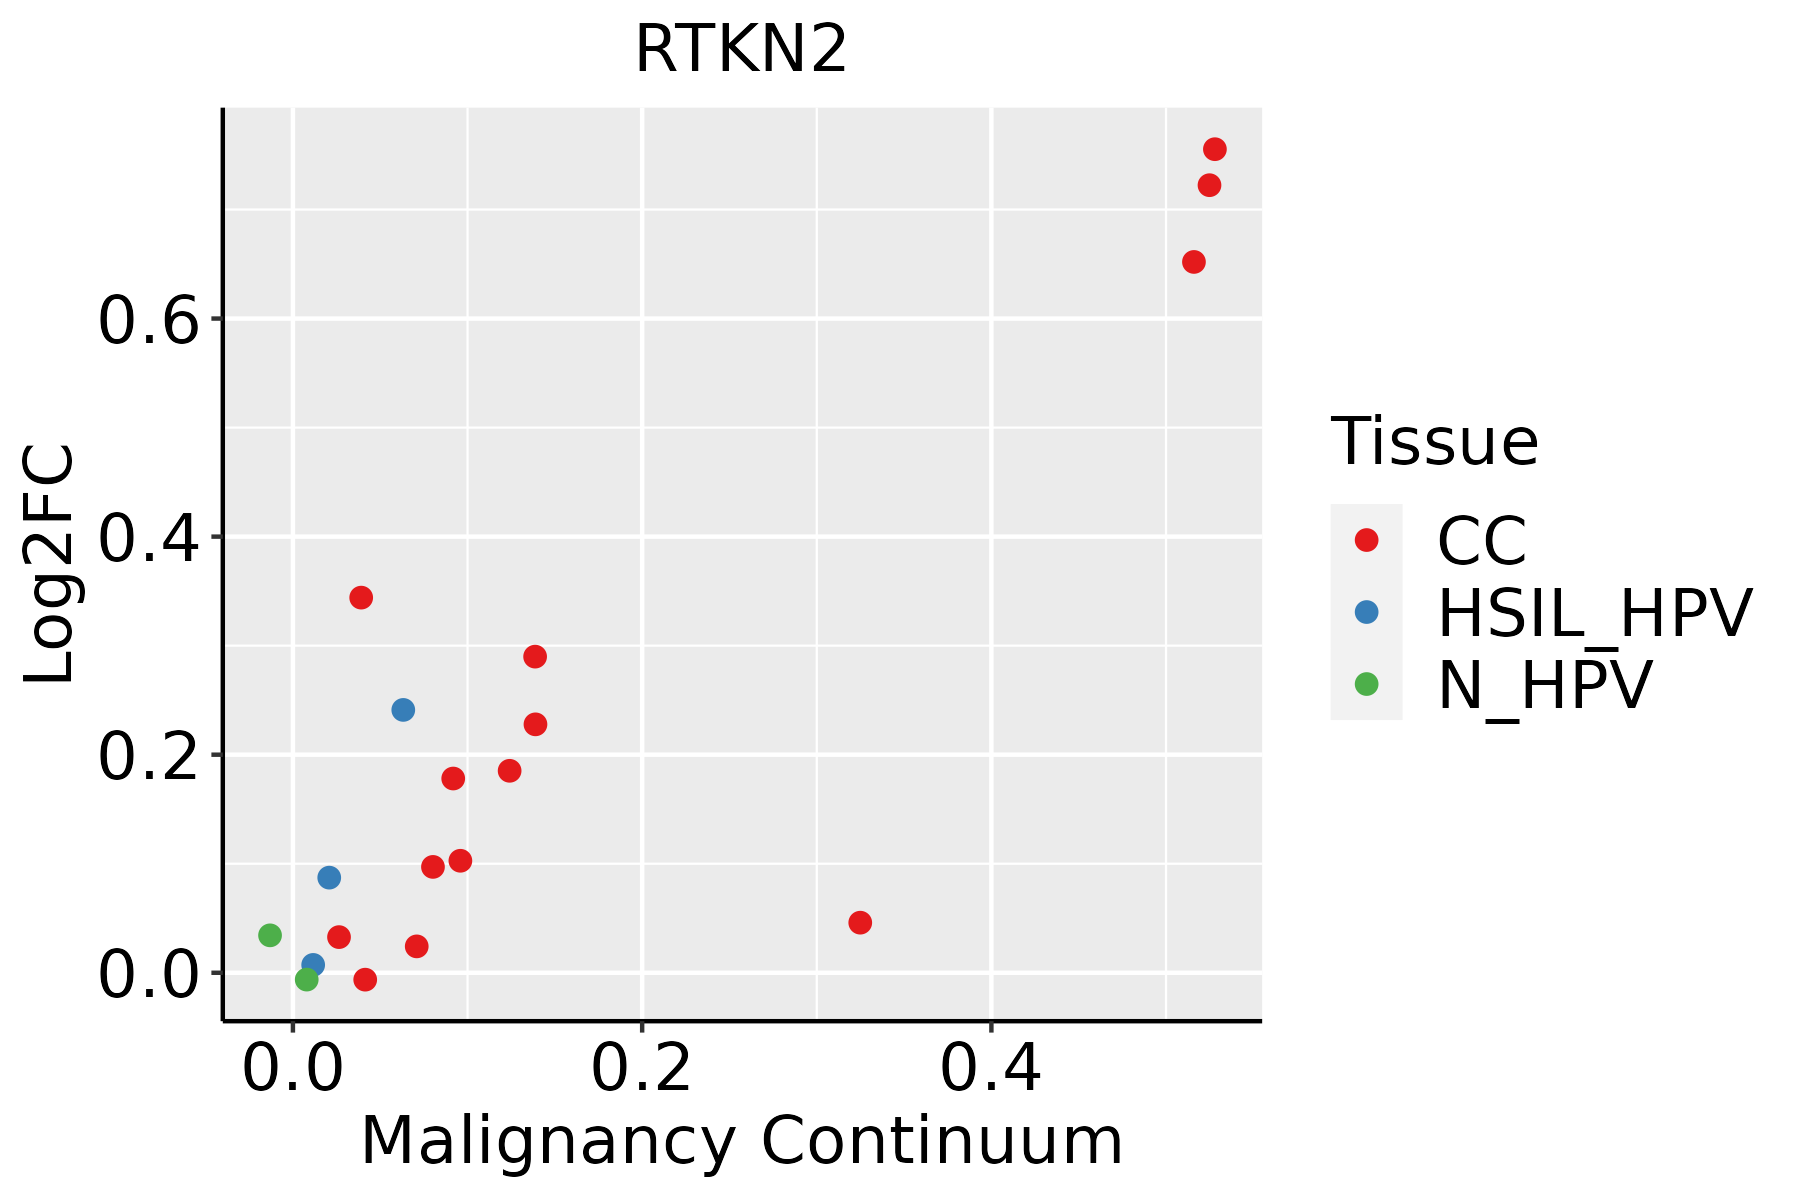 | CC: Cervix cancer |
| HSIL_HPV: HPV-infected high-grade squamous intraepithelial lesions | ||
| N_HPV: HPV-infected normal cervix | ||
| Oral Cavity | 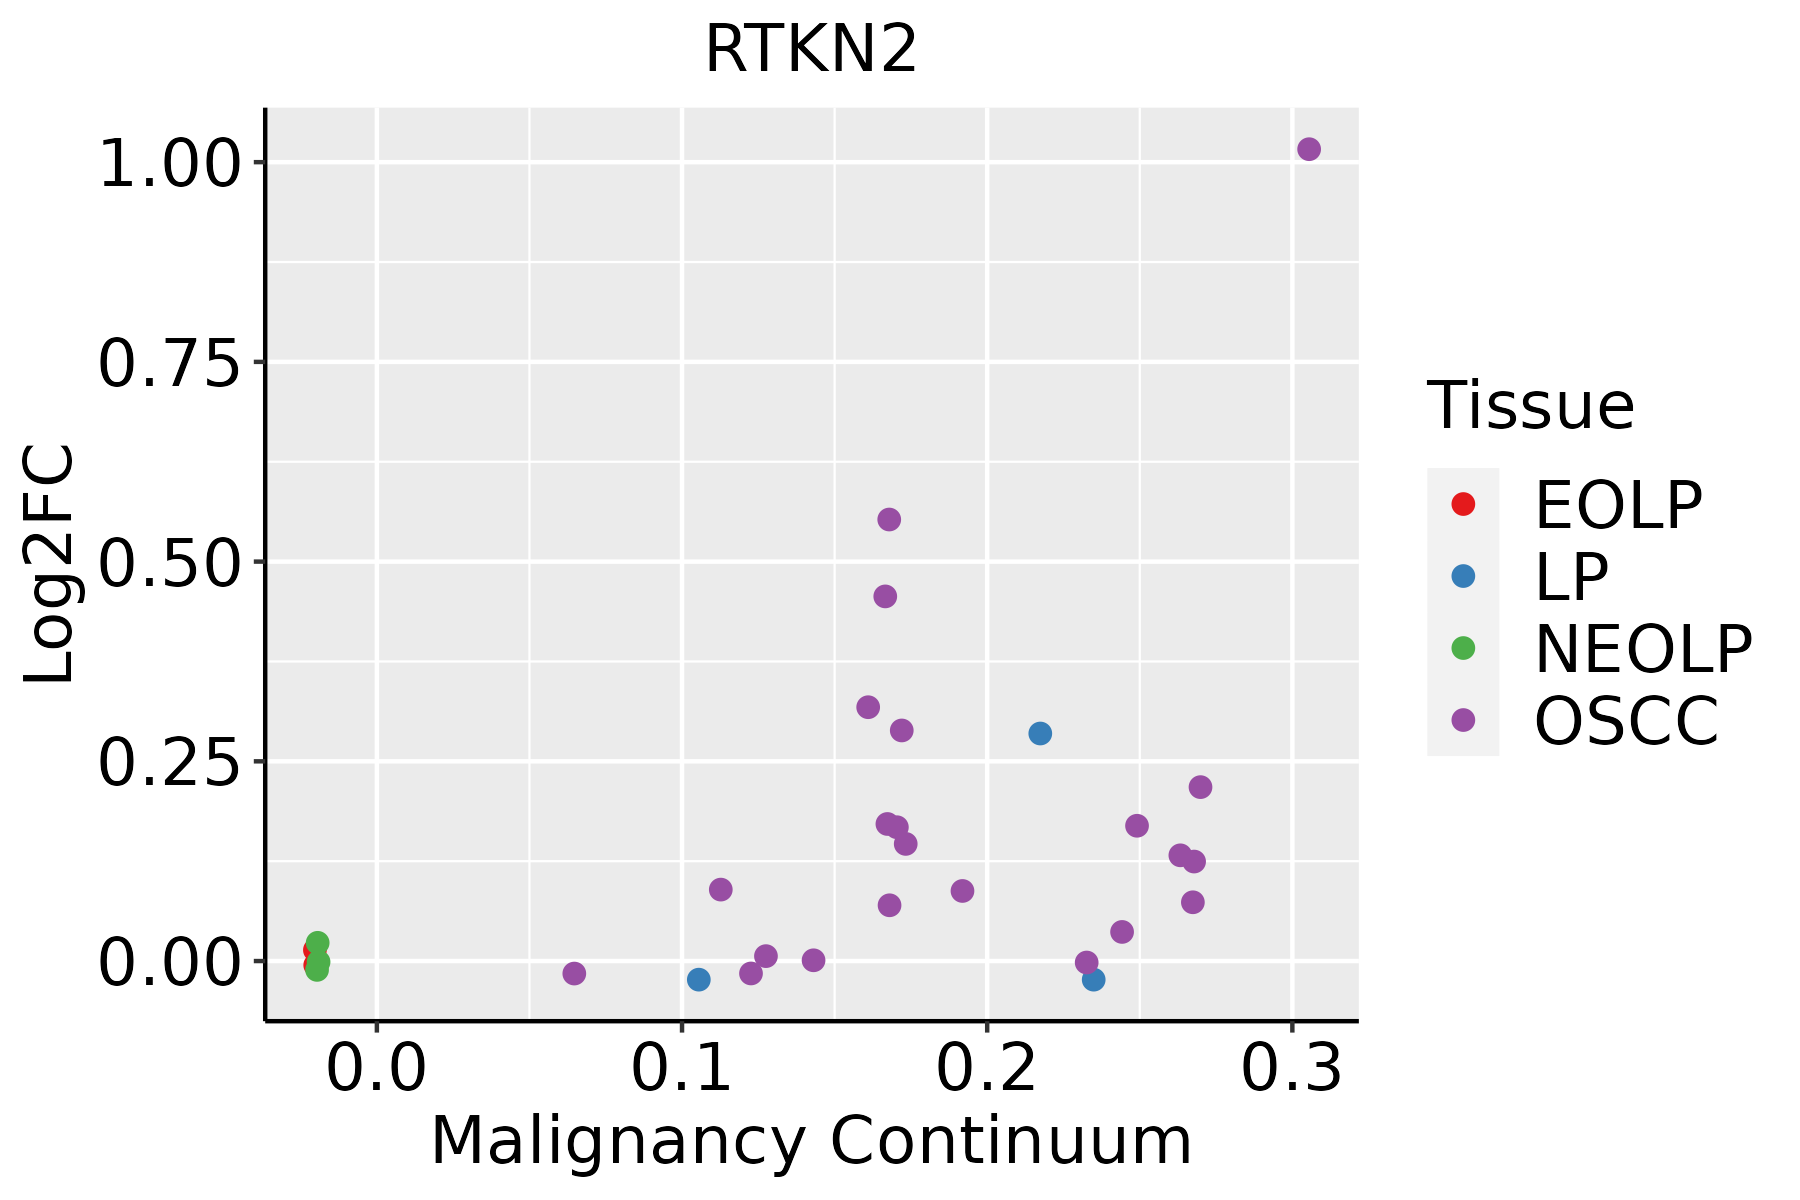 | EOLP: Erosive Oral lichen planus |
| LP: leukoplakia | ||
| NEOLP: Non-erosive oral lichen planus | ||
| OSCC: Oral squamous cell carcinoma |
| ∗log2FC in expression of this searched gene in stem-like cells from each diseased tissue sample relative to stem-like cells in normal samples in each tissue plotted against the malignancy continuum. Samples are colored based on if they are from different disease stage. |
Top |
Malignant transformation related pathway analysis |
| Find out the enriched GO biological processes and KEGG pathways involved in transition from healthy to precancer to cancer |
| Tissue | Disease Stage | Enriched GO biological Processes |
| Colorectum | AD |  |
| Colorectum | SER |  |
| Colorectum | MSS |  |
| Colorectum | MSI-H |  |
| Colorectum | FAP |  |
| ∗Top 15 enriched GO BP terms are showed in the bar plot of each disease state in each tissue. Each row represents a significant GO biological process which is colored according to the -log10(p.adjust). |
| Page: 1 2 3 4 5 6 7 8 9 |
| GO ID | Tissue | Disease Stage | Description | Gene Ratio | Bg Ratio | pvalue | p.adjust | Count |
| GO:009719310 | Cervix | CC | intrinsic apoptotic signaling pathway | 85/2311 | 288/18723 | 4.56e-15 | 6.46e-12 | 85 |
| GO:200123310 | Cervix | CC | regulation of apoptotic signaling pathway | 96/2311 | 356/18723 | 4.08e-14 | 3.05e-11 | 96 |
| GO:200124210 | Cervix | CC | regulation of intrinsic apoptotic signaling pathway | 52/2311 | 164/18723 | 5.06e-11 | 1.01e-08 | 52 |
| GO:200123410 | Cervix | CC | negative regulation of apoptotic signaling pathway | 56/2311 | 224/18723 | 1.39e-07 | 6.70e-06 | 56 |
| GO:00510904 | Cervix | CC | regulation of DNA-binding transcription factor activity | 87/2311 | 440/18723 | 4.85e-06 | 1.22e-04 | 87 |
| GO:200124310 | Cervix | CC | negative regulation of intrinsic apoptotic signaling pathway | 28/2311 | 98/18723 | 1.31e-05 | 2.66e-04 | 28 |
| GO:00510915 | Cervix | CC | positive regulation of DNA-binding transcription factor activity | 51/2311 | 260/18723 | 5.05e-04 | 4.92e-03 | 51 |
| GO:00510923 | Cervix | CC | positive regulation of NF-kappaB transcription factor activity | 32/2311 | 152/18723 | 1.62e-03 | 1.25e-02 | 32 |
| GO:009719315 | Cervix | HSIL_HPV | intrinsic apoptotic signaling pathway | 41/737 | 288/18723 | 8.91e-13 | 1.43e-09 | 41 |
| GO:200123315 | Cervix | HSIL_HPV | regulation of apoptotic signaling pathway | 46/737 | 356/18723 | 1.23e-12 | 1.49e-09 | 46 |
| GO:200124215 | Cervix | HSIL_HPV | regulation of intrinsic apoptotic signaling pathway | 27/737 | 164/18723 | 2.67e-10 | 7.02e-08 | 27 |
| GO:200123415 | Cervix | HSIL_HPV | negative regulation of apoptotic signaling pathway | 27/737 | 224/18723 | 2.44e-07 | 1.45e-05 | 27 |
| GO:005109211 | Cervix | HSIL_HPV | positive regulation of NF-kappaB transcription factor activity | 20/737 | 152/18723 | 2.25e-06 | 9.41e-05 | 20 |
| GO:200124315 | Cervix | HSIL_HPV | negative regulation of intrinsic apoptotic signaling pathway | 15/737 | 98/18723 | 6.40e-06 | 2.30e-04 | 15 |
| GO:005109012 | Cervix | HSIL_HPV | regulation of DNA-binding transcription factor activity | 35/737 | 440/18723 | 6.77e-05 | 1.58e-03 | 35 |
| GO:005109112 | Cervix | HSIL_HPV | positive regulation of DNA-binding transcription factor activity | 24/737 | 260/18723 | 1.01e-04 | 2.16e-03 | 24 |
| GO:200123320 | Oral cavity | OSCC | regulation of apoptotic signaling pathway | 242/7305 | 356/18723 | 6.66e-29 | 3.24e-26 | 242 |
| GO:009719320 | Oral cavity | OSCC | intrinsic apoptotic signaling pathway | 202/7305 | 288/18723 | 4.64e-27 | 1.73e-24 | 202 |
| GO:200124220 | Oral cavity | OSCC | regulation of intrinsic apoptotic signaling pathway | 123/7305 | 164/18723 | 5.71e-21 | 9.77e-19 | 123 |
| GO:200123420 | Oral cavity | OSCC | negative regulation of apoptotic signaling pathway | 148/7305 | 224/18723 | 1.71e-16 | 1.36e-14 | 148 |
| Page: 1 2 |
| Pathway ID | Tissue | Disease Stage | Description | Gene Ratio | Bg Ratio | pvalue | p.adjust | qvalue | Count |
| Page: 1 |
Top |
Cell-cell communication analysis |
| Identification of potential cell-cell interactions between two cell types and their ligand-receptor pairs for different disease states |
| Ligand | Receptor | LRpair | Pathway | Tissue | Disease Stage |
| Page: 1 |
Top |
Single-cell gene regulatory network inference analysis |
| Find out the significant the regulons (TFs) and the target genes of each regulon across cell types for different disease states |
| TF | Cell Type | Tissue | Disease Stage | Target Gene | RSS | Regulon Activity |
| ∗The dot plots of a searched regulon are shown for all cell subpopulations in each disease state of each tissue based on the regulon specific score inferred using pySCENIC and by calculating the average expression. |
| Page: 1 |
Top |
Somatic mutation of malignant transformation related genes |
| Annotation of somatic variants for genes involved in malignant transformation |
| Hugo Symbol | Variant Class | Variant Classification | dbSNP RS | HGVSc | HGVSp | HGVSp Short | SWISSPROT | BIOTYPE | SIFT | PolyPhen | Tumor Sample Barcode | Tissue | Histology | Sex | Age | Stage | Therapy Types | Drugs | Outcome |
| RTKN2 | SNV | Missense_Mutation | rs778526220 | c.98N>A | p.Arg33Gln | p.R33Q | Q8IZC4 | protein_coding | deleterious(0.01) | probably_damaging(0.994) | TCGA-AN-A046-01 | Breast | breast invasive carcinoma | Female | >=65 | I/II | Unknown | Unknown | SD |
| RTKN2 | SNV | Missense_Mutation | c.349N>C | p.Asp117His | p.D117H | Q8IZC4 | protein_coding | deleterious(0) | probably_damaging(1) | TCGA-BH-A0BP-01 | Breast | breast invasive carcinoma | Female | >=65 | I/II | Unknown | Unknown | SD | |
| RTKN2 | SNV | Missense_Mutation | c.921N>A | p.Phe307Leu | p.F307L | protein_coding | deleterious_low_confidence(0) | benign(0.003) | TCGA-EK-A2R8-01 | Cervix | cervical & endocervical cancer | Female | <65 | I/II | Unknown | Unknown | SD | ||
| RTKN2 | SNV | Missense_Mutation | c.106G>A | p.Glu36Lys | p.E36K | Q8IZC4 | protein_coding | deleterious(0.01) | benign(0.015) | TCGA-EK-A2RN-01 | Cervix | cervical & endocervical cancer | Female | <65 | I/II | Unknown | Unknown | SD | |
| RTKN2 | SNV | Missense_Mutation | rs145577789 | c.1645N>G | p.Met549Val | p.M549V | Q8IZC4 | protein_coding | tolerated(0.25) | benign(0.005) | TCGA-JW-A852-01 | Cervix | cervical & endocervical cancer | Female | <65 | I/II | Unknown | Unknown | PD |
| RTKN2 | deletion | Frame_Shift_Del | rs765032947 | c.1348delN | p.Ile450LeufsTer67 | p.I450Lfs*67 | Q8IZC4 | protein_coding | TCGA-VS-A9U6-01 | Cervix | cervical & endocervical cancer | Female | <65 | I/II | Chemotherapy | cisplatin | PD | ||
| RTKN2 | SNV | Missense_Mutation | novel | c.836N>T | p.Ala279Val | p.A279V | Q8IZC4 | protein_coding | tolerated(0.06) | benign(0.116) | TCGA-5M-AAT6-01 | Colorectum | colon adenocarcinoma | Female | <65 | III/IV | Unknown | Unknown | PD |
| RTKN2 | SNV | Missense_Mutation | c.1198N>T | p.His400Tyr | p.H400Y | Q8IZC4 | protein_coding | deleterious(0) | possibly_damaging(0.794) | TCGA-AA-3492-01 | Colorectum | colon adenocarcinoma | Female | >=65 | I/II | Unknown | Unknown | SD | |
| RTKN2 | SNV | Missense_Mutation | rs758667603 | c.323G>A | p.Arg108Gln | p.R108Q | Q8IZC4 | protein_coding | deleterious(0.02) | probably_damaging(0.998) | TCGA-AD-6963-01 | Colorectum | colon adenocarcinoma | Male | <65 | I/II | Unknown | Unknown | SD |
| RTKN2 | SNV | Missense_Mutation | c.1423G>C | p.Asp475His | p.D475H | Q8IZC4 | protein_coding | deleterious(0.01) | probably_damaging(0.998) | TCGA-AY-4071-01 | Colorectum | colon adenocarcinoma | Female | <65 | I/II | Unknown | Unknown | SD |
| Page: 1 2 3 4 5 6 7 8 |
Top |
Related drugs of malignant transformation related genes |
| Identification of chemicals and drugs interact with genes involved in malignant transfromation |
| (DGIdb 4.0) |
| Entrez ID | Symbol | Category | Interaction Types | Drug Claim Name | Drug Name | PMIDs |
| 219790 | RTKN2 | NA | haloperidol | HALOPERIDOL | 27023437 |
| Page: 1 |

Copyright 2023-Present -The University of Texas Health Science Center at Houston |