
|
|||||
|
 | |
| |
| |
| |
| |
| |
|
Gene: RTKN |
Gene summary for RTKN |
| Gene information | Species | Human | Gene symbol | RTKN | Gene ID | 6242 |
| Gene name | rhotekin | |
| Gene Alias | RTKN | |
| Cytomap | 2p13.1 | |
| Gene Type | protein-coding | GO ID | GO:0000278 | UniProtAcc | Q9BST9 |
Top |
Malignant transformation analysis |
| Identification of the aberrant gene expression in precancerous and cancerous lesions by comparing the gene expression of stem-like cells in diseased tissues with normal stem cells |
| Entrez ID | Symbol | Replicates | Species | Organ | Tissue | Adj P-value | Log2FC | Malignancy |
| 6242 | RTKN | LZE4T | Human | Esophagus | ESCC | 6.75e-06 | 3.18e-01 | 0.0811 |
| 6242 | RTKN | LZE7T | Human | Esophagus | ESCC | 6.91e-07 | 2.45e-01 | 0.0667 |
| 6242 | RTKN | LZE22T | Human | Esophagus | ESCC | 1.50e-03 | 3.92e-01 | 0.068 |
| 6242 | RTKN | LZE24T | Human | Esophagus | ESCC | 8.39e-05 | 9.00e-02 | 0.0596 |
| 6242 | RTKN | P1T-E | Human | Esophagus | ESCC | 2.71e-03 | 3.88e-01 | 0.0875 |
| 6242 | RTKN | P2T-E | Human | Esophagus | ESCC | 5.01e-33 | 6.31e-01 | 0.1177 |
| 6242 | RTKN | P4T-E | Human | Esophagus | ESCC | 3.27e-12 | 2.00e-01 | 0.1323 |
| 6242 | RTKN | P5T-E | Human | Esophagus | ESCC | 1.81e-25 | 4.23e-01 | 0.1327 |
| 6242 | RTKN | P8T-E | Human | Esophagus | ESCC | 3.58e-15 | 2.07e-01 | 0.0889 |
| 6242 | RTKN | P9T-E | Human | Esophagus | ESCC | 7.22e-08 | 3.02e-01 | 0.1131 |
| 6242 | RTKN | P10T-E | Human | Esophagus | ESCC | 6.40e-13 | 3.13e-01 | 0.116 |
| 6242 | RTKN | P11T-E | Human | Esophagus | ESCC | 4.12e-28 | 1.01e+00 | 0.1426 |
| 6242 | RTKN | P12T-E | Human | Esophagus | ESCC | 1.29e-23 | 4.27e-01 | 0.1122 |
| 6242 | RTKN | P15T-E | Human | Esophagus | ESCC | 3.42e-07 | 2.88e-01 | 0.1149 |
| 6242 | RTKN | P16T-E | Human | Esophagus | ESCC | 5.53e-18 | 4.05e-01 | 0.1153 |
| 6242 | RTKN | P17T-E | Human | Esophagus | ESCC | 2.01e-04 | 4.50e-01 | 0.1278 |
| 6242 | RTKN | P19T-E | Human | Esophagus | ESCC | 8.24e-10 | 8.97e-01 | 0.1662 |
| 6242 | RTKN | P20T-E | Human | Esophagus | ESCC | 6.59e-18 | 5.36e-01 | 0.1124 |
| 6242 | RTKN | P21T-E | Human | Esophagus | ESCC | 5.00e-47 | 9.36e-01 | 0.1617 |
| 6242 | RTKN | P22T-E | Human | Esophagus | ESCC | 7.89e-15 | 2.57e-01 | 0.1236 |
| Page: 1 2 3 4 5 |
| Tissue | Expression Dynamics | Abbreviation |
| Esophagus |  | ESCC: Esophageal squamous cell carcinoma |
| HGIN: High-grade intraepithelial neoplasias | ||
| LGIN: Low-grade intraepithelial neoplasias | ||
| Liver | 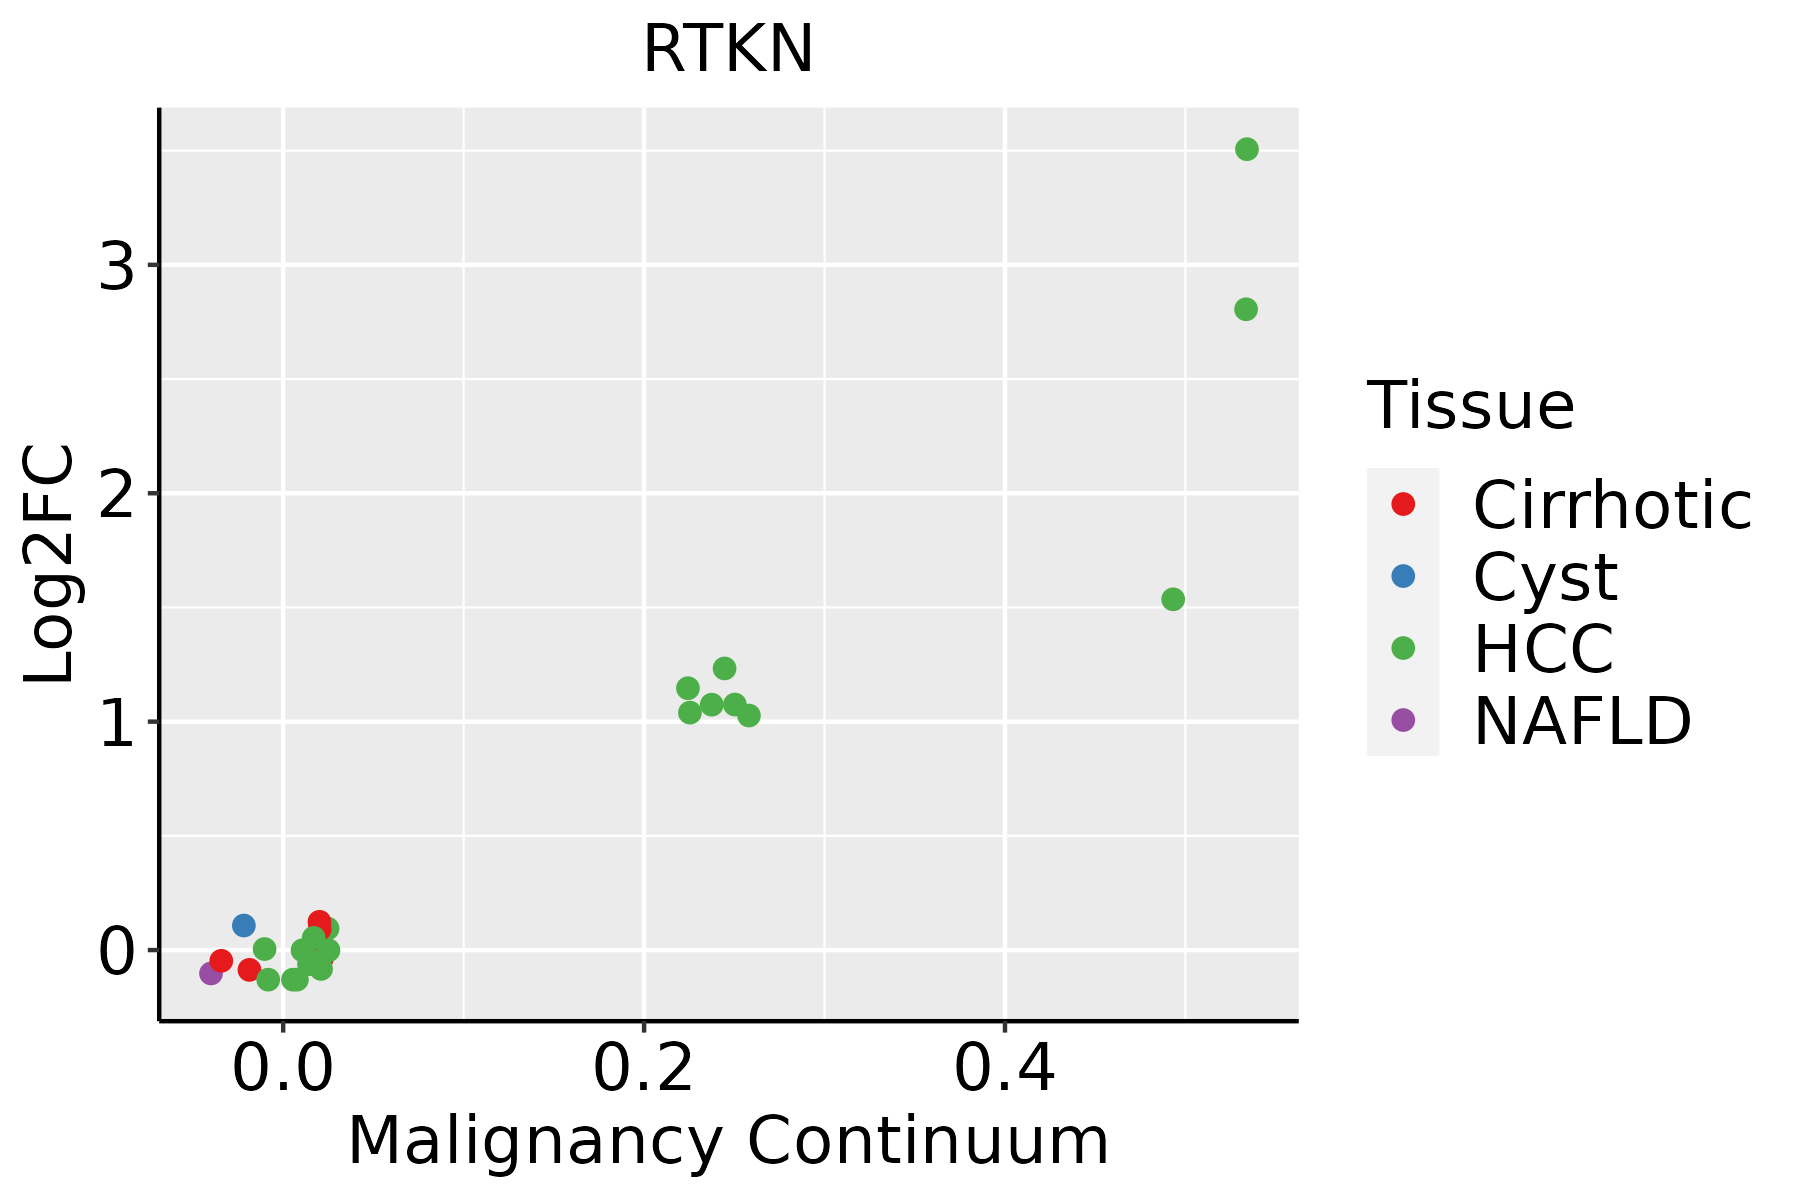 | HCC: Hepatocellular carcinoma |
| NAFLD: Non-alcoholic fatty liver disease | ||
| Oral Cavity | 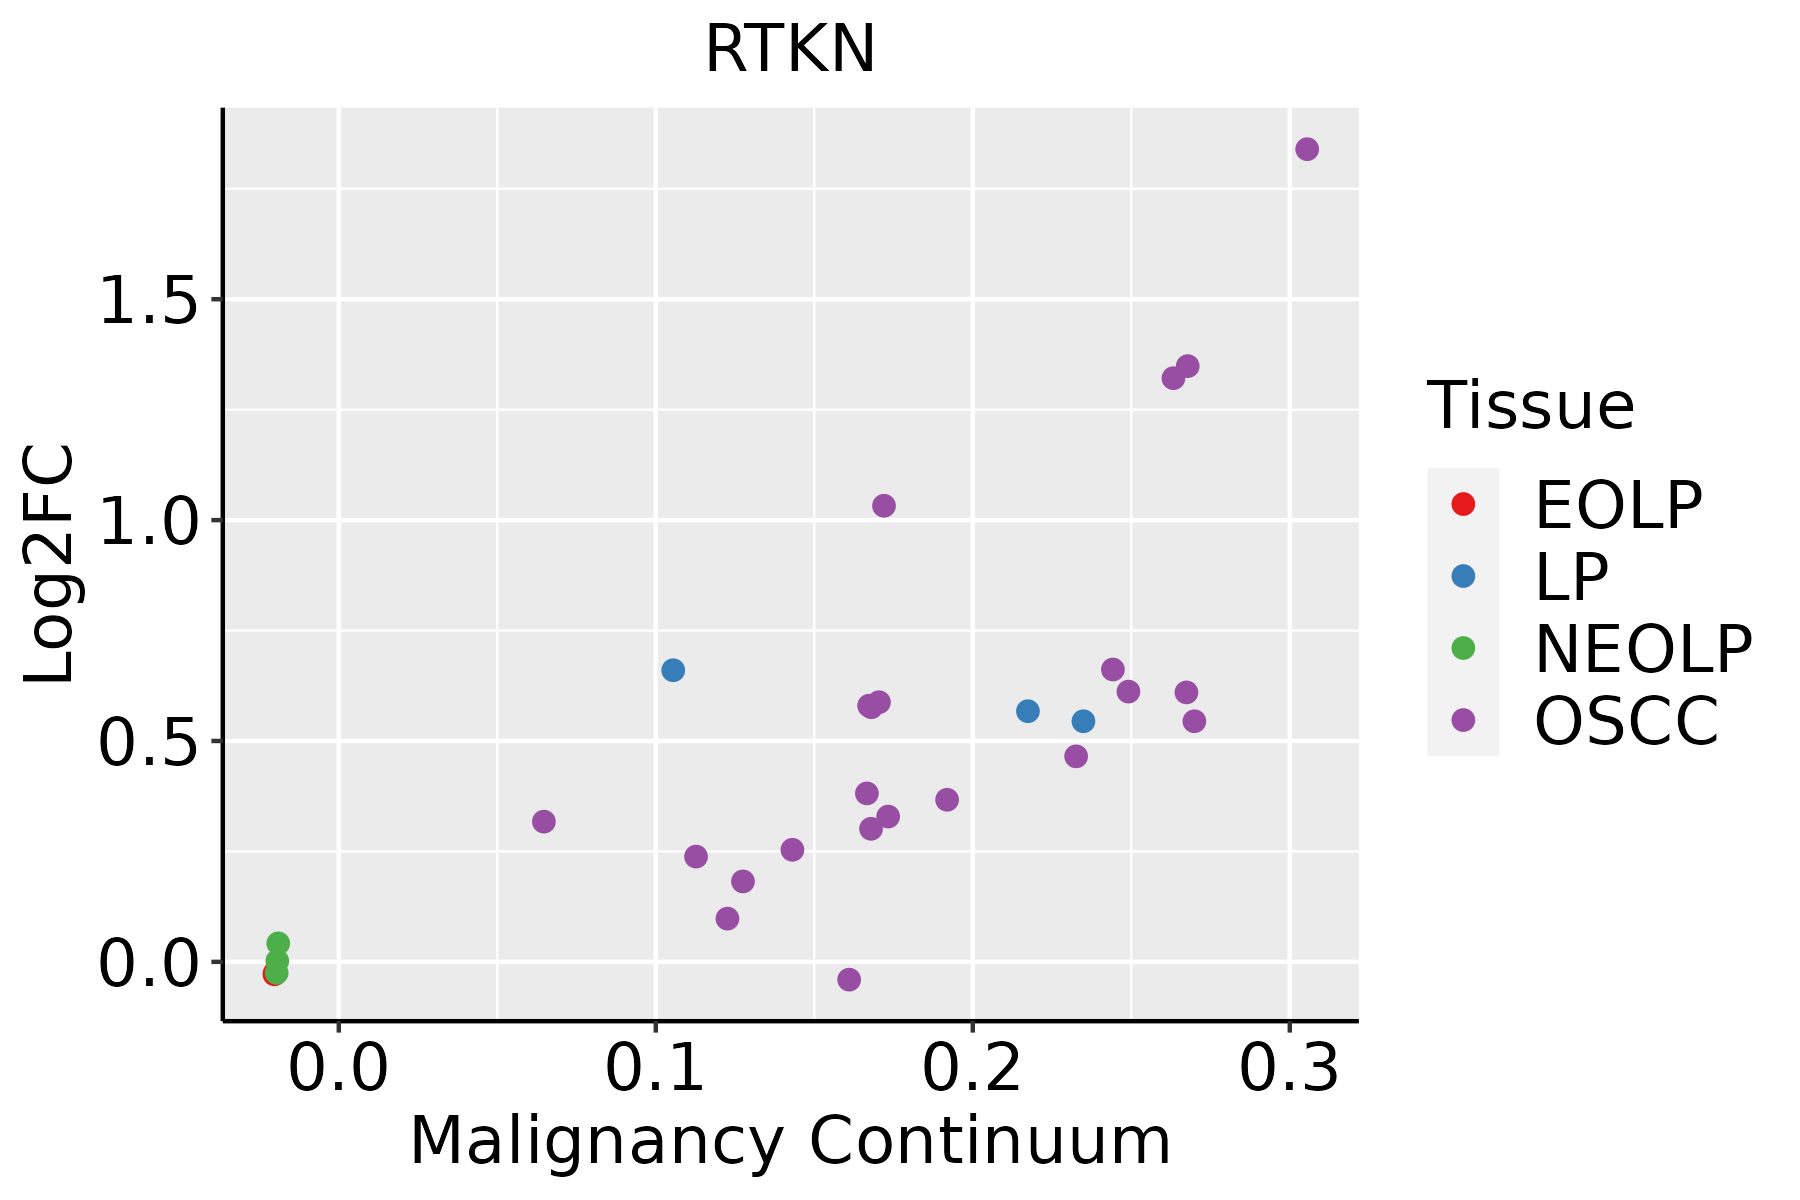 | EOLP: Erosive Oral lichen planus |
| LP: leukoplakia | ||
| NEOLP: Non-erosive oral lichen planus | ||
| OSCC: Oral squamous cell carcinoma | ||
| Skin |  | AK: Actinic keratosis |
| cSCC: Cutaneous squamous cell carcinoma | ||
| SCCIS:squamous cell carcinoma in situ |
| ∗log2FC in expression of this searched gene in stem-like cells from each diseased tissue sample relative to stem-like cells in normal samples in each tissue plotted against the malignancy continuum. Samples are colored based on if they are from different disease stage. |
Top |
Malignant transformation related pathway analysis |
| Find out the enriched GO biological processes and KEGG pathways involved in transition from healthy to precancer to cancer |
| Tissue | Disease Stage | Enriched GO biological Processes |
| Colorectum | AD |  |
| Colorectum | SER |  |
| Colorectum | MSS |  |
| Colorectum | MSI-H |  |
| Colorectum | FAP |  |
| ∗Top 15 enriched GO BP terms are showed in the bar plot of each disease state in each tissue. Each row represents a significant GO biological process which is colored according to the -log10(p.adjust). |
| Page: 1 2 3 4 5 6 7 8 9 |
| GO ID | Tissue | Disease Stage | Description | Gene Ratio | Bg Ratio | pvalue | p.adjust | Count |
| GO:009719310 | Cervix | CC | intrinsic apoptotic signaling pathway | 85/2311 | 288/18723 | 4.56e-15 | 6.46e-12 | 85 |
| GO:200123310 | Cervix | CC | regulation of apoptotic signaling pathway | 96/2311 | 356/18723 | 4.08e-14 | 3.05e-11 | 96 |
| GO:200124210 | Cervix | CC | regulation of intrinsic apoptotic signaling pathway | 52/2311 | 164/18723 | 5.06e-11 | 1.01e-08 | 52 |
| GO:200123410 | Cervix | CC | negative regulation of apoptotic signaling pathway | 56/2311 | 224/18723 | 1.39e-07 | 6.70e-06 | 56 |
| GO:00510904 | Cervix | CC | regulation of DNA-binding transcription factor activity | 87/2311 | 440/18723 | 4.85e-06 | 1.22e-04 | 87 |
| GO:200124310 | Cervix | CC | negative regulation of intrinsic apoptotic signaling pathway | 28/2311 | 98/18723 | 1.31e-05 | 2.66e-04 | 28 |
| GO:00510915 | Cervix | CC | positive regulation of DNA-binding transcription factor activity | 51/2311 | 260/18723 | 5.05e-04 | 4.92e-03 | 51 |
| GO:00510923 | Cervix | CC | positive regulation of NF-kappaB transcription factor activity | 32/2311 | 152/18723 | 1.62e-03 | 1.25e-02 | 32 |
| GO:009719315 | Cervix | HSIL_HPV | intrinsic apoptotic signaling pathway | 41/737 | 288/18723 | 8.91e-13 | 1.43e-09 | 41 |
| GO:200123315 | Cervix | HSIL_HPV | regulation of apoptotic signaling pathway | 46/737 | 356/18723 | 1.23e-12 | 1.49e-09 | 46 |
| GO:200124215 | Cervix | HSIL_HPV | regulation of intrinsic apoptotic signaling pathway | 27/737 | 164/18723 | 2.67e-10 | 7.02e-08 | 27 |
| GO:200123415 | Cervix | HSIL_HPV | negative regulation of apoptotic signaling pathway | 27/737 | 224/18723 | 2.44e-07 | 1.45e-05 | 27 |
| GO:005109211 | Cervix | HSIL_HPV | positive regulation of NF-kappaB transcription factor activity | 20/737 | 152/18723 | 2.25e-06 | 9.41e-05 | 20 |
| GO:200124315 | Cervix | HSIL_HPV | negative regulation of intrinsic apoptotic signaling pathway | 15/737 | 98/18723 | 6.40e-06 | 2.30e-04 | 15 |
| GO:005109012 | Cervix | HSIL_HPV | regulation of DNA-binding transcription factor activity | 35/737 | 440/18723 | 6.77e-05 | 1.58e-03 | 35 |
| GO:005109112 | Cervix | HSIL_HPV | positive regulation of DNA-binding transcription factor activity | 24/737 | 260/18723 | 1.01e-04 | 2.16e-03 | 24 |
| GO:000028115 | Esophagus | ESCC | mitotic cytokinesis | 58/8552 | 71/18723 | 4.34e-10 | 1.15e-08 | 58 |
| GO:003250614 | Esophagus | ESCC | cytokinetic process | 35/8552 | 39/18723 | 9.38e-09 | 1.90e-07 | 35 |
| GO:000091016 | Esophagus | ESCC | cytokinesis | 115/8552 | 173/18723 | 2.48e-08 | 4.68e-07 | 115 |
| GO:006164015 | Esophagus | ESCC | cytoskeleton-dependent cytokinesis | 72/8552 | 100/18723 | 8.10e-08 | 1.39e-06 | 72 |
| Page: 1 2 3 4 5 |
| Pathway ID | Tissue | Disease Stage | Description | Gene Ratio | Bg Ratio | pvalue | p.adjust | qvalue | Count |
| Page: 1 |
Top |
Cell-cell communication analysis |
| Identification of potential cell-cell interactions between two cell types and their ligand-receptor pairs for different disease states |
| Ligand | Receptor | LRpair | Pathway | Tissue | Disease Stage |
| Page: 1 |
Top |
Single-cell gene regulatory network inference analysis |
| Find out the significant the regulons (TFs) and the target genes of each regulon across cell types for different disease states |
| TF | Cell Type | Tissue | Disease Stage | Target Gene | RSS | Regulon Activity |
| ∗The dot plots of a searched regulon are shown for all cell subpopulations in each disease state of each tissue based on the regulon specific score inferred using pySCENIC and by calculating the average expression. |
| Page: 1 |
Top |
Somatic mutation of malignant transformation related genes |
| Annotation of somatic variants for genes involved in malignant transformation |
| Hugo Symbol | Variant Class | Variant Classification | dbSNP RS | HGVSc | HGVSp | HGVSp Short | SWISSPROT | BIOTYPE | SIFT | PolyPhen | Tumor Sample Barcode | Tissue | Histology | Sex | Age | Stage | Therapy Types | Drugs | Outcome |
| RTKN | SNV | Missense_Mutation | c.1036N>A | p.Glu346Lys | p.E346K | Q9BST9 | protein_coding | deleterious(0) | possibly_damaging(0.843) | TCGA-AC-A23H-01 | Breast | breast invasive carcinoma | Female | >=65 | I/II | Unknown | Unknown | PD | |
| RTKN | SNV | Missense_Mutation | rs142913266 | c.895C>G | p.Arg299Gly | p.R299G | Q9BST9 | protein_coding | deleterious(0) | probably_damaging(0.965) | TCGA-BH-A18T-01 | Breast | breast invasive carcinoma | Female | >=65 | I/II | Unknown | Unknown | PD |
| RTKN | insertion | Frame_Shift_Ins | novel | c.591_592insATCCTCCCGCCTCGGCCTCCCAAAGTGGTAGGATTACA | p.Ala198IlefsTer22 | p.A198Ifs*22 | Q9BST9 | protein_coding | TCGA-BH-A0AY-01 | Breast | breast invasive carcinoma | Female | <65 | I/II | Chemotherapy | SD | |||
| RTKN | SNV | Missense_Mutation | rs201347198 | c.1667N>A | p.Arg556His | p.R556H | Q9BST9 | protein_coding | tolerated_low_confidence(0.44) | benign(0) | TCGA-VS-A94Z-01 | Cervix | cervical & endocervical cancer | Female | <65 | I/II | Chemotherapy | cisplatin | CR |
| RTKN | SNV | Missense_Mutation | c.111N>T | p.Glu37Asp | p.E37D | Q9BST9 | protein_coding | deleterious(0.05) | benign(0.182) | TCGA-A6-2686-01 | Colorectum | colon adenocarcinoma | Female | >=65 | I/II | Unknown | Unknown | SD | |
| RTKN | SNV | Missense_Mutation | rs765799493 | c.1384N>A | p.Ala462Thr | p.A462T | Q9BST9 | protein_coding | deleterious(0.04) | benign(0.029) | TCGA-A6-6653-01 | Colorectum | colon adenocarcinoma | Male | >=65 | I/II | Unknown | Unknown | SD |
| RTKN | SNV | Missense_Mutation | rs374992298 | c.1633N>T | p.Arg545Trp | p.R545W | Q9BST9 | protein_coding | deleterious_low_confidence(0) | benign(0.153) | TCGA-AA-3526-01 | Colorectum | colon adenocarcinoma | Male | <65 | I/II | Unknown | Unknown | SD |
| RTKN | SNV | Missense_Mutation | c.1627T>A | p.Ser543Thr | p.S543T | Q9BST9 | protein_coding | tolerated(0.09) | benign(0.02) | TCGA-AD-6895-01 | Colorectum | colon adenocarcinoma | Male | >=65 | III/IV | Unknown | Unknown | SD | |
| RTKN | SNV | Missense_Mutation | c.194N>A | p.Arg65Gln | p.R65Q | Q9BST9 | protein_coding | deleterious(0) | probably_damaging(0.947) | TCGA-QG-A5Z2-01 | Colorectum | colon adenocarcinoma | Male | <65 | I/II | Unknown | Unknown | SD | |
| RTKN | SNV | Missense_Mutation | c.722G>A | p.Ser241Asn | p.S241N | Q9BST9 | protein_coding | tolerated(0.28) | benign(0.003) | TCGA-AG-3892-01 | Colorectum | rectum adenocarcinoma | Female | <65 | I/II | Unknown | Unknown | SD |
| Page: 1 2 3 4 5 6 |
Top |
Related drugs of malignant transformation related genes |
| Identification of chemicals and drugs interact with genes involved in malignant transfromation |
| (DGIdb 4.0) |
| Entrez ID | Symbol | Category | Interaction Types | Drug Claim Name | Drug Name | PMIDs |
| Page: 1 |

Copyright 2023-Present -The University of Texas Health Science Center at Houston |