Schematic overview of the cellular and molecular mechanisms involved in the cancer progression, including the proposed cellular and molecular mechanisms in cancer cells trajectory. AT1: alveolar type 1 cells; AT2: alveolar type 2 cells; AAH: atypical adenomatous hyperplasia; AIS: adenocarcinoma in situ; MIA: minimally invasive adenocarcinoma; IA: invasive adenocarcinoma; EMT: epithelial-mesenchymal transition

Home

Download

Statistics

Help

Contact

Center for Computational Systems Medicine
leaf

Gene summary

leaf

Malignant transformation analysis

leaf

Malignant transformation related pathway analysis

leaf

Cell-cell communication analysis

leaf

Single-cell gene regulatory network inference analysis

leaf

Somatic mutation of malignant transformation related genes

leaf

Related drugs of malignant transformation related genes

Gene: RTF1

Gene summary for RTF1

check button Gene summary.

Gene informationSpeciesHuman
Gene symbol

RTF1

Gene ID

23168

Gene nameRTF1 homolog, Paf1/RNA polymerase II complex component
Gene AliasGTL7
Cytomap15q15.1
Gene Typeprotein-coding
GO ID

GO:0000122

UniProtAcc

Q92541


Top

Malignant transformation analysis

check button Identification of the aberrant gene expression in precancerous and cancerous lesions by comparing the gene expression of stem-like cells in diseased tissues with normal stem cells
check button Malignant transformation involving gene list.
Entrez IDSymbolReplicatesSpeciesOrganTissueAdj P-valueLog2FCMalignancy
23168RTF1GSM4909286HumanBreastIDC8.87e-035.98e-030.1081
23168RTF1GSM4909290HumanBreastIDC5.85e-033.85e-010.2096
23168RTF1GSM4909293HumanBreastIDC8.01e-072.02e-010.1581
23168RTF1GSM4909294HumanBreastIDC6.35e-038.95e-020.2022
23168RTF1GSM4909296HumanBreastIDC2.98e-06-7.59e-020.1524
23168RTF1GSM4909297HumanBreastIDC1.08e-11-5.49e-020.1517
23168RTF1GSM4909301HumanBreastIDC6.17e-225.52e-010.1577
23168RTF1GSM4909306HumanBreastIDC2.37e-083.25e-010.1564
23168RTF1GSM4909307HumanBreastIDC3.48e-042.59e-010.1569
23168RTF1GSM4909308HumanBreastIDC3.02e-033.45e-010.158
23168RTF1GSM4909311HumanBreastIDC2.07e-28-2.38e-020.1534
23168RTF1GSM4909312HumanBreastIDC2.81e-111.00e-010.1552
23168RTF1GSM4909313HumanBreastIDC6.75e-032.16e-010.0391
23168RTF1GSM4909319HumanBreastIDC1.01e-393.41e-020.1563
23168RTF1GSM4909320HumanBreastIDC5.18e-052.30e-010.1575
23168RTF1GSM4909321HumanBreastIDC8.17e-121.46e-010.1559
23168RTF1brca3HumanBreastPrecancer1.91e-031.36e-01-0.0263
23168RTF1NCCBC14HumanBreastDCIS2.58e-12-1.35e-010.2021
23168RTF1NCCBC5HumanBreastDCIS2.59e-11-1.82e-010.2046
23168RTF1P1HumanBreastIDC6.85e-19-2.71e-010.1527
Page: 1 2 3 4 5 6 7 8 9 10 

check button Transcriptomic changes along malignancy continuum.
TissueExpression DynamicsAbbreviation
BreastThe image shows the transcriptomic changes along malignancy continuum.log2FC in expression of this searched gene in stem-like cells from each diseased tissue sample relative to stem-like cells in normal samples in each tissue plotted against the malignancy continuum. Samples are colored based on if they are from different disease stage.IDC: Invasive ductal carcinoma
DCIS: Ductal carcinoma in situ
Precancer(BRCA1-mut): Precancerous lesion from BRCA1 mutation carriers
EsophagusThe image shows the transcriptomic changes along malignancy continuum.log2FC in expression of this searched gene in stem-like cells from each diseased tissue sample relative to stem-like cells in normal samples in each tissue plotted against the malignancy continuum. Samples are colored based on if they are from different disease stage.
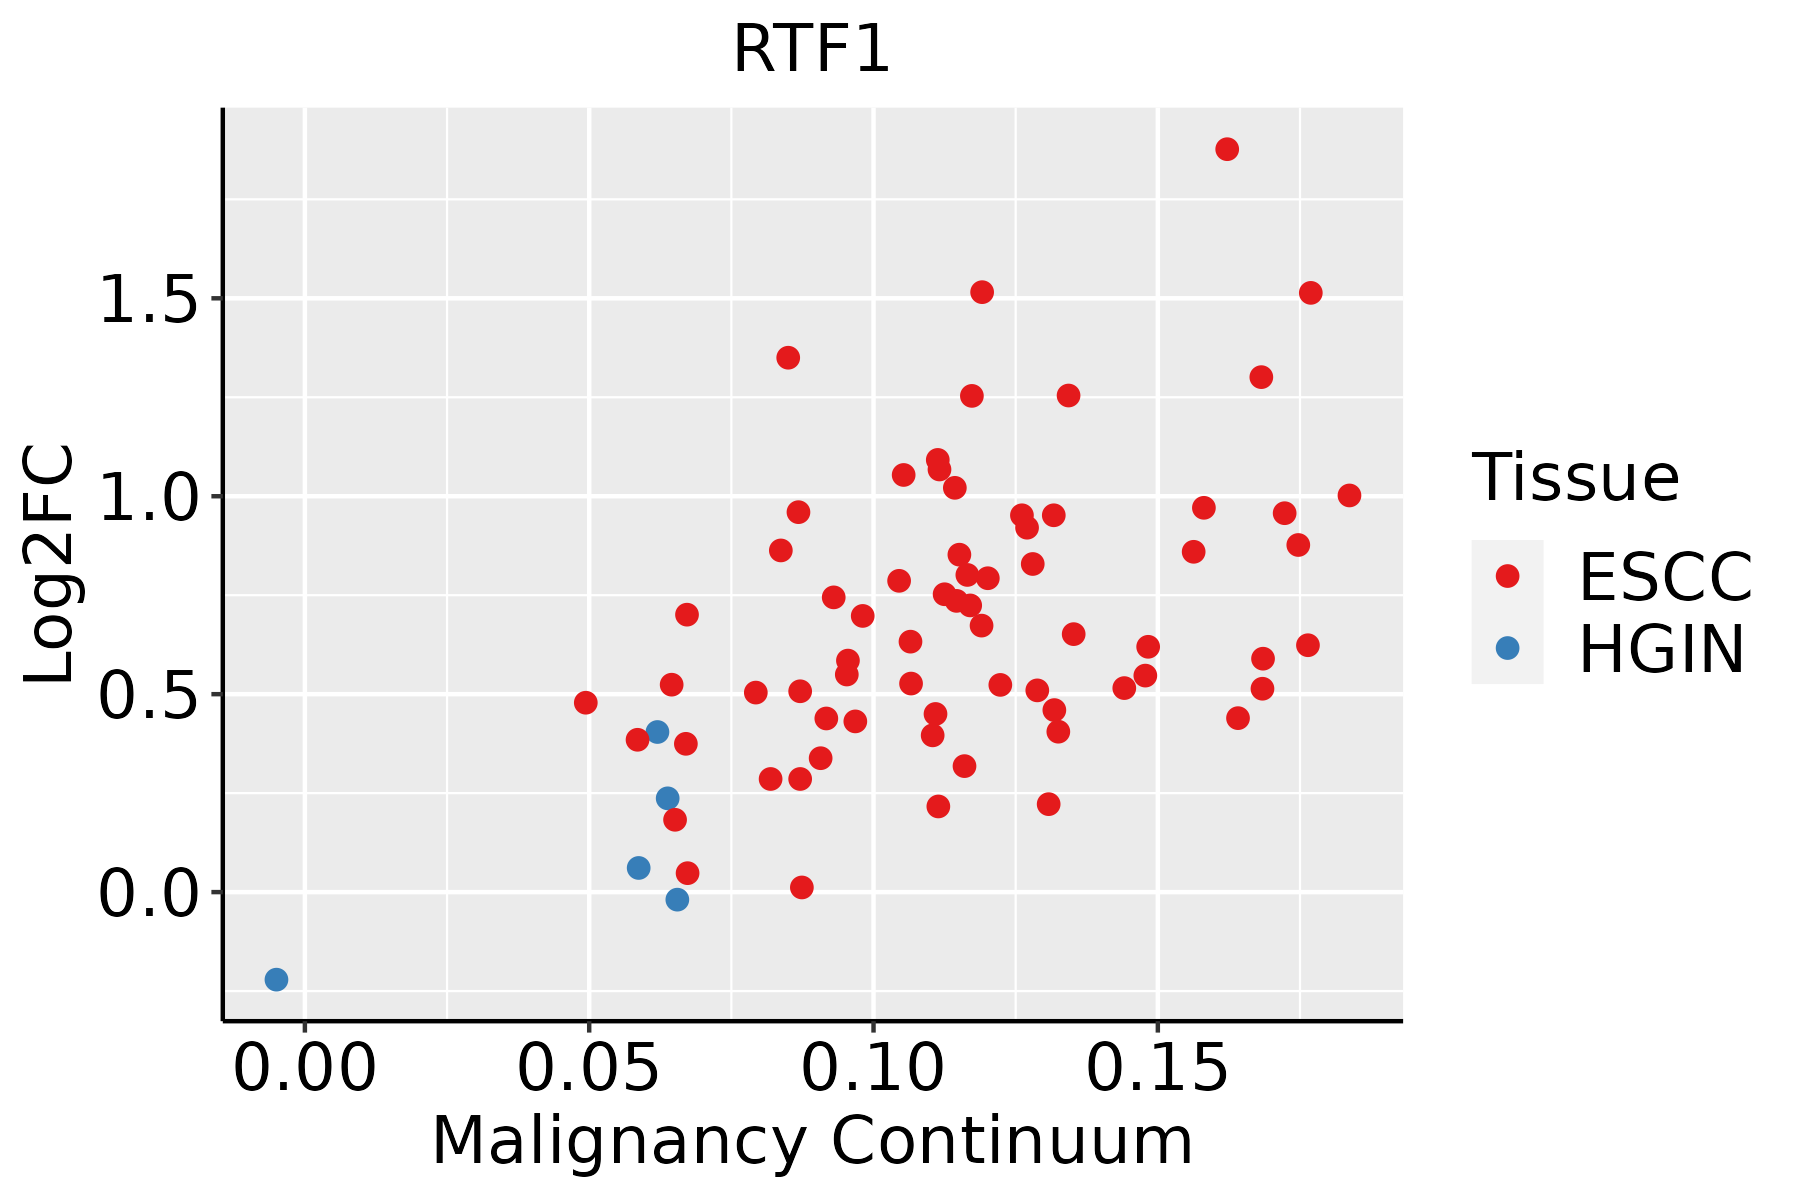
ESCC: Esophageal squamous cell carcinoma
HGIN: High-grade intraepithelial neoplasias
LGIN: Low-grade intraepithelial neoplasias
GCThe image shows the transcriptomic changes along malignancy continuum.log2FC in expression of this searched gene in stem-like cells from each diseased tissue sample relative to stem-like cells in normal samples in each tissue plotted against the malignancy continuum. Samples are colored based on if they are from different disease stage.
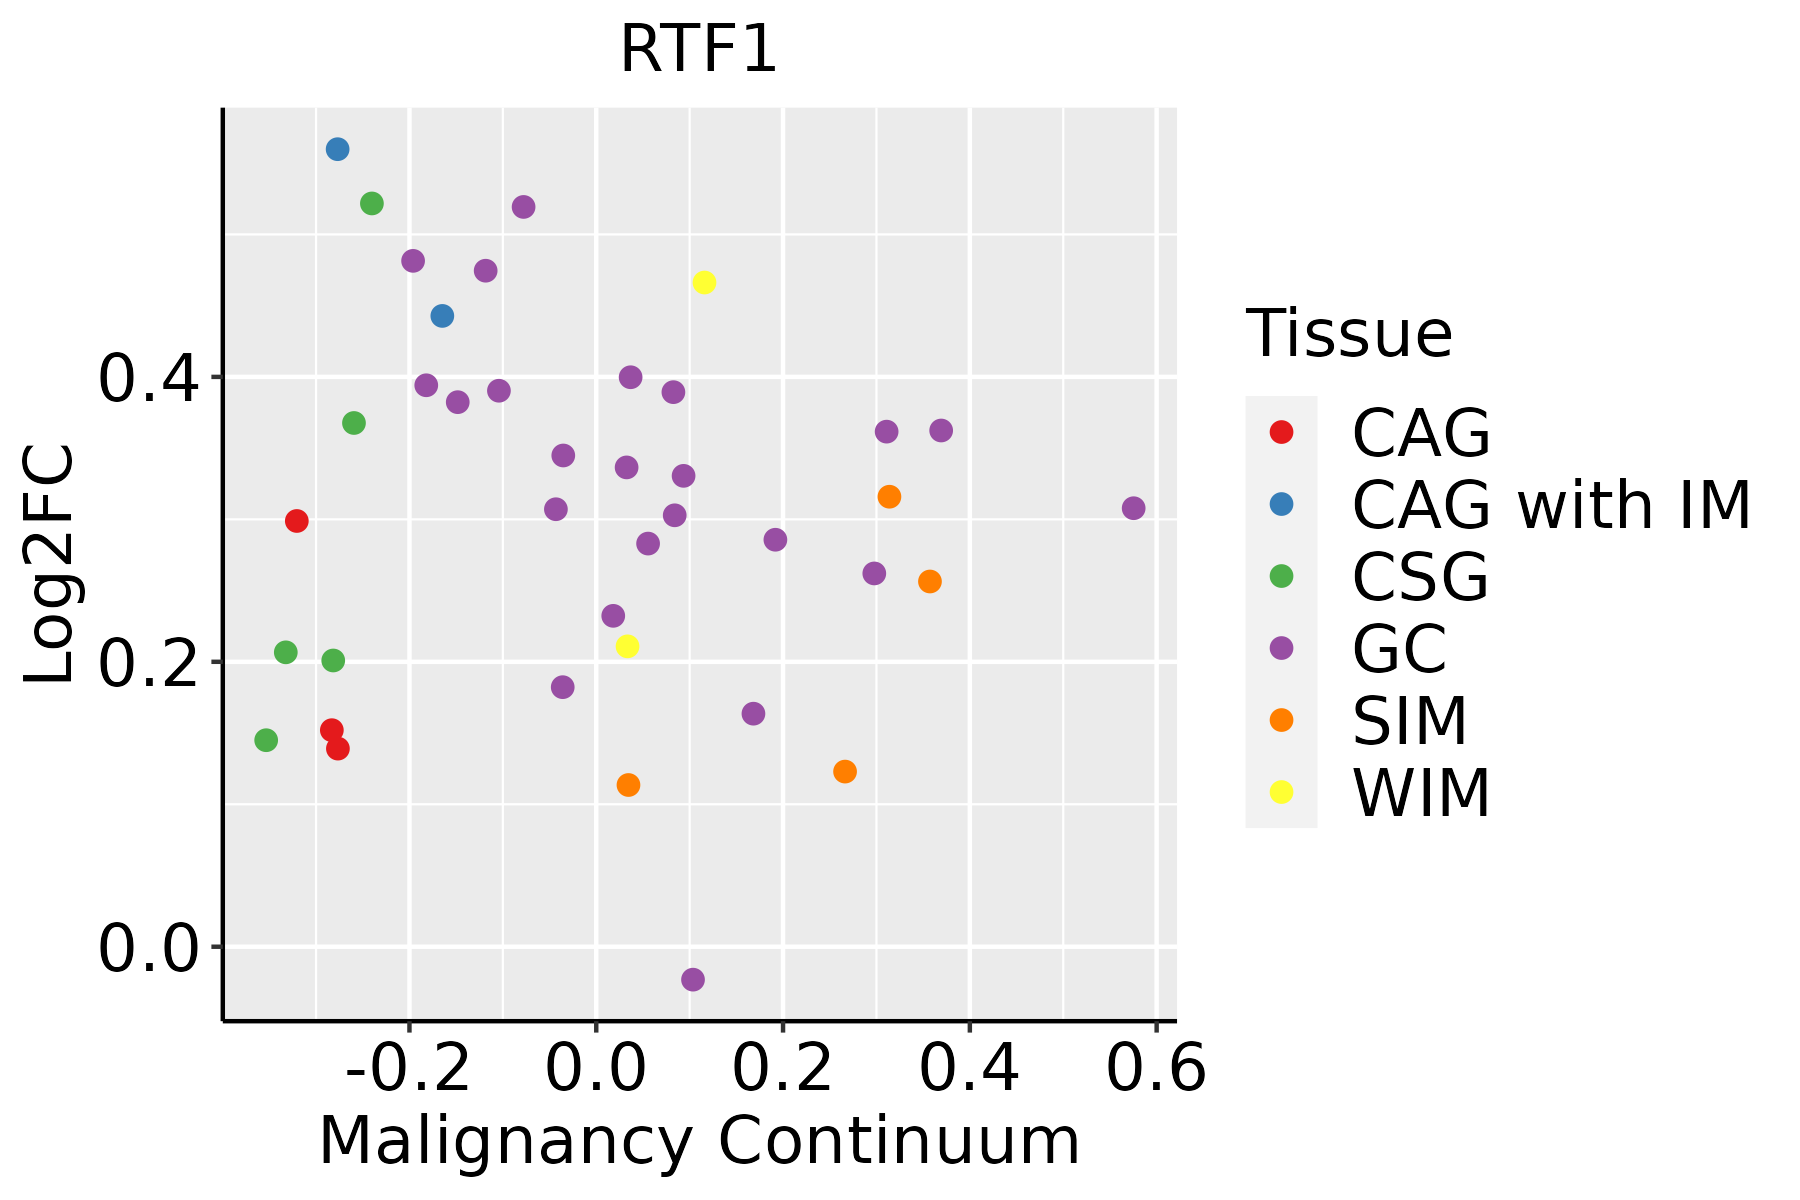
CAG: Chronic atrophic gastritis
CAG with IM: Chronic atrophic gastritis with intestinal metaplasia
CSG: Chronic superficial gastritis
GC: Gastric cancer
SIM: Severe intestinal metaplasia
WIM: Wild intestinal metaplasia
LiverThe image shows the transcriptomic changes along malignancy continuum.log2FC in expression of this searched gene in stem-like cells from each diseased tissue sample relative to stem-like cells in normal samples in each tissue plotted against the malignancy continuum. Samples are colored based on if they are from different disease stage.
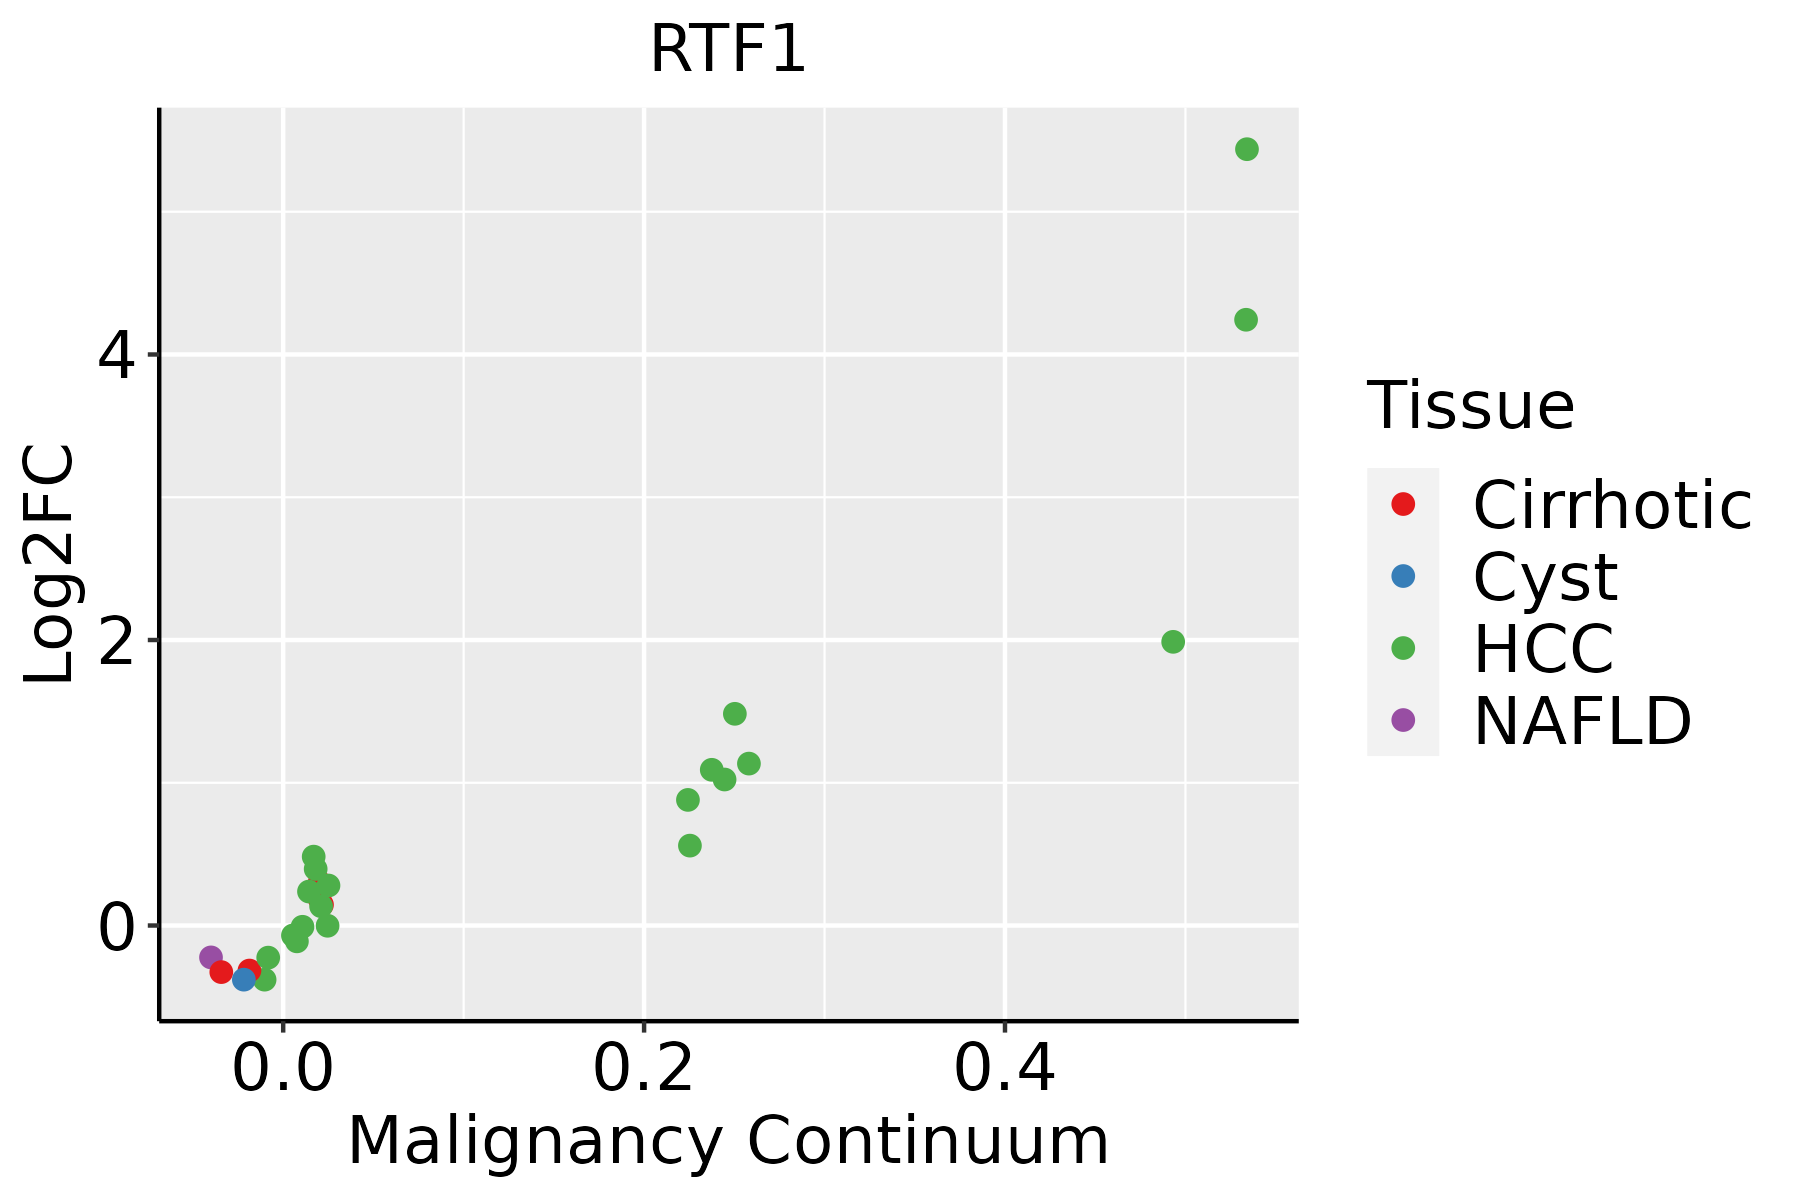
HCC: Hepatocellular carcinoma
NAFLD: Non-alcoholic fatty liver disease
Oral CavityThe image shows the transcriptomic changes along malignancy continuum.log2FC in expression of this searched gene in stem-like cells from each diseased tissue sample relative to stem-like cells in normal samples in each tissue plotted against the malignancy continuum. Samples are colored based on if they are from different disease stage.
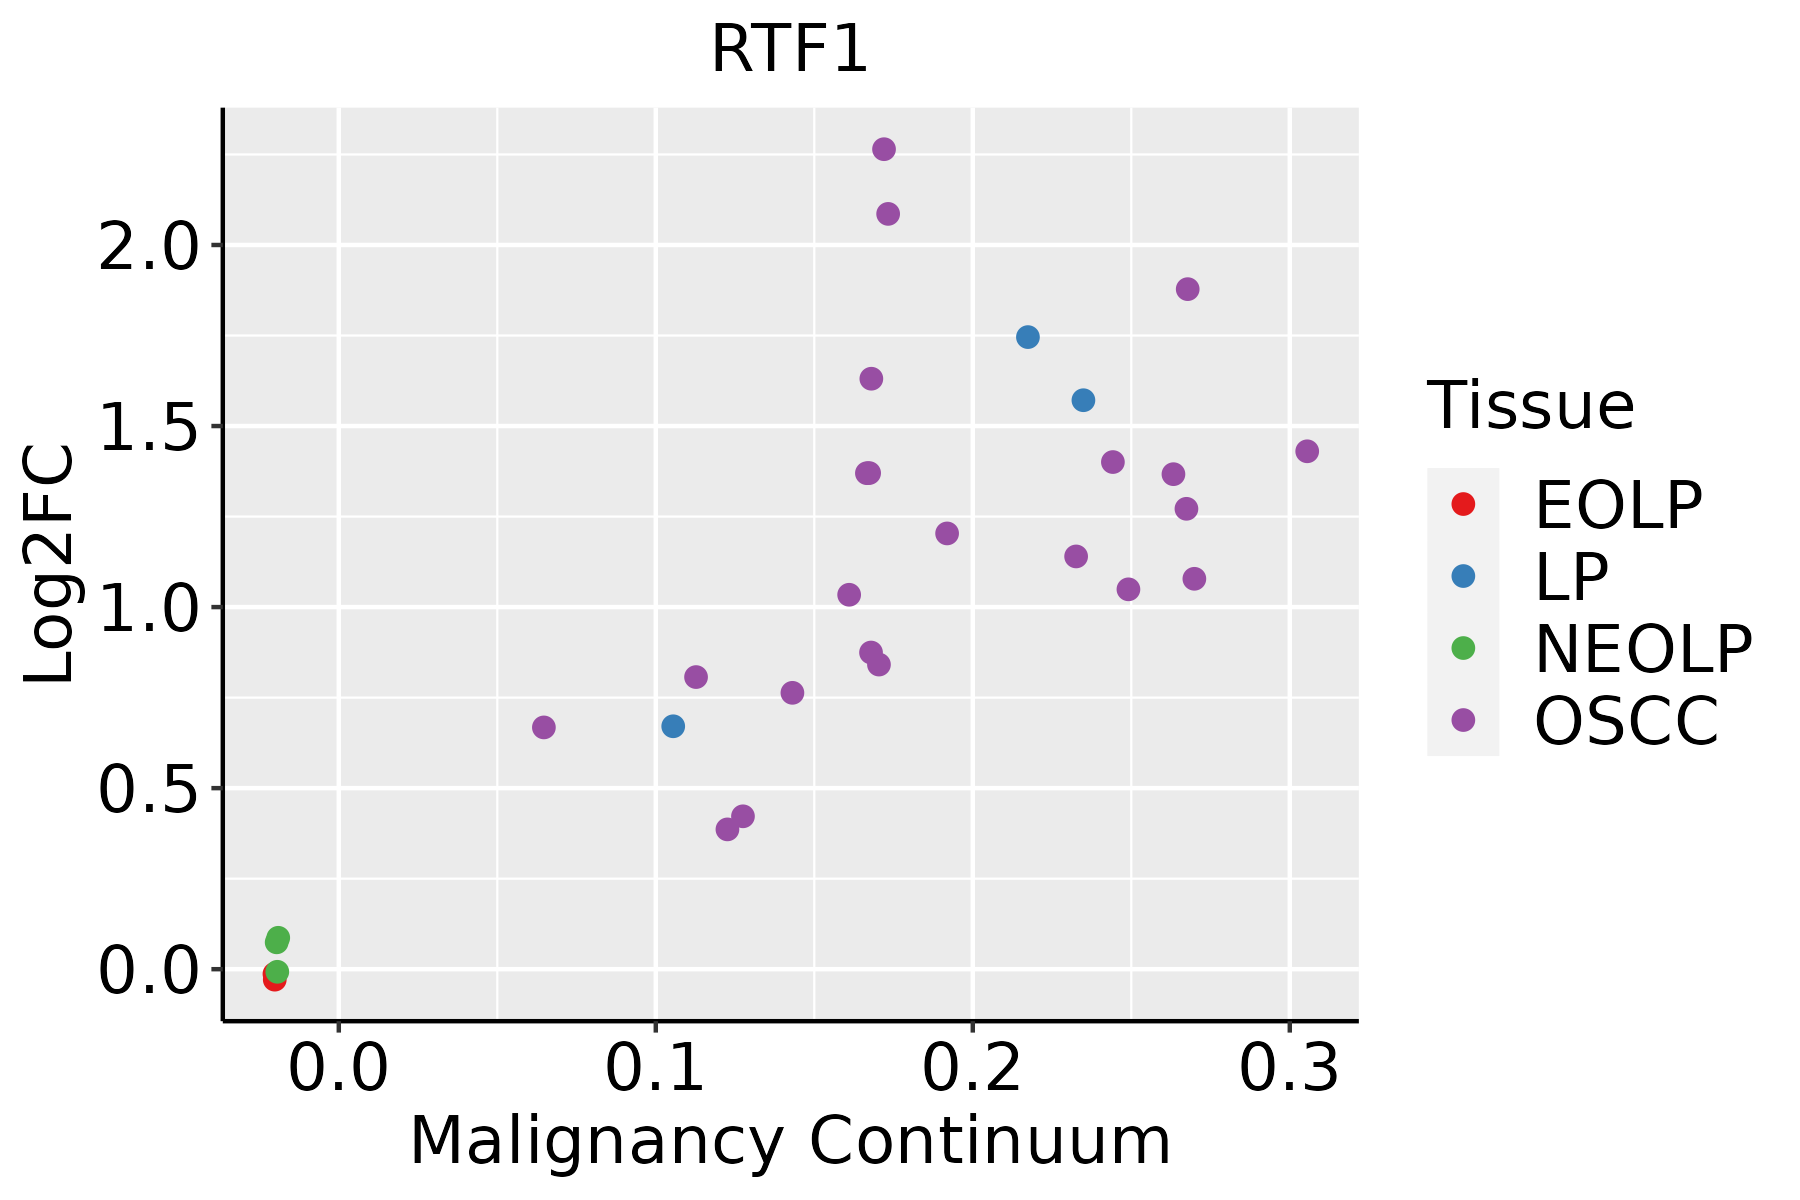
EOLP: Erosive Oral lichen planus
LP: leukoplakia
NEOLP: Non-erosive oral lichen planus
OSCC: Oral squamous cell carcinoma
ProstateThe image shows the transcriptomic changes along malignancy continuum.log2FC in expression of this searched gene in stem-like cells from each diseased tissue sample relative to stem-like cells in normal samples in each tissue plotted against the malignancy continuum. Samples are colored based on if they are from different disease stage.
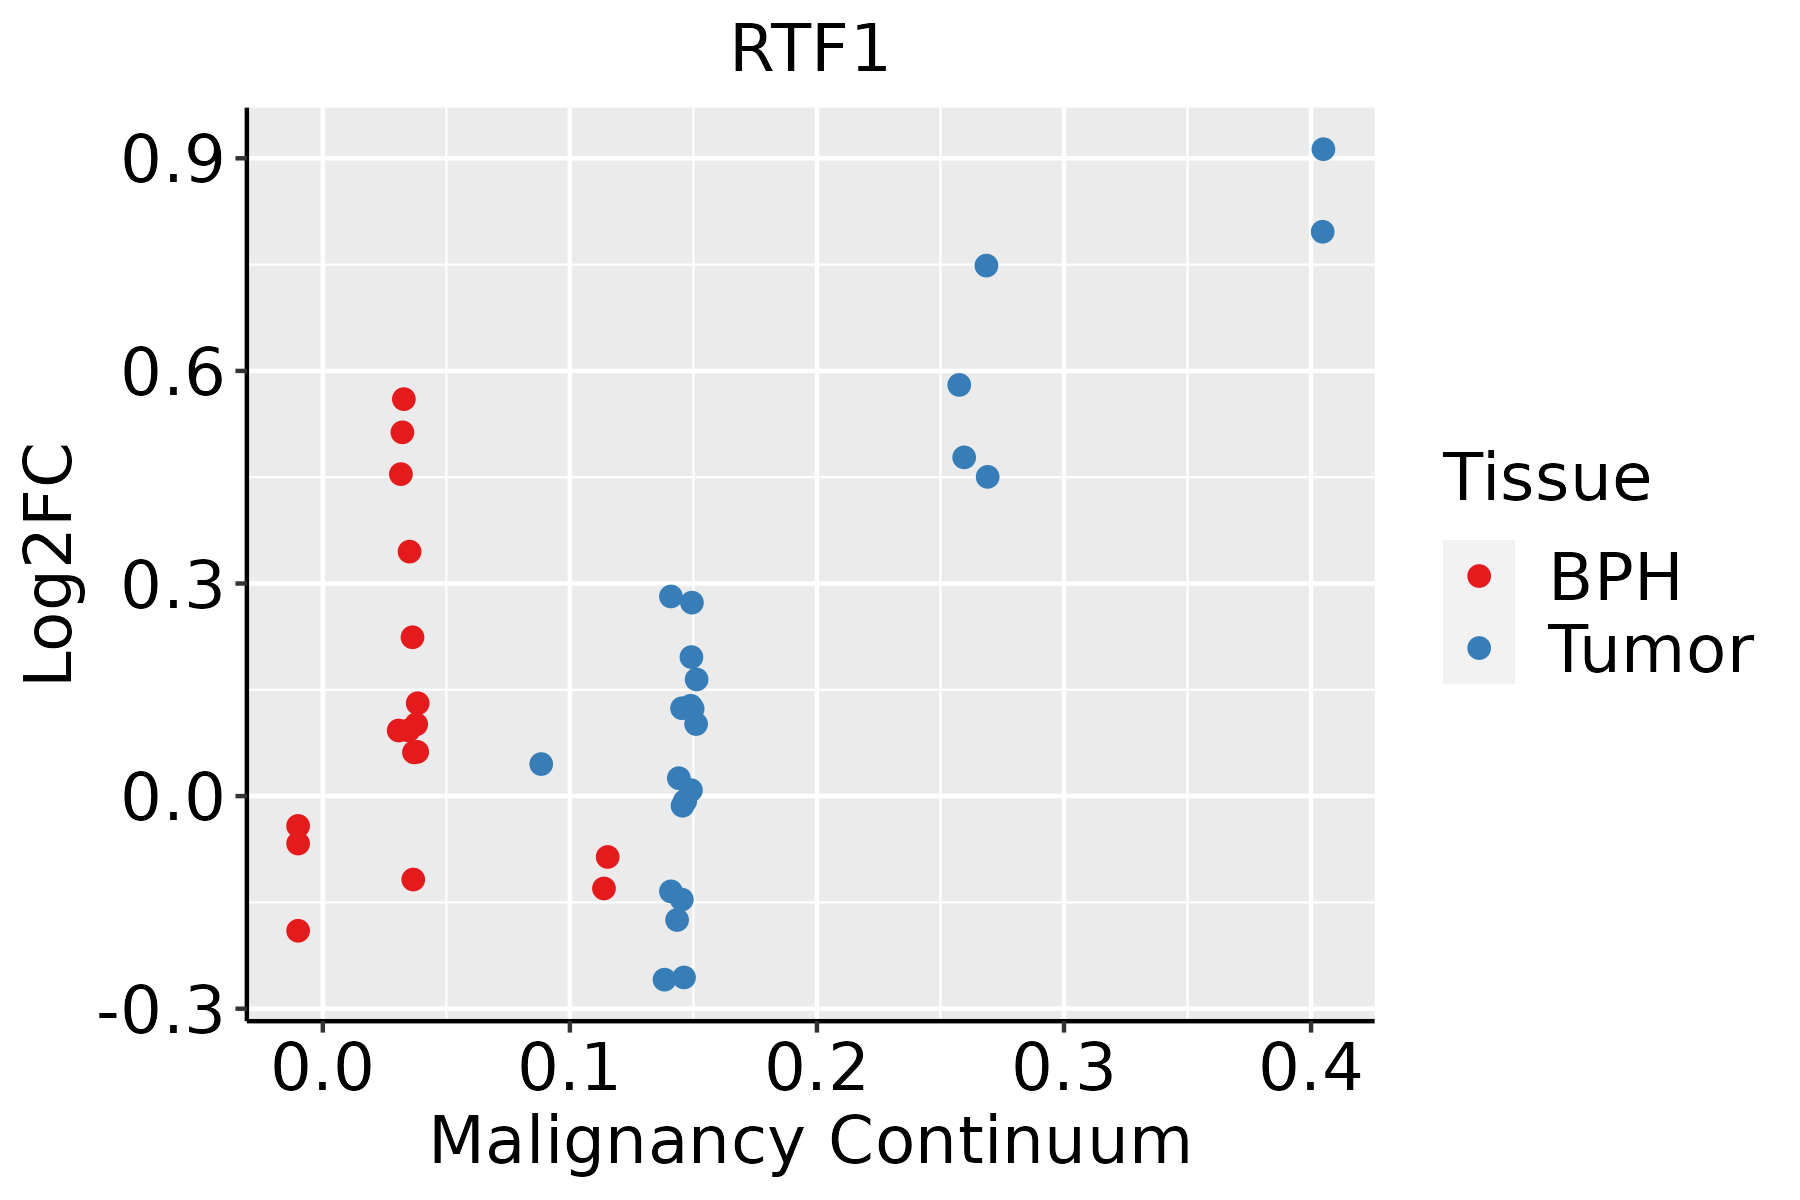
BPH: Benign Prostatic Hyperplasia
SkinThe image shows the transcriptomic changes along malignancy continuum.log2FC in expression of this searched gene in stem-like cells from each diseased tissue sample relative to stem-like cells in normal samples in each tissue plotted against the malignancy continuum. Samples are colored based on if they are from different disease stage.AK: Actinic keratosis
cSCC: Cutaneous squamous cell carcinoma
SCCIS:squamous cell carcinoma in situ
ThyroidThe image shows the transcriptomic changes along malignancy continuum.log2FC in expression of this searched gene in stem-like cells from each diseased tissue sample relative to stem-like cells in normal samples in each tissue plotted against the malignancy continuum. Samples are colored based on if they are from different disease stage.ATC: Anaplastic thyroid cancer
HT: Hashimoto's thyroiditis
PTC: Papillary thyroid cancer
∗log2FC in expression of this searched gene in stem-like cells from each diseased tissue sample relative to stem-like cells in normal samples in each tissue plotted against the malignancy continuum. Samples are colored based on if they are from different disease stage.

Top

Malignant transformation related pathway analysis

check buttonFind out the enriched GO biological processes and KEGG pathways involved in transition from healthy to precancer to cancer
check button Figure of enriched GO biological processes.
TissueDisease StageEnriched GO biological Processes
ColorectumADGO analysis - Figure of enriched GO biological processes: Top 15 enriched GO BP terms are showed in the bar plot of each disease state in each tissue. Each row represents a significant GO biological process which is colored according to the -log10(p.adjust).
ColorectumSERGO analysis - Figure of enriched GO biological processes: Top 15 enriched GO BP terms are showed in the bar plot of each disease state in each tissue. Each row represents a significant GO biological process which is colored according to the -log10(p.adjust).
ColorectumMSSGO analysis - Figure of enriched GO biological processes: Top 15 enriched GO BP terms are showed in the bar plot of each disease state in each tissue. Each row represents a significant GO biological process which is colored according to the -log10(p.adjust).
ColorectumMSI-HGO analysis - Figure of enriched GO biological processes: Top 15 enriched GO BP terms are showed in the bar plot of each disease state in each tissue. Each row represents a significant GO biological process which is colored according to the -log10(p.adjust).
ColorectumFAPGO analysis - Figure of enriched GO biological processes: Top 15 enriched GO BP terms are showed in the bar plot of each disease state in each tissue. Each row represents a significant GO biological process which is colored according to the -log10(p.adjust).
∗Top 15 enriched GO BP terms are showed in the bar plot of each disease state in each tissue. Each row represents a significant GO biological process which is colored according to the -log10(p.adjust).
Page: 1 2 3 4 5 6 7 8 9 

check button Enriched GO biological processes.
GO IDTissueDisease StageDescriptionGene RatioBg Ratiopvaluep.adjustCount
GO:00017017BreastPrecancerin utero embryonic development35/1080367/187232.47e-032.27e-0235
GO:000170113BreastIDCin utero embryonic development42/1434367/187235.85e-034.24e-0242
GO:000170122BreastDCISin utero embryonic development41/1390367/187235.74e-034.13e-0241
GO:00182057EsophagusHGINpeptidyl-lysine modification88/2587376/187232.99e-071.39e-0588
GO:00198277EsophagusHGINstem cell population maintenance39/2587131/187231.63e-066.14e-0539
GO:00987278EsophagusHGINmaintenance of cell number39/2587134/187233.02e-061.03e-0439
GO:00063687EsophagusHGINtranscription elongation from RNA polymerase II promoter24/258769/187238.93e-062.64e-0424
GO:00063548EsophagusHGINDNA-templated transcription, elongation27/258791/187236.62e-051.52e-0327
GO:000170118EsophagusHGINin utero embryonic development77/2587367/187239.56e-052.05e-0377
GO:00165708EsophagusHGINhistone modification92/2587463/187231.70e-043.30e-0392
GO:00018244EsophagusHGINblastocyst development28/2587106/187234.30e-046.47e-0328
GO:00310568EsophagusHGINregulation of histone modification36/2587152/187237.06e-049.52e-0336
GO:00310604EsophagusHGINregulation of histone methylation19/258769/187232.03e-032.13e-0219
GO:001605516EsophagusHGINWnt signaling pathway83/2587444/187232.27e-032.33e-0283
GO:00515714EsophagusHGINpositive regulation of histone H3-K4 methylation8/258719/187232.40e-032.41e-028
GO:019873816EsophagusHGINcell-cell signaling by wnt83/2587446/187232.58e-032.55e-0283
GO:00310624EsophagusHGINpositive regulation of histone methylation13/258741/187232.62e-032.58e-0213
GO:00349688EsophagusHGINhistone lysine methylation27/2587115/187233.51e-033.24e-0227
GO:00064798EsophagusHGINprotein methylation38/2587181/187235.05e-034.22e-0238
GO:00082138EsophagusHGINprotein alkylation38/2587181/187235.05e-034.22e-0238
Page: 1 2 3 4 5 6 7 8 9 10 11 12 13 14 

check button Enriched KEGG pathways.
Pathway IDTissueDisease StageDescriptionGene RatioBg Ratiopvaluep.adjustqvalueCount
Page: 1 

Top

Cell-cell communication analysis

check buttonIdentification of potential cell-cell interactions between two cell types and their ligand-receptor pairs for different disease states
LigandReceptorLRpairPathwayTissueDisease Stage
Page: 1 

Top

Single-cell gene regulatory network inference analysis

check buttonFind out the significant the regulons (TFs) and the target genes of each regulon across cell types for different disease states
TFCell TypeTissueDisease StageTarget GeneRSSRegulon Activity
∗The dot plots of a searched regulon are shown for all cell subpopulations in each disease state of each tissue based on the regulon specific score inferred using pySCENIC and by calculating the average expression.
Page: 1 

Top

Somatic mutation of malignant transformation related genes

check buttonAnnotation of somatic variants for genes involved in malignant transformation
Hugo SymbolVariant ClassVariant ClassificationdbSNP RSHGVScHGVSpHGVSp ShortSWISSPROTBIOTYPESIFTPolyPhenTumor Sample BarcodeTissueHistologySexAgeStageTherapy TypesDrugsOutcome
RTF1SNVMissense_Mutationrs764850999c.518C>Tp.Ser173Leup.S173LQ92541protein_codingtolerated(0.15)possibly_damaging(0.879)TCGA-AC-A23H-01Breastbreast invasive carcinomaFemale>=65I/IIUnknownUnknownPD
RTF1SNVMissense_Mutationc.611G>Cp.Arg204Thrp.R204TQ92541protein_codingdeleterious(0)probably_damaging(0.915)TCGA-AN-A0FS-01Breastbreast invasive carcinomaFemale<65I/IIUnknownUnknownSD
RTF1SNVMissense_Mutationnovelc.662N>Tp.Arg221Ilep.R221IQ92541protein_codingdeleterious(0)probably_damaging(0.991)TCGA-AO-A128-01Breastbreast invasive carcinomaFemale<65I/IIChemotherapydoxorubicinSD
RTF1SNVMissense_Mutationc.601G>Ap.Glu201Lysp.E201KQ92541protein_codingdeleterious(0)probably_damaging(0.978)TCGA-C8-A8HQ-01Breastbreast invasive carcinomaFemale<65I/IIUnknownUnknownSD
RTF1insertionNonsense_Mutationnovelc.2076_2077insACACGATTTTGATGTGAAGATTGACTTACAAGTTCCCAp.Ala693ThrfsTer4p.A693Tfs*4Q92541protein_codingTCGA-A8-A07U-01Breastbreast invasive carcinomaFemale>=65III/IVChemotherapy5-fluorouracilSD
RTF1insertionNonsense_Mutationnovelc.1614_1615insGGGCTGCAACTACGGTAGGAGGCACTTCTGGGGTAGCTTp.Gln538_Leu539insGlyLeuGlnLeuArgTerGluAlaLeuLeuGlyTerLeup.Q538_L539insGLQLR*EALLG*LQ92541protein_codingTCGA-A8-A0A4-01Breastbreast invasive carcinomaFemale>=65I/IIHormone TherapytamoxiphenCR
RTF1insertionFrame_Shift_Insnovelc.597_598insTTAGCCACAAAACGGAATGAAATAATGGCCTTTGCAGCAACTTCp.Thr200LeufsTer28p.T200Lfs*28Q92541protein_codingTCGA-AN-A04A-01Breastbreast invasive carcinomaFemale<65III/IVUnknownUnknownSD
RTF1SNVMissense_Mutationnovelc.1126N>Tp.Pro376Serp.P376SQ92541protein_codingdeleterious(0)probably_damaging(0.987)TCGA-2W-A8YY-01Cervixcervical & endocervical cancerFemale<65I/IIChemotherapycisplatinCR
RTF1SNVMissense_Mutationnovelc.1643N>Tp.Ala548Valp.A548VQ92541protein_codingtolerated(0.09)probably_damaging(0.935)TCGA-2W-A8YY-01Cervixcervical & endocervical cancerFemale<65I/IIChemotherapycisplatinCR
RTF1SNVMissense_Mutationc.1269C>Gp.Asn423Lysp.N423KQ92541protein_codingdeleterious(0)probably_damaging(0.982)TCGA-Q1-A73O-01Cervixcervical & endocervical cancerFemale<65I/IIChemotherapycisplatinCR
Page: 1 2 3 4 5 6 7 

Top

Related drugs of malignant transformation related genes

check buttonIdentification of chemicals and drugs interact with genes involved in malignant transfromation
(DGIdb 4.0)
Entrez IDSymbolCategoryInteraction TypesDrug Claim NameDrug NamePMIDs
Page: 1