
|
|||||
|
 | |
| |
| |
| |
| |
| |
|
Gene: RTCB |
Gene summary for RTCB |
| Gene information | Species | Human | Gene symbol | RTCB | Gene ID | 51493 |
| Gene name | RNA 2',3'-cyclic phosphate and 5'-OH ligase | |
| Gene Alias | C22orf28 | |
| Cytomap | 22q12.3 | |
| Gene Type | protein-coding | GO ID | GO:0000378 | UniProtAcc | Q9Y3I0 |
Top |
Malignant transformation analysis |
| Identification of the aberrant gene expression in precancerous and cancerous lesions by comparing the gene expression of stem-like cells in diseased tissues with normal stem cells |
| Entrez ID | Symbol | Replicates | Species | Organ | Tissue | Adj P-value | Log2FC | Malignancy |
| 51493 | RTCB | HTA11_3410_2000001011 | Human | Colorectum | AD | 1.91e-02 | 8.89e-02 | 0.0155 |
| 51493 | RTCB | HTA11_2487_2000001011 | Human | Colorectum | SER | 4.67e-06 | 5.55e-01 | -0.1808 |
| 51493 | RTCB | HTA11_1938_2000001011 | Human | Colorectum | AD | 2.40e-05 | 5.23e-01 | -0.0811 |
| 51493 | RTCB | HTA11_78_2000001011 | Human | Colorectum | AD | 5.61e-07 | 4.85e-01 | -0.1088 |
| 51493 | RTCB | HTA11_347_2000001011 | Human | Colorectum | AD | 3.75e-16 | 6.58e-01 | -0.1954 |
| 51493 | RTCB | HTA11_2112_2000001011 | Human | Colorectum | SER | 2.33e-02 | 6.88e-01 | -0.2196 |
| 51493 | RTCB | HTA11_83_2000001011 | Human | Colorectum | SER | 6.92e-03 | 4.75e-01 | -0.1526 |
| 51493 | RTCB | HTA11_696_2000001011 | Human | Colorectum | AD | 7.35e-12 | 6.33e-01 | -0.1464 |
| 51493 | RTCB | HTA11_1391_2000001011 | Human | Colorectum | AD | 1.98e-07 | 6.22e-01 | -0.059 |
| 51493 | RTCB | HTA11_2992_2000001011 | Human | Colorectum | SER | 2.88e-04 | 7.03e-01 | -0.1706 |
| 51493 | RTCB | HTA11_7696_3000711011 | Human | Colorectum | AD | 1.53e-02 | 3.25e-01 | 0.0674 |
| 51493 | RTCB | HTA11_99999971662_82457 | Human | Colorectum | MSS | 7.43e-07 | 6.23e-01 | 0.3859 |
| 51493 | RTCB | A015-C-203 | Human | Colorectum | FAP | 3.08e-13 | -2.81e-01 | -0.1294 |
| 51493 | RTCB | A002-C-201 | Human | Colorectum | FAP | 6.11e-07 | -2.38e-01 | 0.0324 |
| 51493 | RTCB | A001-C-119 | Human | Colorectum | FAP | 1.32e-04 | -2.81e-01 | -0.1557 |
| 51493 | RTCB | A001-C-108 | Human | Colorectum | FAP | 1.27e-11 | -2.76e-01 | -0.0272 |
| 51493 | RTCB | A002-C-205 | Human | Colorectum | FAP | 1.01e-09 | -3.06e-01 | -0.1236 |
| 51493 | RTCB | A015-C-006 | Human | Colorectum | FAP | 1.14e-06 | -3.04e-01 | -0.0994 |
| 51493 | RTCB | A015-C-106 | Human | Colorectum | FAP | 4.54e-04 | -2.38e-01 | -0.0511 |
| 51493 | RTCB | A002-C-114 | Human | Colorectum | FAP | 1.26e-10 | -3.49e-01 | -0.1561 |
| Page: 1 2 3 4 5 6 7 8 9 |
| Tissue | Expression Dynamics | Abbreviation |
| Colorectum (GSE201348) |  | FAP: Familial adenomatous polyposis |
| CRC: Colorectal cancer | ||
| Colorectum (HTA11) |  | AD: Adenomas |
| SER: Sessile serrated lesions | ||
| MSI-H: Microsatellite-high colorectal cancer | ||
| MSS: Microsatellite stable colorectal cancer | ||
| Esophagus |  | ESCC: Esophageal squamous cell carcinoma |
| HGIN: High-grade intraepithelial neoplasias | ||
| LGIN: Low-grade intraepithelial neoplasias | ||
| Liver | 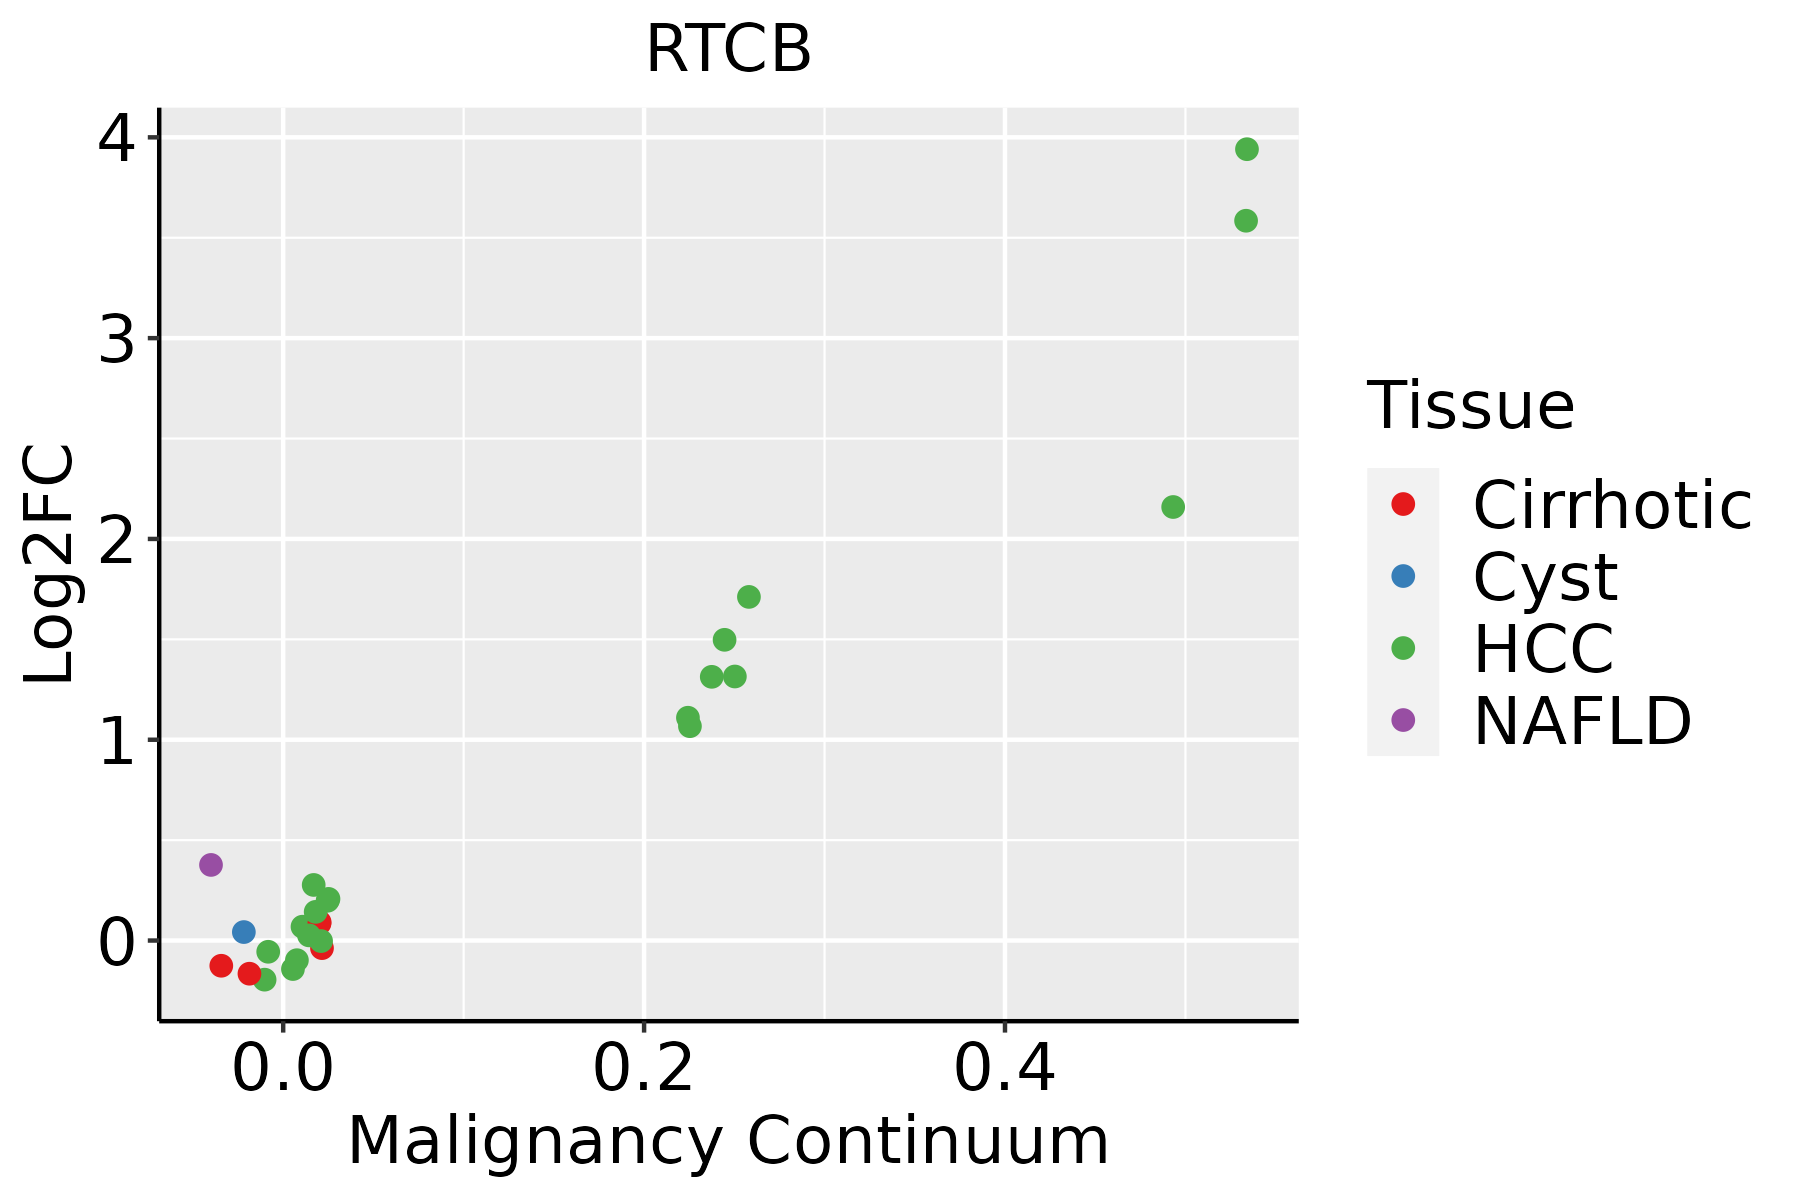 | HCC: Hepatocellular carcinoma |
| NAFLD: Non-alcoholic fatty liver disease | ||
| Oral Cavity | 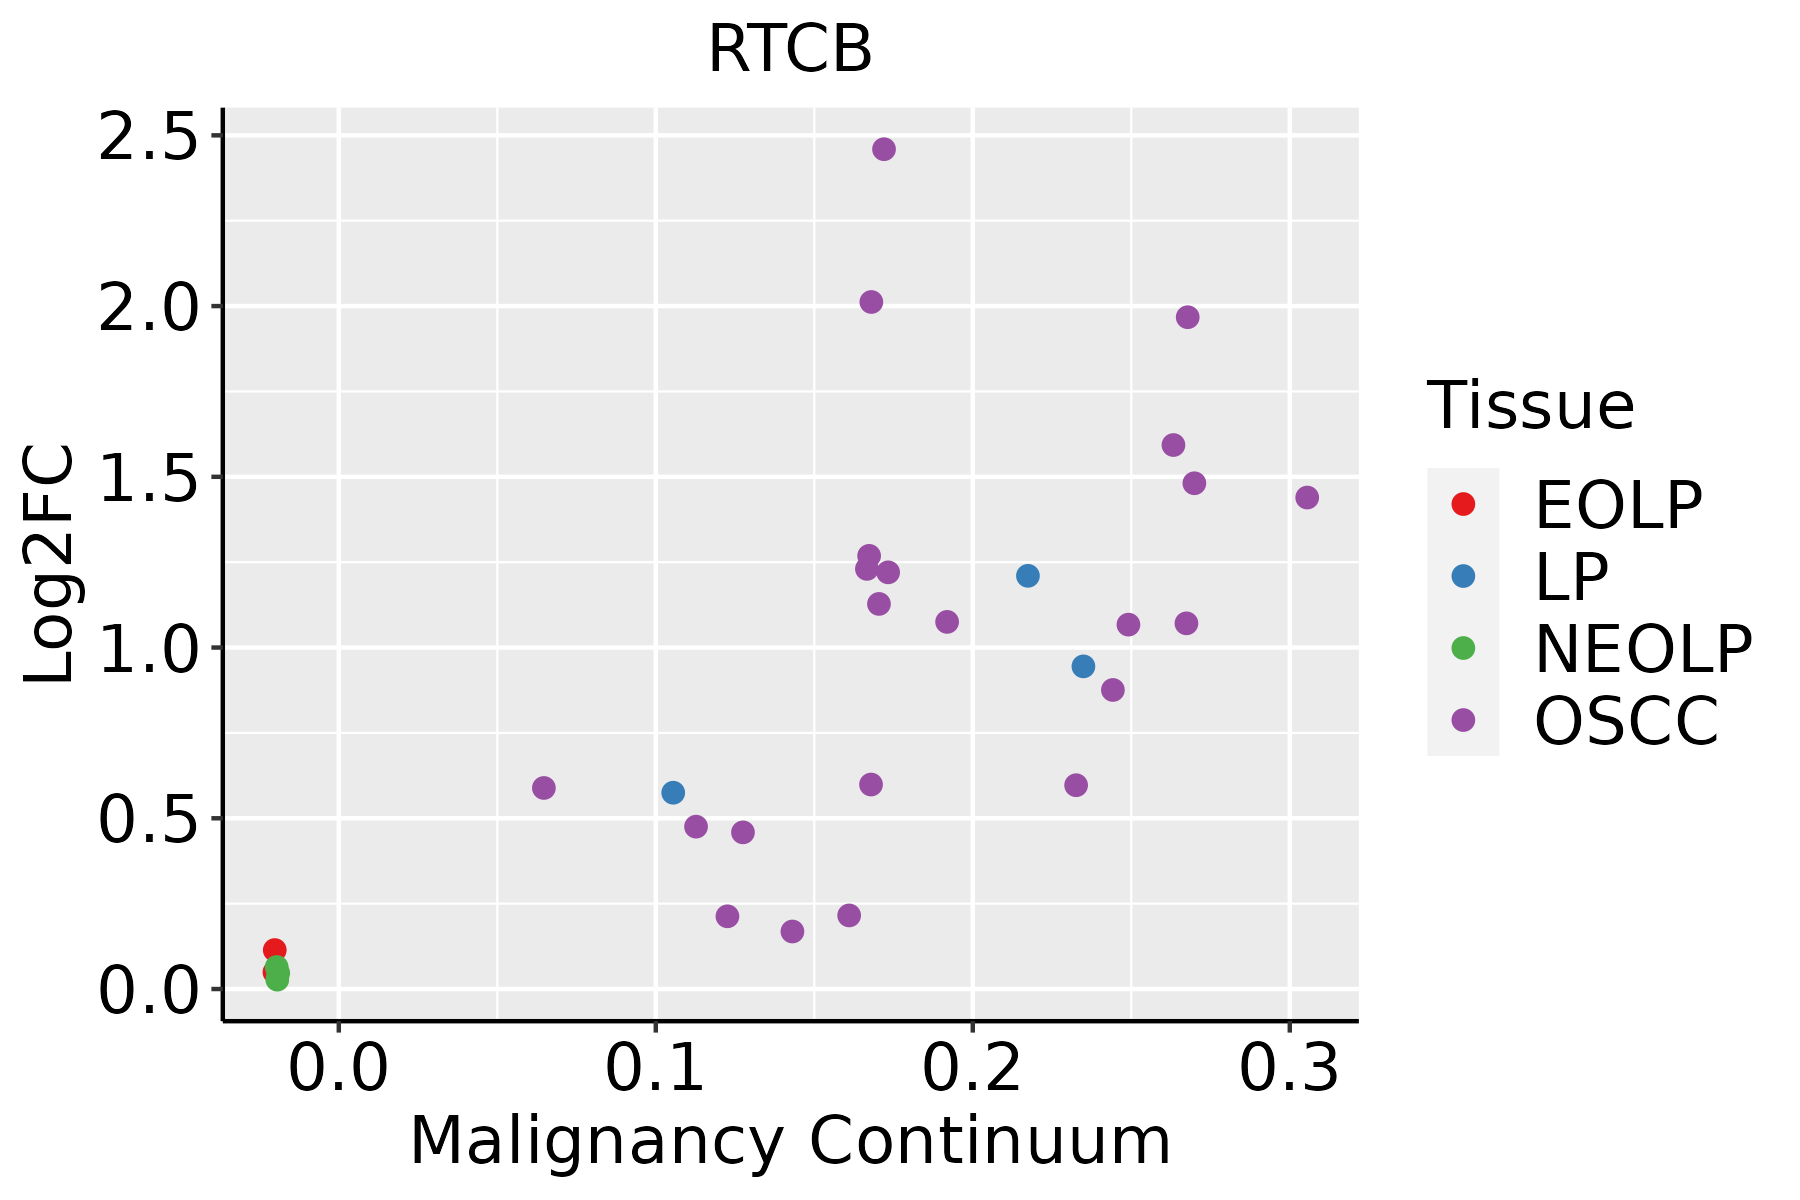 | EOLP: Erosive Oral lichen planus |
| LP: leukoplakia | ||
| NEOLP: Non-erosive oral lichen planus | ||
| OSCC: Oral squamous cell carcinoma | ||
| Prostate | 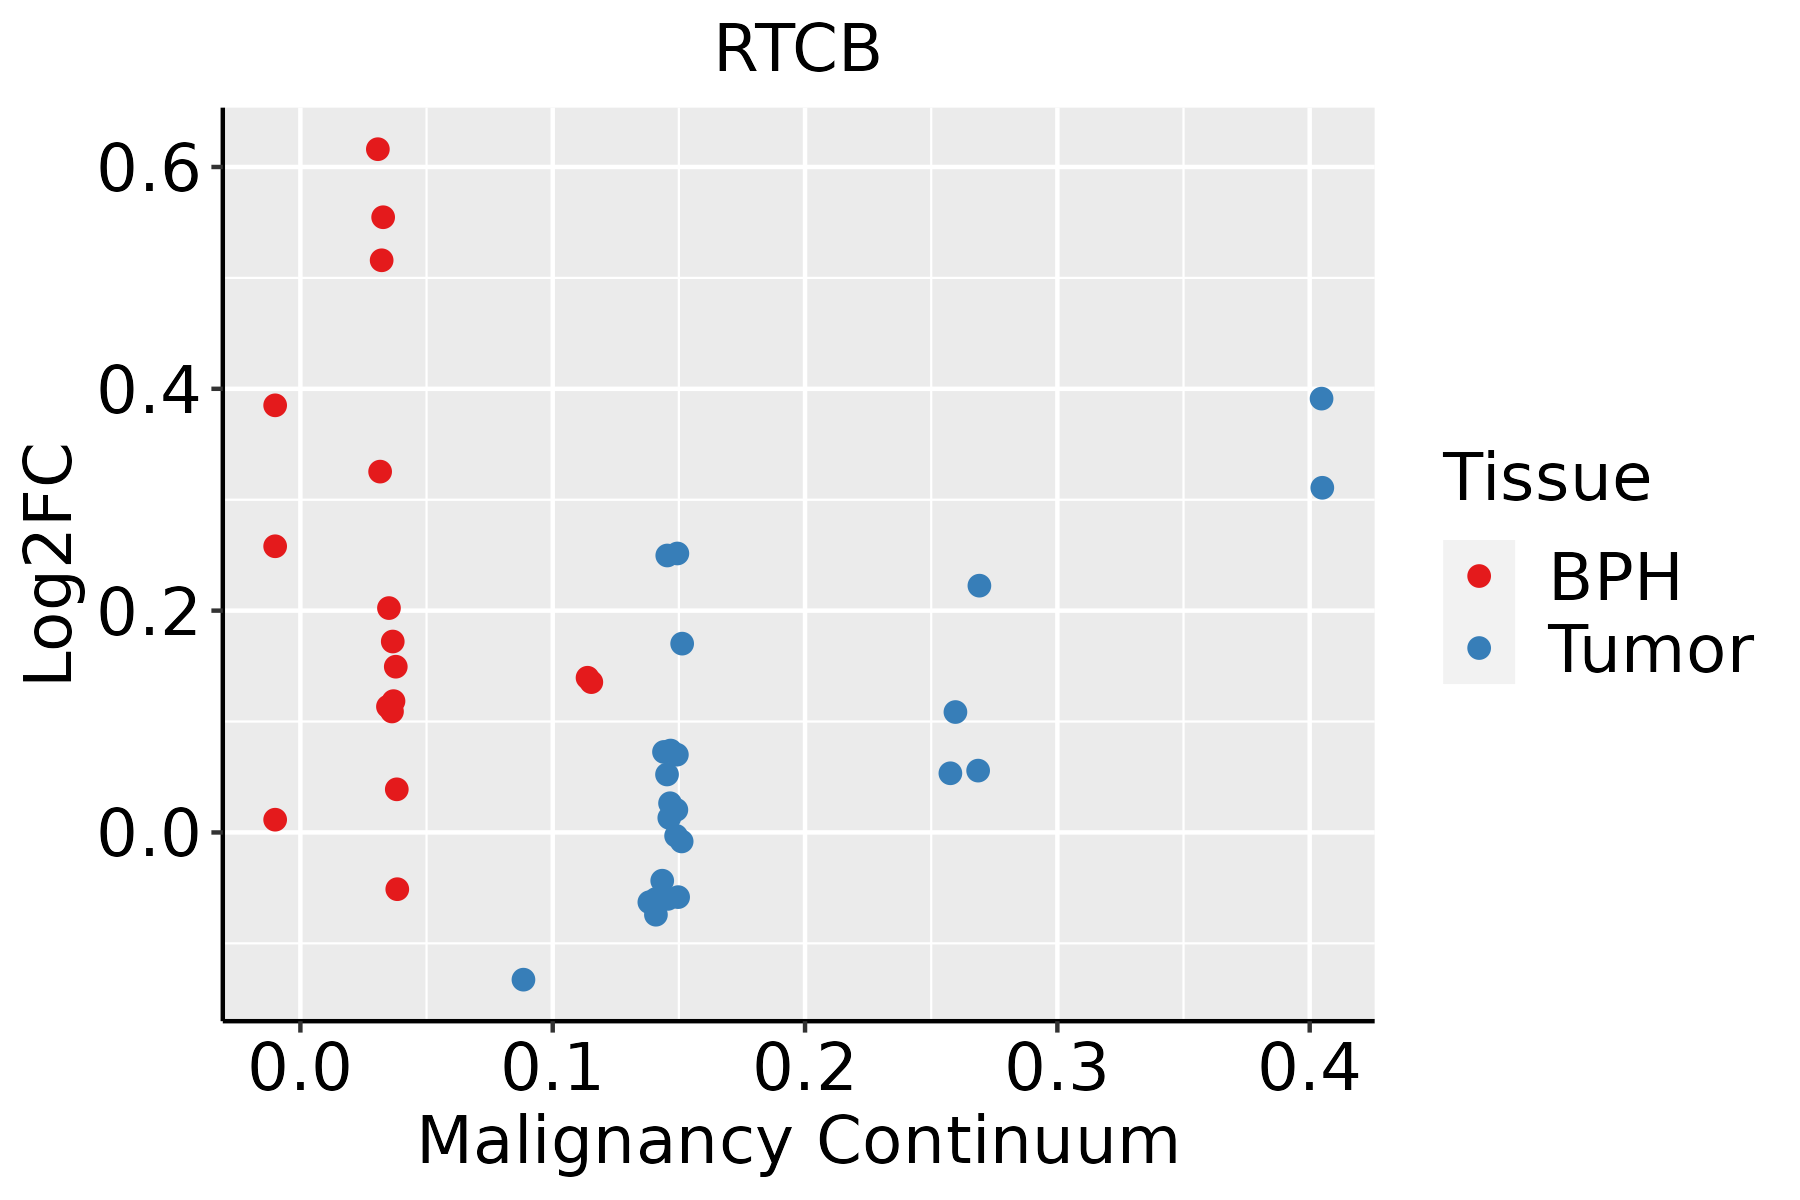 | BPH: Benign Prostatic Hyperplasia |
| Skin | 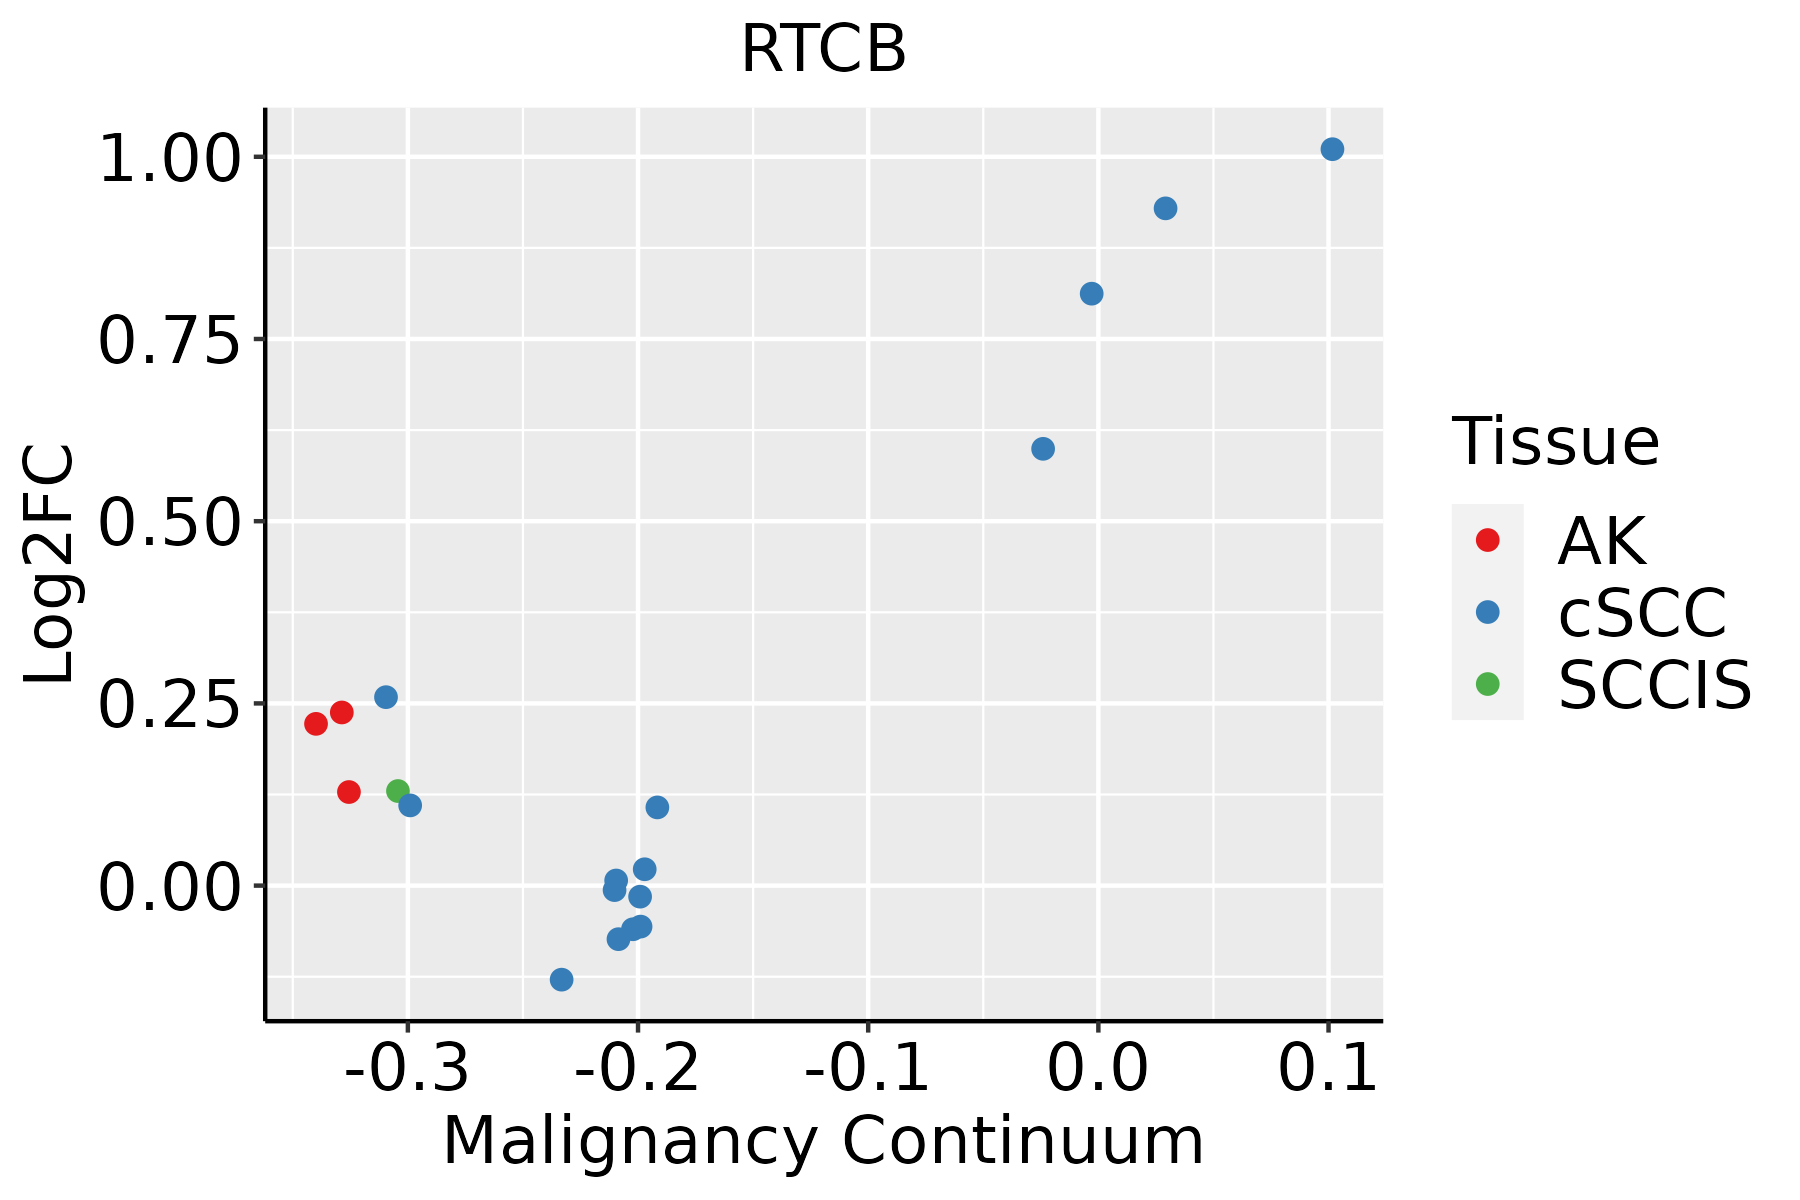 | AK: Actinic keratosis |
| cSCC: Cutaneous squamous cell carcinoma | ||
| SCCIS:squamous cell carcinoma in situ | ||
| Thyroid | 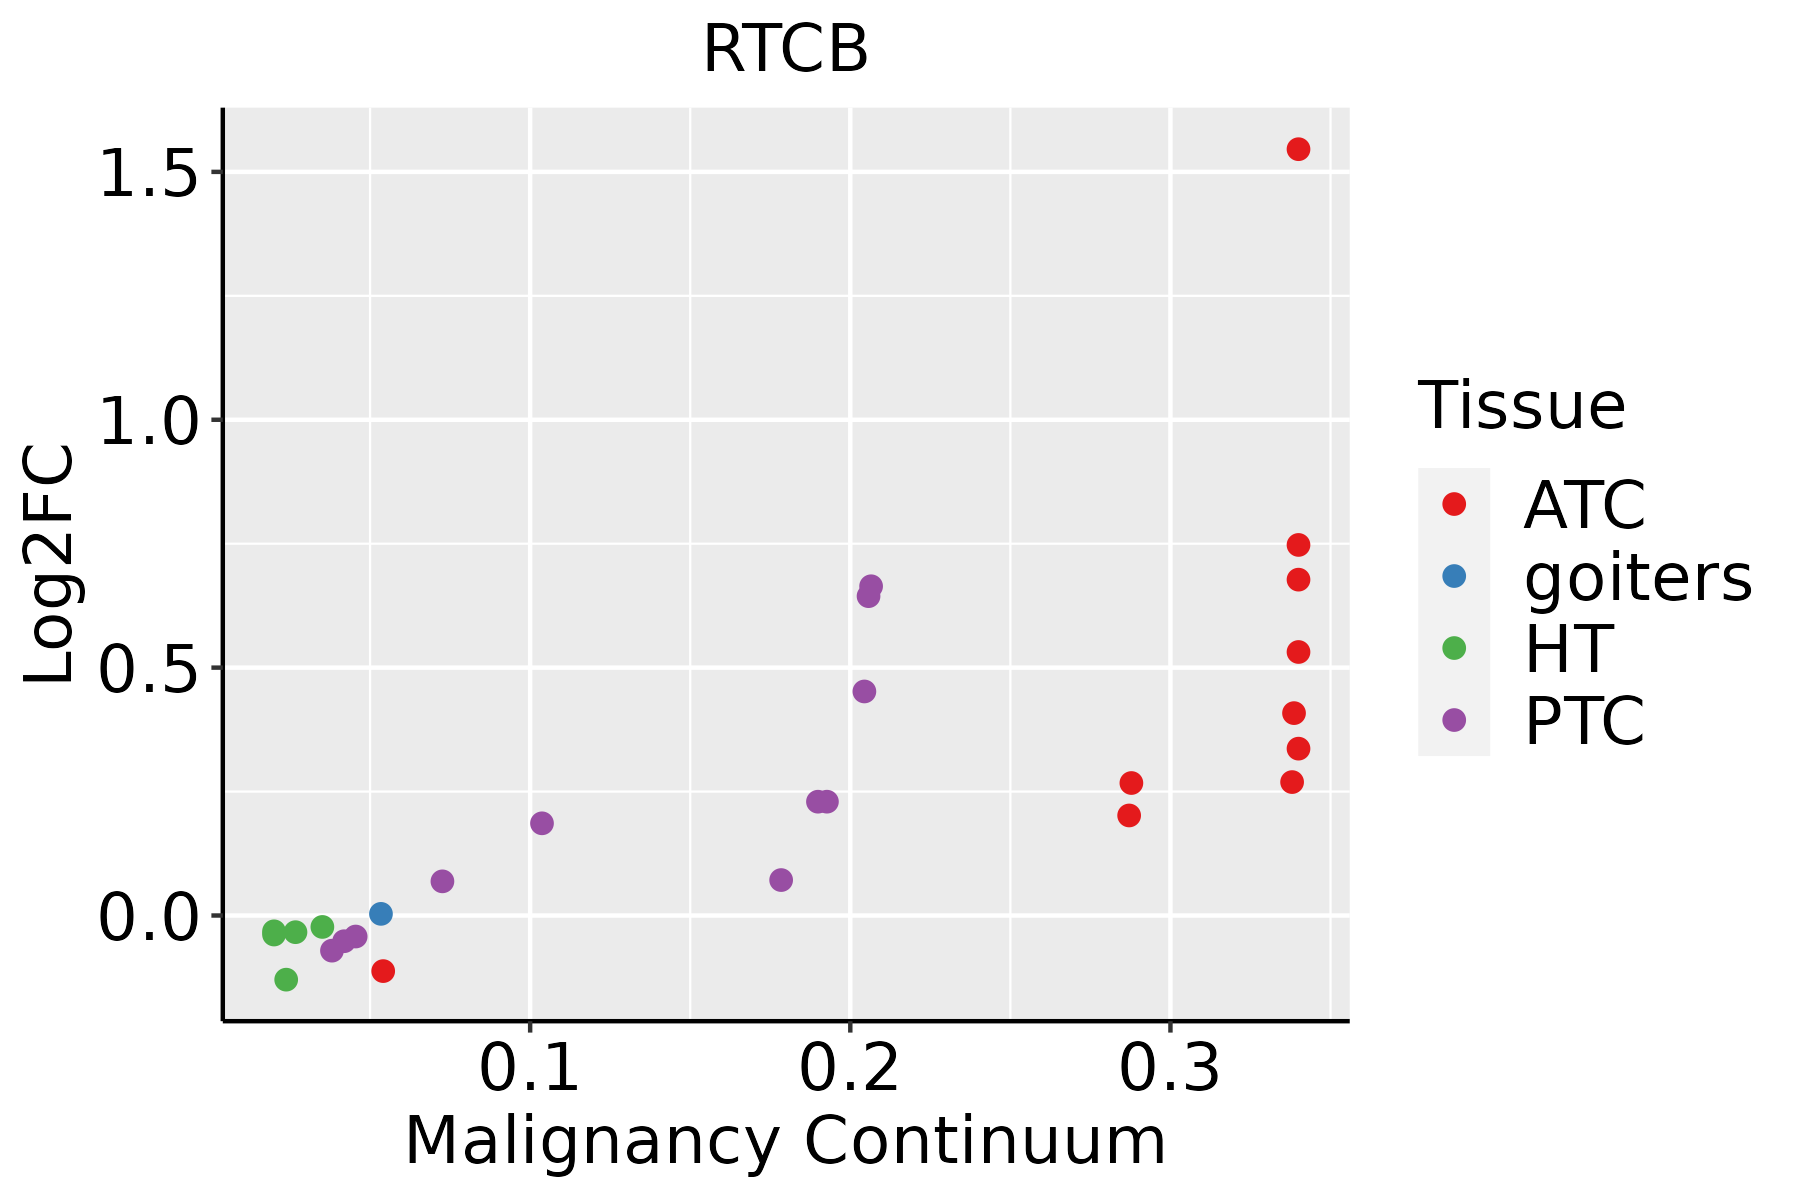 | ATC: Anaplastic thyroid cancer |
| HT: Hashimoto's thyroiditis | ||
| PTC: Papillary thyroid cancer |
| ∗log2FC in expression of this searched gene in stem-like cells from each diseased tissue sample relative to stem-like cells in normal samples in each tissue plotted against the malignancy continuum. Samples are colored based on if they are from different disease stage. |
Top |
Malignant transformation related pathway analysis |
| Find out the enriched GO biological processes and KEGG pathways involved in transition from healthy to precancer to cancer |
| Tissue | Disease Stage | Enriched GO biological Processes |
| Colorectum | AD |  |
| Colorectum | SER |  |
| Colorectum | MSS |  |
| Colorectum | MSI-H |  |
| Colorectum | FAP |  |
| ∗Top 15 enriched GO BP terms are showed in the bar plot of each disease state in each tissue. Each row represents a significant GO biological process which is colored according to the -log10(p.adjust). |
| Page: 1 2 3 4 5 6 7 8 9 |
| GO ID | Tissue | Disease Stage | Description | Gene Ratio | Bg Ratio | pvalue | p.adjust | Count |
| GO:0008380 | Colorectum | AD | RNA splicing | 169/3918 | 434/18723 | 3.59e-18 | 2.04e-15 | 169 |
| GO:00083801 | Colorectum | SER | RNA splicing | 123/2897 | 434/18723 | 3.84e-12 | 8.41e-10 | 123 |
| GO:00083802 | Colorectum | MSS | RNA splicing | 159/3467 | 434/18723 | 1.75e-19 | 1.22e-16 | 159 |
| GO:00083804 | Colorectum | FAP | RNA splicing | 108/2622 | 434/18723 | 7.90e-10 | 1.86e-07 | 108 |
| GO:00083805 | Colorectum | CRC | RNA splicing | 90/2078 | 434/18723 | 2.80e-09 | 7.97e-07 | 90 |
| GO:0008380111 | Esophagus | ESCC | RNA splicing | 336/8552 | 434/18723 | 1.74e-42 | 3.67e-39 | 336 |
| GO:003447015 | Esophagus | ESCC | ncRNA processing | 300/8552 | 395/18723 | 3.09e-35 | 3.26e-32 | 300 |
| GO:003466012 | Esophagus | ESCC | ncRNA metabolic process | 346/8552 | 485/18723 | 4.35e-31 | 2.51e-28 | 346 |
| GO:00080333 | Esophagus | ESCC | tRNA processing | 92/8552 | 127/18723 | 7.83e-10 | 1.93e-08 | 92 |
| GO:00063992 | Esophagus | ESCC | tRNA metabolic process | 122/8552 | 179/18723 | 9.03e-10 | 2.19e-08 | 122 |
| GO:00083807 | Liver | NAFLD | RNA splicing | 70/1882 | 434/18723 | 4.62e-05 | 1.10e-03 | 70 |
| GO:00344704 | Liver | NAFLD | ncRNA processing | 57/1882 | 395/18723 | 3.34e-03 | 2.93e-02 | 57 |
| GO:000838012 | Liver | Cirrhotic | RNA splicing | 229/4634 | 434/18723 | 9.13e-37 | 2.86e-33 | 229 |
| GO:00344701 | Liver | Cirrhotic | ncRNA processing | 158/4634 | 395/18723 | 1.09e-11 | 6.96e-10 | 158 |
| GO:00346603 | Liver | Cirrhotic | ncRNA metabolic process | 173/4634 | 485/18723 | 3.64e-08 | 1.21e-06 | 173 |
| GO:00344702 | Liver | HCC | ncRNA processing | 293/7958 | 395/18723 | 4.26e-38 | 6.76e-35 | 293 |
| GO:000838022 | Liver | HCC | RNA splicing | 313/7958 | 434/18723 | 1.36e-36 | 1.73e-33 | 313 |
| GO:00346601 | Liver | HCC | ncRNA metabolic process | 332/7958 | 485/18723 | 1.48e-31 | 7.80e-29 | 332 |
| GO:0008033 | Liver | HCC | tRNA processing | 87/7958 | 127/18723 | 2.66e-09 | 7.23e-08 | 87 |
| GO:0006399 | Liver | HCC | tRNA metabolic process | 108/7958 | 179/18723 | 1.07e-06 | 1.59e-05 | 108 |
| Page: 1 2 3 |
| Pathway ID | Tissue | Disease Stage | Description | Gene Ratio | Bg Ratio | pvalue | p.adjust | qvalue | Count |
| Page: 1 |
Top |
Cell-cell communication analysis |
| Identification of potential cell-cell interactions between two cell types and their ligand-receptor pairs for different disease states |
| Ligand | Receptor | LRpair | Pathway | Tissue | Disease Stage |
| Page: 1 |
Top |
Single-cell gene regulatory network inference analysis |
| Find out the significant the regulons (TFs) and the target genes of each regulon across cell types for different disease states |
| TF | Cell Type | Tissue | Disease Stage | Target Gene | RSS | Regulon Activity |
| ∗The dot plots of a searched regulon are shown for all cell subpopulations in each disease state of each tissue based on the regulon specific score inferred using pySCENIC and by calculating the average expression. |
| Page: 1 |
Top |
Somatic mutation of malignant transformation related genes |
| Annotation of somatic variants for genes involved in malignant transformation |
| Hugo Symbol | Variant Class | Variant Classification | dbSNP RS | HGVSc | HGVSp | HGVSp Short | SWISSPROT | BIOTYPE | SIFT | PolyPhen | Tumor Sample Barcode | Tissue | Histology | Sex | Age | Stage | Therapy Types | Drugs | Outcome |
| RTCB | SNV | Missense_Mutation | c.1408N>C | p.Glu470Gln | p.E470Q | Q9Y3I0 | protein_coding | deleterious(0) | probably_damaging(1) | TCGA-BH-A0HP-01 | Breast | breast invasive carcinoma | Female | >=65 | III/IV | Chemotherapy | doxorubicin | SD | |
| RTCB | insertion | Nonsense_Mutation | novel | c.894_895insAAAATTATTCCTAGAATTTGTCTTGAACAGCATAGAGAATAG | p.Ile298_Ala299insLysIleIleProArgIleCysLeuGluGlnHisArgGluTer | p.I298_A299insKIIPRICLEQHRE* | Q9Y3I0 | protein_coding | TCGA-AN-A0AS-01 | Breast | breast invasive carcinoma | Female | >=65 | III/IV | Unknown | Unknown | SD | ||
| RTCB | insertion | Nonsense_Mutation | novel | c.1018_1019insAGAAGACAGAGTAAACTCAGTCTGTTTCATTCCTCCTGTCCTCTTG | p.Pro340GlnfsTer5 | p.P340Qfs*5 | Q9Y3I0 | protein_coding | TCGA-AN-A0FL-01 | Breast | breast invasive carcinoma | Female | <65 | I/II | Unknown | Unknown | SD | ||
| RTCB | insertion | Frame_Shift_Ins | novel | c.1004_1005insGAACCCAGGAGGCGGAGCTTGCAGTGAGCCGAGATCCCGCC | p.Phe336AsnfsTer26 | p.F336Nfs*26 | Q9Y3I0 | protein_coding | TCGA-BH-A0HL-01 | Breast | breast invasive carcinoma | Female | <65 | I/II | Chemotherapy | cyclophosphamide | SD | ||
| RTCB | insertion | Frame_Shift_Ins | rs771992011 | c.736_737insA | p.Met246AsnfsTer6 | p.M246Nfs*6 | Q9Y3I0 | protein_coding | TCGA-D8-A1XQ-01 | Breast | breast invasive carcinoma | Female | >=65 | I/II | Unknown | Unknown | SD | ||
| RTCB | deletion | Frame_Shift_Del | novel | c.448delC | p.His150ThrfsTer14 | p.H150Tfs*14 | Q9Y3I0 | protein_coding | TCGA-EW-A2FV-01 | Breast | breast invasive carcinoma | Female | <65 | III/IV | Chemotherapy | docetaxel | SD | ||
| RTCB | SNV | Missense_Mutation | novel | c.1148N>T | p.Pro383Leu | p.P383L | Q9Y3I0 | protein_coding | deleterious(0) | probably_damaging(0.992) | TCGA-C5-A1MN-01 | Cervix | cervical & endocervical cancer | Female | <65 | III/IV | Chemotherapy | cisplatin | SD |
| RTCB | SNV | Missense_Mutation | c.209N>A | p.Gly70Asp | p.G70D | Q9Y3I0 | protein_coding | deleterious(0) | possibly_damaging(0.533) | TCGA-CA-6717-01 | Colorectum | colon adenocarcinoma | Male | <65 | I/II | Chemotherapy | oxaliplatin | CR | |
| RTCB | SNV | Missense_Mutation | rs751776473 | c.262N>A | p.Val88Ile | p.V88I | Q9Y3I0 | protein_coding | tolerated(1) | benign(0.009) | TCGA-CK-6751-01 | Colorectum | colon adenocarcinoma | Female | >=65 | I/II | Unknown | Unknown | SD |
| RTCB | SNV | Missense_Mutation | c.1502N>T | p.Ala501Val | p.A501V | Q9Y3I0 | protein_coding | deleterious(0.02) | possibly_damaging(0.588) | TCGA-D5-6930-01 | Colorectum | colon adenocarcinoma | Male | >=65 | I/II | Unknown | Unknown | SD |
| Page: 1 2 3 4 5 6 |
Top |
Related drugs of malignant transformation related genes |
| Identification of chemicals and drugs interact with genes involved in malignant transfromation |
| (DGIdb 4.0) |
| Entrez ID | Symbol | Category | Interaction Types | Drug Claim Name | Drug Name | PMIDs |
| Page: 1 |

Copyright 2023-Present -The University of Texas Health Science Center at Houston |