
|
|||||
|
 | |
| |
| |
| |
| |
| |
|
Gene: RTCA |
Gene summary for RTCA |
| Gene information | Species | Human | Gene symbol | RTCA | Gene ID | 8634 |
| Gene name | RNA 3'-terminal phosphate cyclase | |
| Gene Alias | RPC | |
| Cytomap | 1p21.2 | |
| Gene Type | protein-coding | GO ID | GO:0006139 | UniProtAcc | O00442 |
Top |
Malignant transformation analysis |
| Identification of the aberrant gene expression in precancerous and cancerous lesions by comparing the gene expression of stem-like cells in diseased tissues with normal stem cells |
| Entrez ID | Symbol | Replicates | Species | Organ | Tissue | Adj P-value | Log2FC | Malignancy |
| 8634 | RTCA | LZE4T | Human | Esophagus | ESCC | 1.43e-13 | 2.56e-01 | 0.0811 |
| 8634 | RTCA | LZE7T | Human | Esophagus | ESCC | 4.05e-05 | 4.18e-01 | 0.0667 |
| 8634 | RTCA | LZE8T | Human | Esophagus | ESCC | 1.47e-05 | 1.01e-01 | 0.067 |
| 8634 | RTCA | LZE20T | Human | Esophagus | ESCC | 6.81e-03 | 1.83e-01 | 0.0662 |
| 8634 | RTCA | LZE22T | Human | Esophagus | ESCC | 4.32e-05 | 2.47e-01 | 0.068 |
| 8634 | RTCA | LZE24T | Human | Esophagus | ESCC | 1.88e-12 | 3.15e-01 | 0.0596 |
| 8634 | RTCA | LZE6T | Human | Esophagus | ESCC | 2.98e-03 | 1.93e-01 | 0.0845 |
| 8634 | RTCA | P1T-E | Human | Esophagus | ESCC | 4.48e-04 | 9.61e-02 | 0.0875 |
| 8634 | RTCA | P2T-E | Human | Esophagus | ESCC | 1.80e-22 | 4.00e-01 | 0.1177 |
| 8634 | RTCA | P4T-E | Human | Esophagus | ESCC | 9.05e-22 | 3.77e-01 | 0.1323 |
| 8634 | RTCA | P5T-E | Human | Esophagus | ESCC | 8.09e-29 | 6.26e-01 | 0.1327 |
| 8634 | RTCA | P8T-E | Human | Esophagus | ESCC | 3.16e-19 | 3.53e-01 | 0.0889 |
| 8634 | RTCA | P9T-E | Human | Esophagus | ESCC | 2.18e-08 | 2.26e-01 | 0.1131 |
| 8634 | RTCA | P10T-E | Human | Esophagus | ESCC | 6.37e-28 | 4.97e-01 | 0.116 |
| 8634 | RTCA | P11T-E | Human | Esophagus | ESCC | 1.83e-14 | 3.27e-01 | 0.1426 |
| 8634 | RTCA | P12T-E | Human | Esophagus | ESCC | 2.14e-33 | 7.07e-01 | 0.1122 |
| 8634 | RTCA | P15T-E | Human | Esophagus | ESCC | 1.42e-19 | 1.85e-01 | 0.1149 |
| 8634 | RTCA | P16T-E | Human | Esophagus | ESCC | 1.58e-21 | 2.33e-01 | 0.1153 |
| 8634 | RTCA | P17T-E | Human | Esophagus | ESCC | 9.24e-15 | 5.69e-01 | 0.1278 |
| 8634 | RTCA | P19T-E | Human | Esophagus | ESCC | 4.66e-09 | 4.57e-01 | 0.1662 |
| Page: 1 2 3 4 5 6 |
| Tissue | Expression Dynamics | Abbreviation |
| Esophagus | 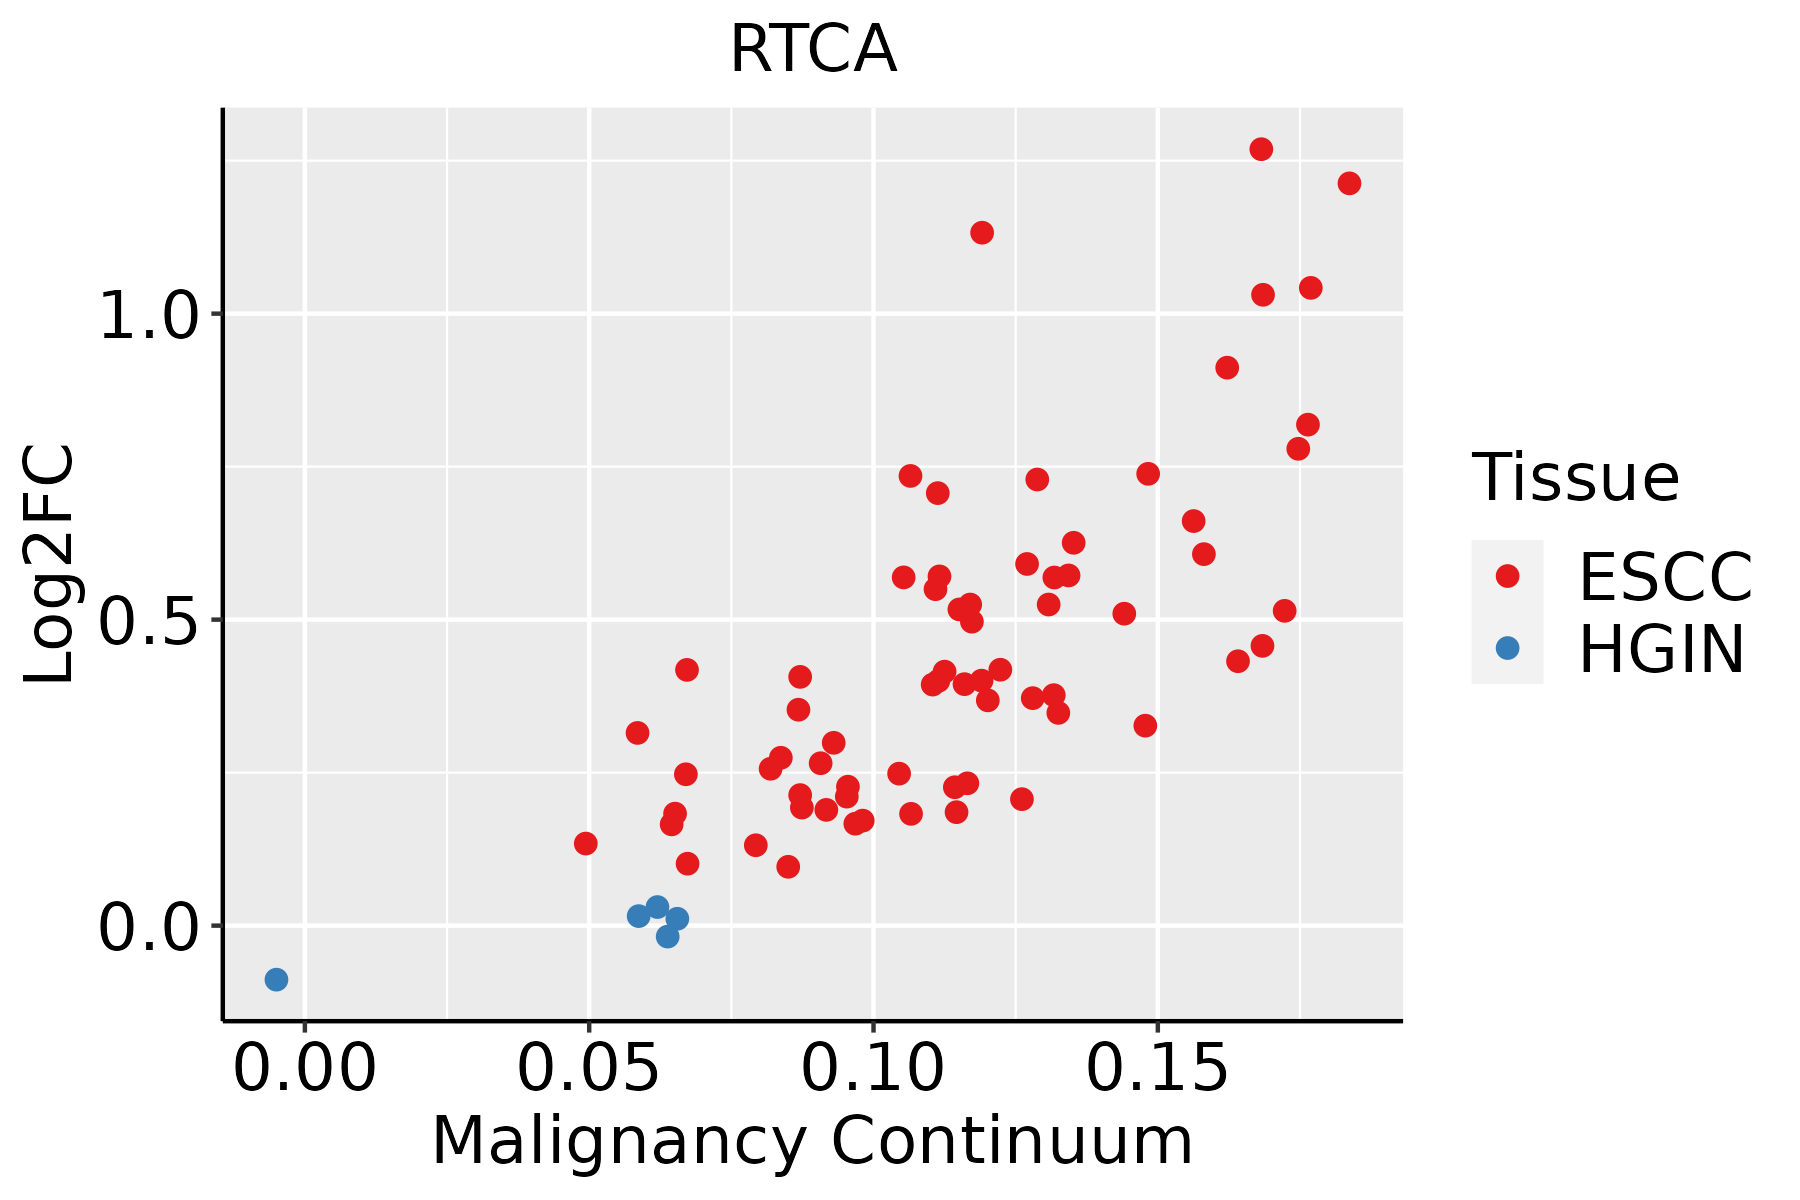 | ESCC: Esophageal squamous cell carcinoma |
| HGIN: High-grade intraepithelial neoplasias | ||
| LGIN: Low-grade intraepithelial neoplasias | ||
| Liver | 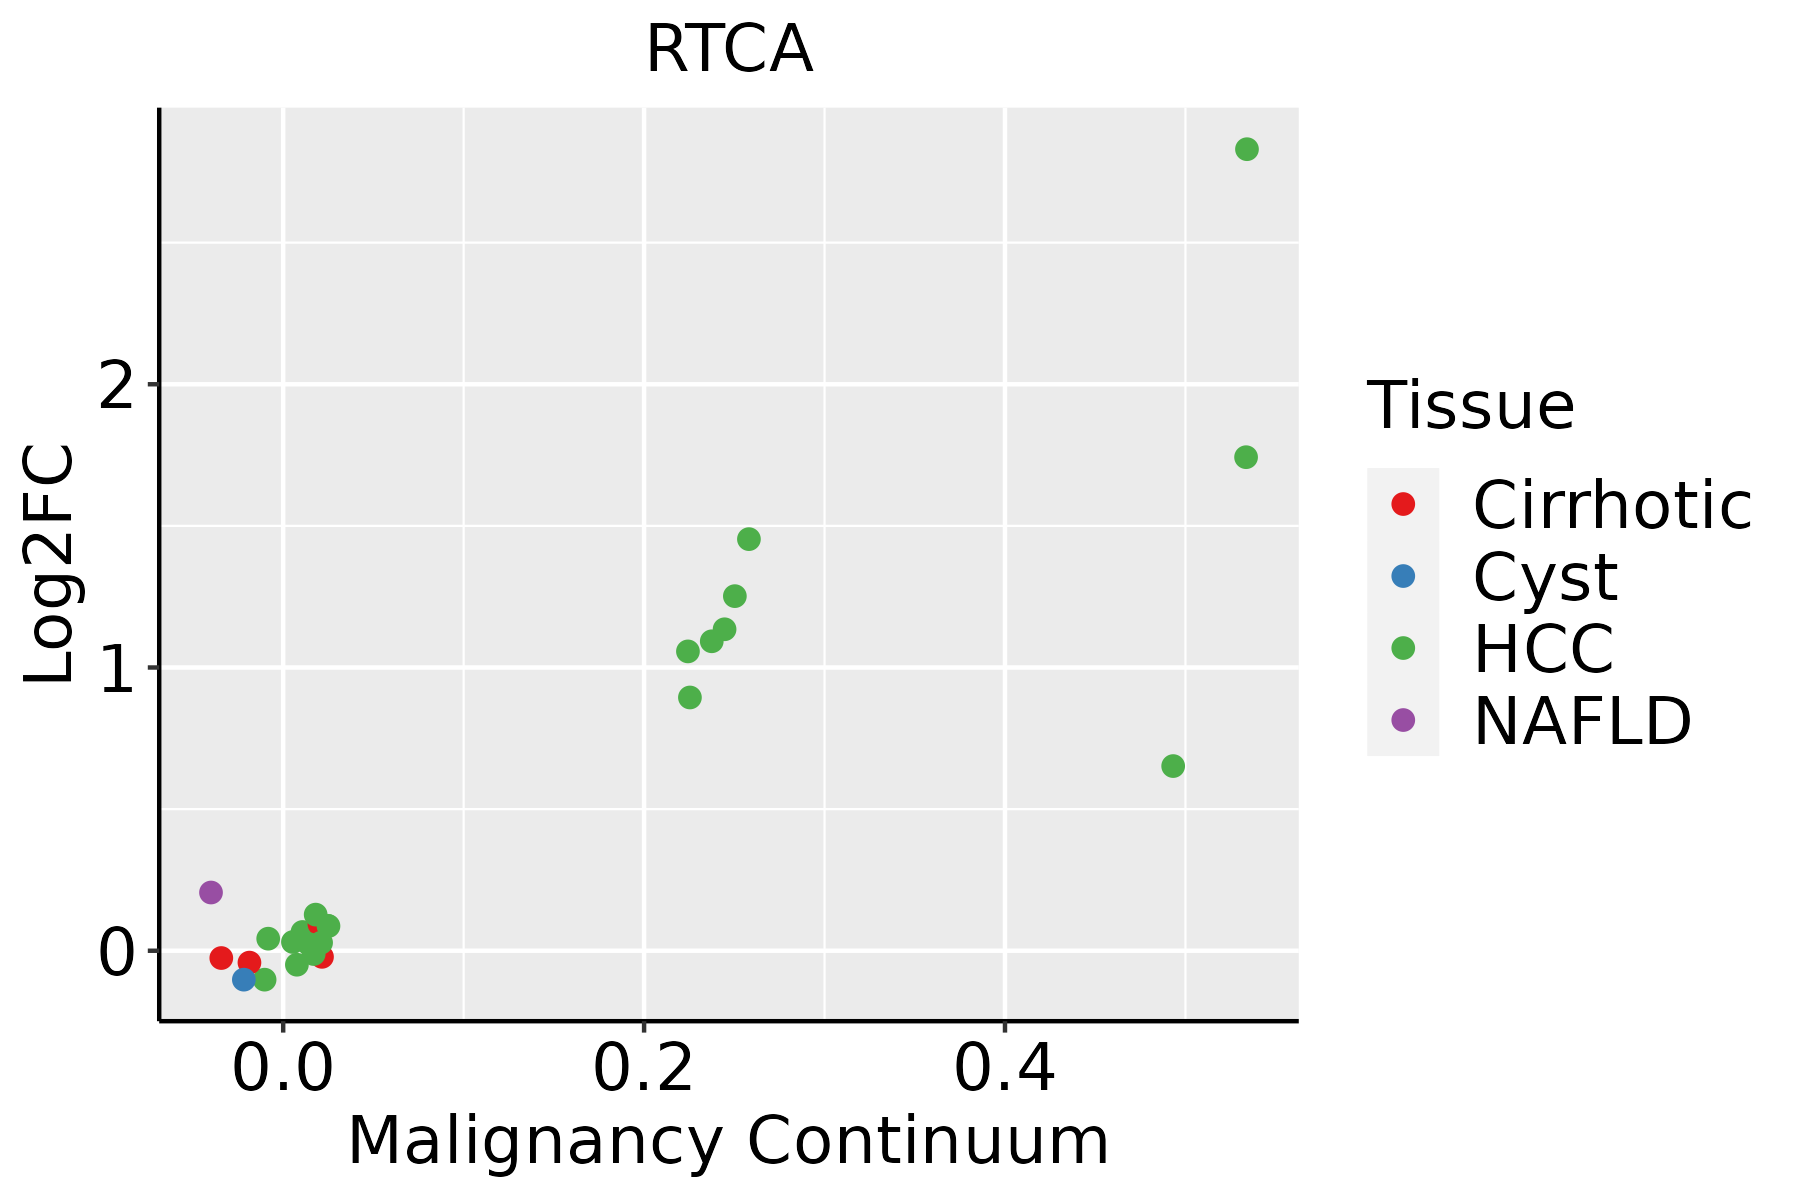 | HCC: Hepatocellular carcinoma |
| NAFLD: Non-alcoholic fatty liver disease | ||
| Oral Cavity |  | EOLP: Erosive Oral lichen planus |
| LP: leukoplakia | ||
| NEOLP: Non-erosive oral lichen planus | ||
| OSCC: Oral squamous cell carcinoma | ||
| Skin | 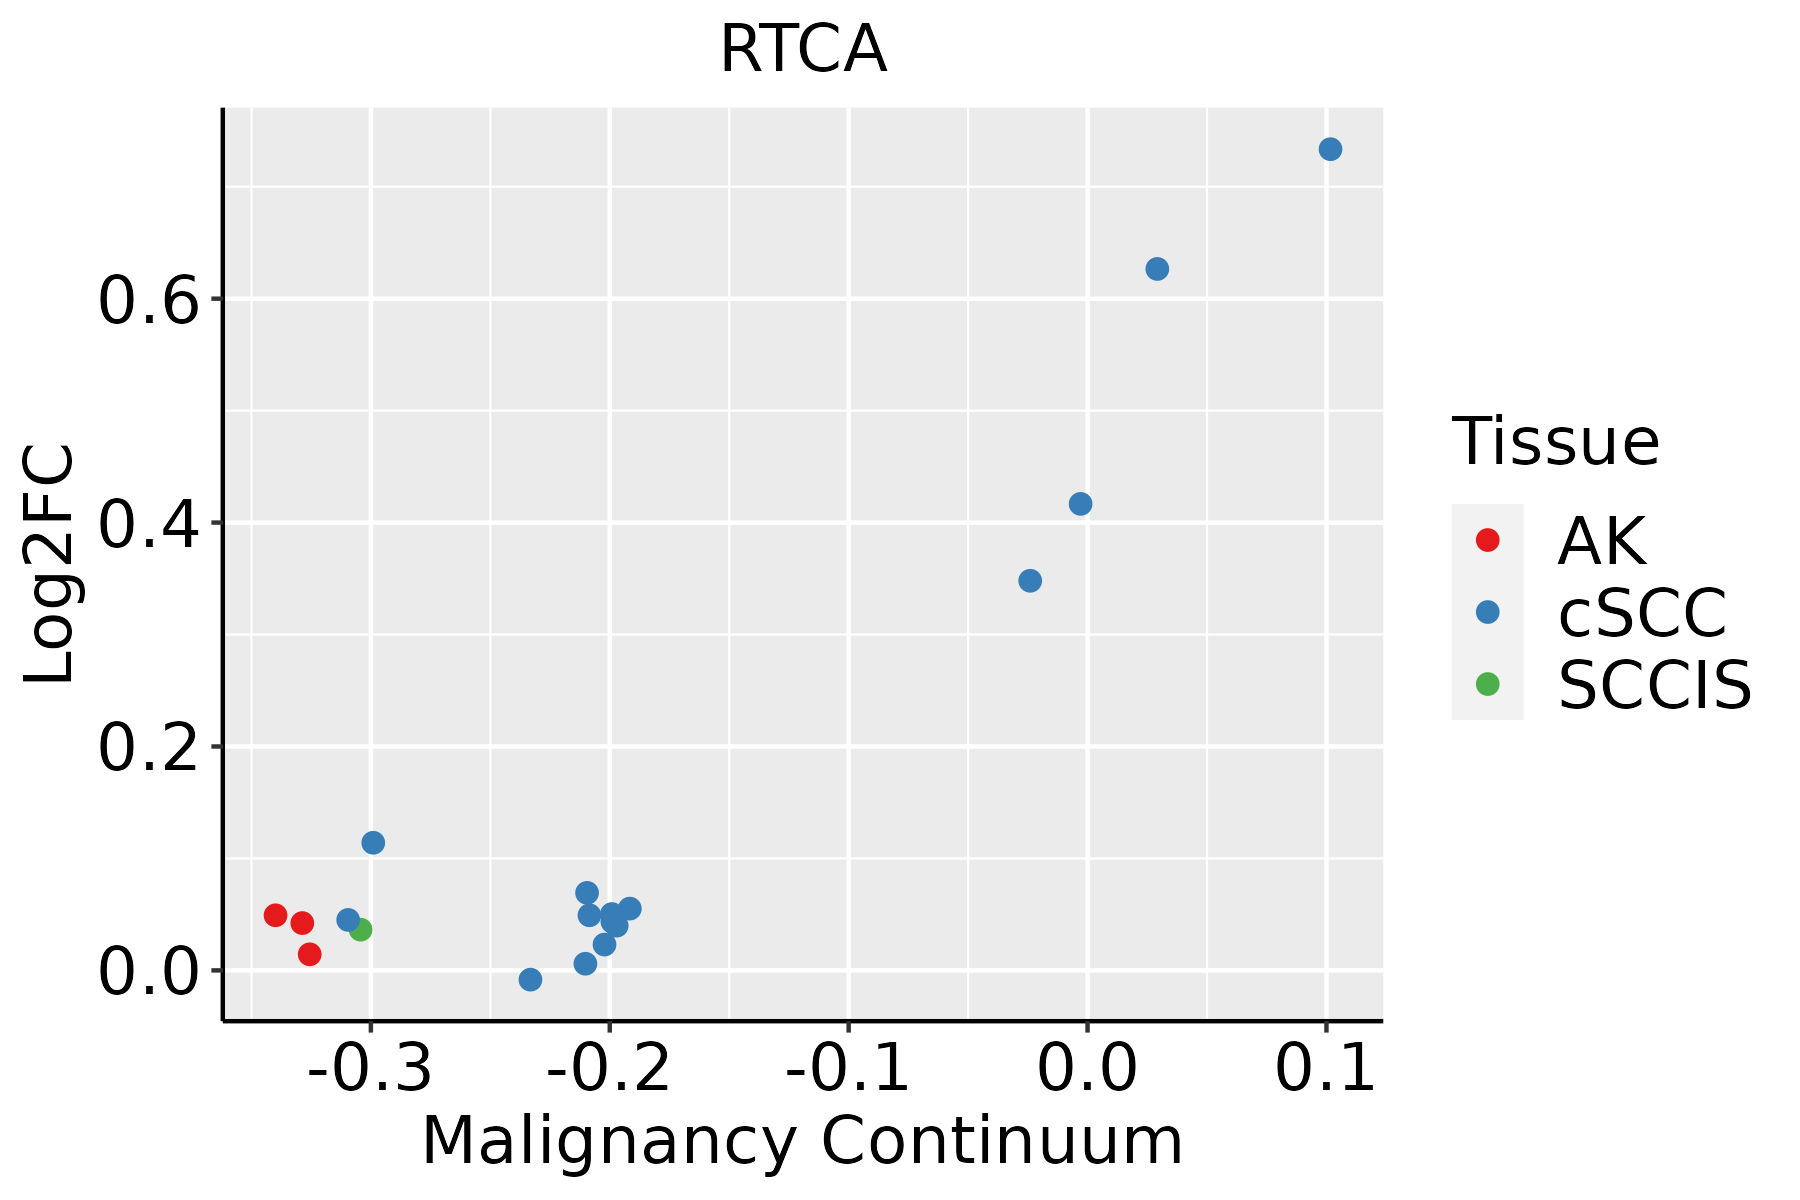 | AK: Actinic keratosis |
| cSCC: Cutaneous squamous cell carcinoma | ||
| SCCIS:squamous cell carcinoma in situ | ||
| Thyroid |  | ATC: Anaplastic thyroid cancer |
| HT: Hashimoto's thyroiditis | ||
| PTC: Papillary thyroid cancer |
| ∗log2FC in expression of this searched gene in stem-like cells from each diseased tissue sample relative to stem-like cells in normal samples in each tissue plotted against the malignancy continuum. Samples are colored based on if they are from different disease stage. |
Top |
Malignant transformation related pathway analysis |
| Find out the enriched GO biological processes and KEGG pathways involved in transition from healthy to precancer to cancer |
| Tissue | Disease Stage | Enriched GO biological Processes |
| Colorectum | AD |  |
| Colorectum | SER |  |
| Colorectum | MSS |  |
| Colorectum | MSI-H |  |
| Colorectum | FAP |  |
| ∗Top 15 enriched GO BP terms are showed in the bar plot of each disease state in each tissue. Each row represents a significant GO biological process which is colored according to the -log10(p.adjust). |
| Page: 1 2 3 4 5 6 7 8 9 |
| GO ID | Tissue | Disease Stage | Description | Gene Ratio | Bg Ratio | pvalue | p.adjust | Count |
| GO:00064876 | Esophagus | HGIN | protein N-linked glycosylation | 17/2587 | 65/18723 | 6.04e-03 | 4.87e-02 | 17 |
| GO:000648714 | Esophagus | ESCC | protein N-linked glycosylation | 51/8552 | 65/18723 | 6.41e-08 | 1.13e-06 | 51 |
| GO:00091002 | Esophagus | ESCC | glycoprotein metabolic process | 226/8552 | 387/18723 | 2.64e-07 | 3.94e-06 | 226 |
| GO:00700854 | Esophagus | ESCC | glycosylation | 144/8552 | 240/18723 | 5.12e-06 | 5.38e-05 | 144 |
| GO:00064865 | Esophagus | ESCC | protein glycosylation | 135/8552 | 226/18723 | 1.36e-05 | 1.24e-04 | 135 |
| GO:00434135 | Esophagus | ESCC | macromolecule glycosylation | 135/8552 | 226/18723 | 1.36e-05 | 1.24e-04 | 135 |
| GO:00091012 | Esophagus | ESCC | glycoprotein biosynthetic process | 181/8552 | 317/18723 | 2.54e-05 | 2.15e-04 | 181 |
| GO:00064873 | Liver | Cirrhotic | protein N-linked glycosylation | 30/4634 | 65/18723 | 1.40e-04 | 1.36e-03 | 30 |
| GO:000648711 | Liver | HCC | protein N-linked glycosylation | 48/7958 | 65/18723 | 2.85e-07 | 5.00e-06 | 48 |
| GO:00064862 | Liver | HCC | protein glycosylation | 122/7958 | 226/18723 | 3.11e-04 | 2.21e-03 | 122 |
| GO:00434132 | Liver | HCC | macromolecule glycosylation | 122/7958 | 226/18723 | 3.11e-04 | 2.21e-03 | 122 |
| GO:00700852 | Liver | HCC | glycosylation | 128/7958 | 240/18723 | 4.35e-04 | 2.92e-03 | 128 |
| GO:0009100 | Liver | HCC | glycoprotein metabolic process | 193/7958 | 387/18723 | 1.89e-03 | 9.62e-03 | 193 |
| GO:00064863 | Lung | AIS | protein glycosylation | 35/1849 | 226/18723 | 4.93e-03 | 4.27e-02 | 35 |
| GO:00434133 | Lung | AIS | macromolecule glycosylation | 35/1849 | 226/18723 | 4.93e-03 | 4.27e-02 | 35 |
| GO:00064875 | Oral cavity | OSCC | protein N-linked glycosylation | 44/7305 | 65/18723 | 2.63e-06 | 3.26e-05 | 44 |
| GO:00091001 | Oral cavity | OSCC | glycoprotein metabolic process | 185/7305 | 387/18723 | 2.37e-04 | 1.54e-03 | 185 |
| GO:00091011 | Oral cavity | OSCC | glycoprotein biosynthetic process | 151/7305 | 317/18723 | 1.01e-03 | 5.26e-03 | 151 |
| GO:00064864 | Oral cavity | OSCC | protein glycosylation | 111/7305 | 226/18723 | 1.22e-03 | 6.10e-03 | 111 |
| GO:00434134 | Oral cavity | OSCC | macromolecule glycosylation | 111/7305 | 226/18723 | 1.22e-03 | 6.10e-03 | 111 |
| Page: 1 2 |
| Pathway ID | Tissue | Disease Stage | Description | Gene Ratio | Bg Ratio | pvalue | p.adjust | qvalue | Count |
| Page: 1 |
Top |
Cell-cell communication analysis |
| Identification of potential cell-cell interactions between two cell types and their ligand-receptor pairs for different disease states |
| Ligand | Receptor | LRpair | Pathway | Tissue | Disease Stage |
| Page: 1 |
Top |
Single-cell gene regulatory network inference analysis |
| Find out the significant the regulons (TFs) and the target genes of each regulon across cell types for different disease states |
| TF | Cell Type | Tissue | Disease Stage | Target Gene | RSS | Regulon Activity |
| ∗The dot plots of a searched regulon are shown for all cell subpopulations in each disease state of each tissue based on the regulon specific score inferred using pySCENIC and by calculating the average expression. |
| Page: 1 |
Top |
Somatic mutation of malignant transformation related genes |
| Annotation of somatic variants for genes involved in malignant transformation |
| Hugo Symbol | Variant Class | Variant Classification | dbSNP RS | HGVSc | HGVSp | HGVSp Short | SWISSPROT | BIOTYPE | SIFT | PolyPhen | Tumor Sample Barcode | Tissue | Histology | Sex | Age | Stage | Therapy Types | Drugs | Outcome |
| RTCA | SNV | Missense_Mutation | novel | c.734T>G | p.Val245Gly | p.V245G | O00442 | protein_coding | deleterious(0.01) | possibly_damaging(0.802) | TCGA-2W-A8YY-01 | Cervix | cervical & endocervical cancer | Female | <65 | I/II | Chemotherapy | cisplatin | CR |
| RTCA | SNV | Missense_Mutation | c.1056G>T | p.Lys352Asn | p.K352N | O00442 | protein_coding | tolerated(0.3) | benign(0.005) | TCGA-AA-3510-01 | Colorectum | colon adenocarcinoma | Male | >=65 | I/II | Unknown | Unknown | SD | |
| RTCA | SNV | Missense_Mutation | c.635N>T | p.Ala212Val | p.A212V | O00442 | protein_coding | deleterious(0.02) | benign(0.035) | TCGA-AA-3821-01 | Colorectum | colon adenocarcinoma | Female | >=65 | I/II | Unknown | Unknown | SD | |
| RTCA | SNV | Missense_Mutation | c.419C>T | p.Ala140Val | p.A140V | O00442 | protein_coding | tolerated(0.11) | possibly_damaging(0.54) | TCGA-AA-A022-01 | Colorectum | colon adenocarcinoma | Female | >=65 | I/II | Unknown | Unknown | SD | |
| RTCA | SNV | Missense_Mutation | rs375108570 | c.1001N>T | p.Thr334Met | p.T334M | O00442 | protein_coding | deleterious(0) | probably_damaging(1) | TCGA-AD-6895-01 | Colorectum | colon adenocarcinoma | Male | >=65 | III/IV | Unknown | Unknown | SD |
| RTCA | SNV | Missense_Mutation | c.595C>A | p.Arg199Ser | p.R199S | O00442 | protein_coding | tolerated(0.07) | possibly_damaging(0.615) | TCGA-AD-6964-01 | Colorectum | colon adenocarcinoma | Male | <65 | III/IV | Chemotherapy | folfox | PD | |
| RTCA | SNV | Missense_Mutation | c.397N>A | p.His133Asn | p.H133N | O00442 | protein_coding | tolerated(0.37) | benign(0.003) | TCGA-CA-6718-01 | Colorectum | colon adenocarcinoma | Male | <65 | I/II | Unknown | Unknown | PD | |
| RTCA | SNV | Missense_Mutation | c.1056G>T | p.Lys352Asn | p.K352N | O00442 | protein_coding | tolerated(0.3) | benign(0.005) | TCGA-AG-A002-01 | Colorectum | rectum adenocarcinoma | Male | <65 | I/II | Unknown | Unknown | SD | |
| RTCA | deletion | Frame_Shift_Del | c.533delG | p.Gly178ValfsTer4 | p.G178Vfs*4 | O00442 | protein_coding | TCGA-G4-6309-01 | Colorectum | colon adenocarcinoma | Female | <65 | III/IV | Chemotherapy | xeloda | PD | |||
| RTCA | SNV | Missense_Mutation | rs755247218 | c.361C>T | p.Pro121Ser | p.P121S | O00442 | protein_coding | deleterious(0) | probably_damaging(0.999) | TCGA-A5-A1OF-01 | Endometrium | uterine corpus endometrioid carcinoma | Female | <65 | I/II | Unknown | Unknown | SD |
| Page: 1 2 3 |
Top |
Related drugs of malignant transformation related genes |
| Identification of chemicals and drugs interact with genes involved in malignant transfromation |
| (DGIdb 4.0) |
| Entrez ID | Symbol | Category | Interaction Types | Drug Claim Name | Drug Name | PMIDs |
| Page: 1 |

Copyright 2023-Present -The University of Texas Health Science Center at Houston |