
|
|||||
|
 | |
| |
| |
| |
| |
| |
|
Gene: RSU1 |
Gene summary for RSU1 |
| Gene information | Species | Human | Gene symbol | RSU1 | Gene ID | 6251 |
| Gene name | Ras suppressor protein 1 | |
| Gene Alias | RSP-1 | |
| Cytomap | 10p13 | |
| Gene Type | protein-coding | GO ID | GO:0007154 | UniProtAcc | Q15404 |
Top |
Malignant transformation analysis |
| Identification of the aberrant gene expression in precancerous and cancerous lesions by comparing the gene expression of stem-like cells in diseased tissues with normal stem cells |
| Entrez ID | Symbol | Replicates | Species | Organ | Tissue | Adj P-value | Log2FC | Malignancy |
| 6251 | RSU1 | HTA11_347_2000001011 | Human | Colorectum | AD | 3.91e-10 | 6.08e-01 | -0.1954 |
| 6251 | RSU1 | HTA11_99999965104_69814 | Human | Colorectum | MSS | 2.43e-03 | 5.57e-01 | 0.281 |
| 6251 | RSU1 | A015-C-203 | Human | Colorectum | FAP | 2.02e-14 | -2.87e-01 | -0.1294 |
| 6251 | RSU1 | A002-C-201 | Human | Colorectum | FAP | 1.71e-06 | -2.78e-01 | 0.0324 |
| 6251 | RSU1 | A001-C-119 | Human | Colorectum | FAP | 1.58e-03 | -3.53e-01 | -0.1557 |
| 6251 | RSU1 | A001-C-108 | Human | Colorectum | FAP | 5.58e-06 | -2.37e-01 | -0.0272 |
| 6251 | RSU1 | A002-C-205 | Human | Colorectum | FAP | 3.74e-12 | -3.92e-01 | -0.1236 |
| 6251 | RSU1 | A015-C-006 | Human | Colorectum | FAP | 1.72e-08 | -4.09e-01 | -0.0994 |
| 6251 | RSU1 | A015-C-106 | Human | Colorectum | FAP | 1.45e-04 | -1.77e-01 | -0.0511 |
| 6251 | RSU1 | A002-C-114 | Human | Colorectum | FAP | 9.59e-10 | -3.07e-01 | -0.1561 |
| 6251 | RSU1 | A015-C-104 | Human | Colorectum | FAP | 1.86e-15 | -2.87e-01 | -0.1899 |
| 6251 | RSU1 | A001-C-014 | Human | Colorectum | FAP | 1.24e-06 | -2.29e-01 | 0.0135 |
| 6251 | RSU1 | A002-C-016 | Human | Colorectum | FAP | 6.13e-13 | -3.88e-01 | 0.0521 |
| 6251 | RSU1 | A015-C-002 | Human | Colorectum | FAP | 2.52e-08 | -4.67e-01 | -0.0763 |
| 6251 | RSU1 | A001-C-203 | Human | Colorectum | FAP | 8.53e-04 | -1.58e-01 | -0.0481 |
| 6251 | RSU1 | A002-C-116 | Human | Colorectum | FAP | 1.70e-15 | -3.78e-01 | -0.0452 |
| 6251 | RSU1 | A014-C-008 | Human | Colorectum | FAP | 4.97e-08 | -3.90e-01 | -0.191 |
| 6251 | RSU1 | A018-E-020 | Human | Colorectum | FAP | 4.81e-11 | -3.42e-01 | -0.2034 |
| 6251 | RSU1 | F034 | Human | Colorectum | FAP | 6.12e-08 | -1.98e-01 | -0.0665 |
| 6251 | RSU1 | F072B | Human | Colorectum | FAP | 1.90e-06 | -3.26e-01 | 0.257 |
| Page: 1 2 3 4 5 6 7 |
| Tissue | Expression Dynamics | Abbreviation |
| Colorectum (GSE201348) |  | FAP: Familial adenomatous polyposis |
| CRC: Colorectal cancer | ||
| Colorectum (HTA11) | 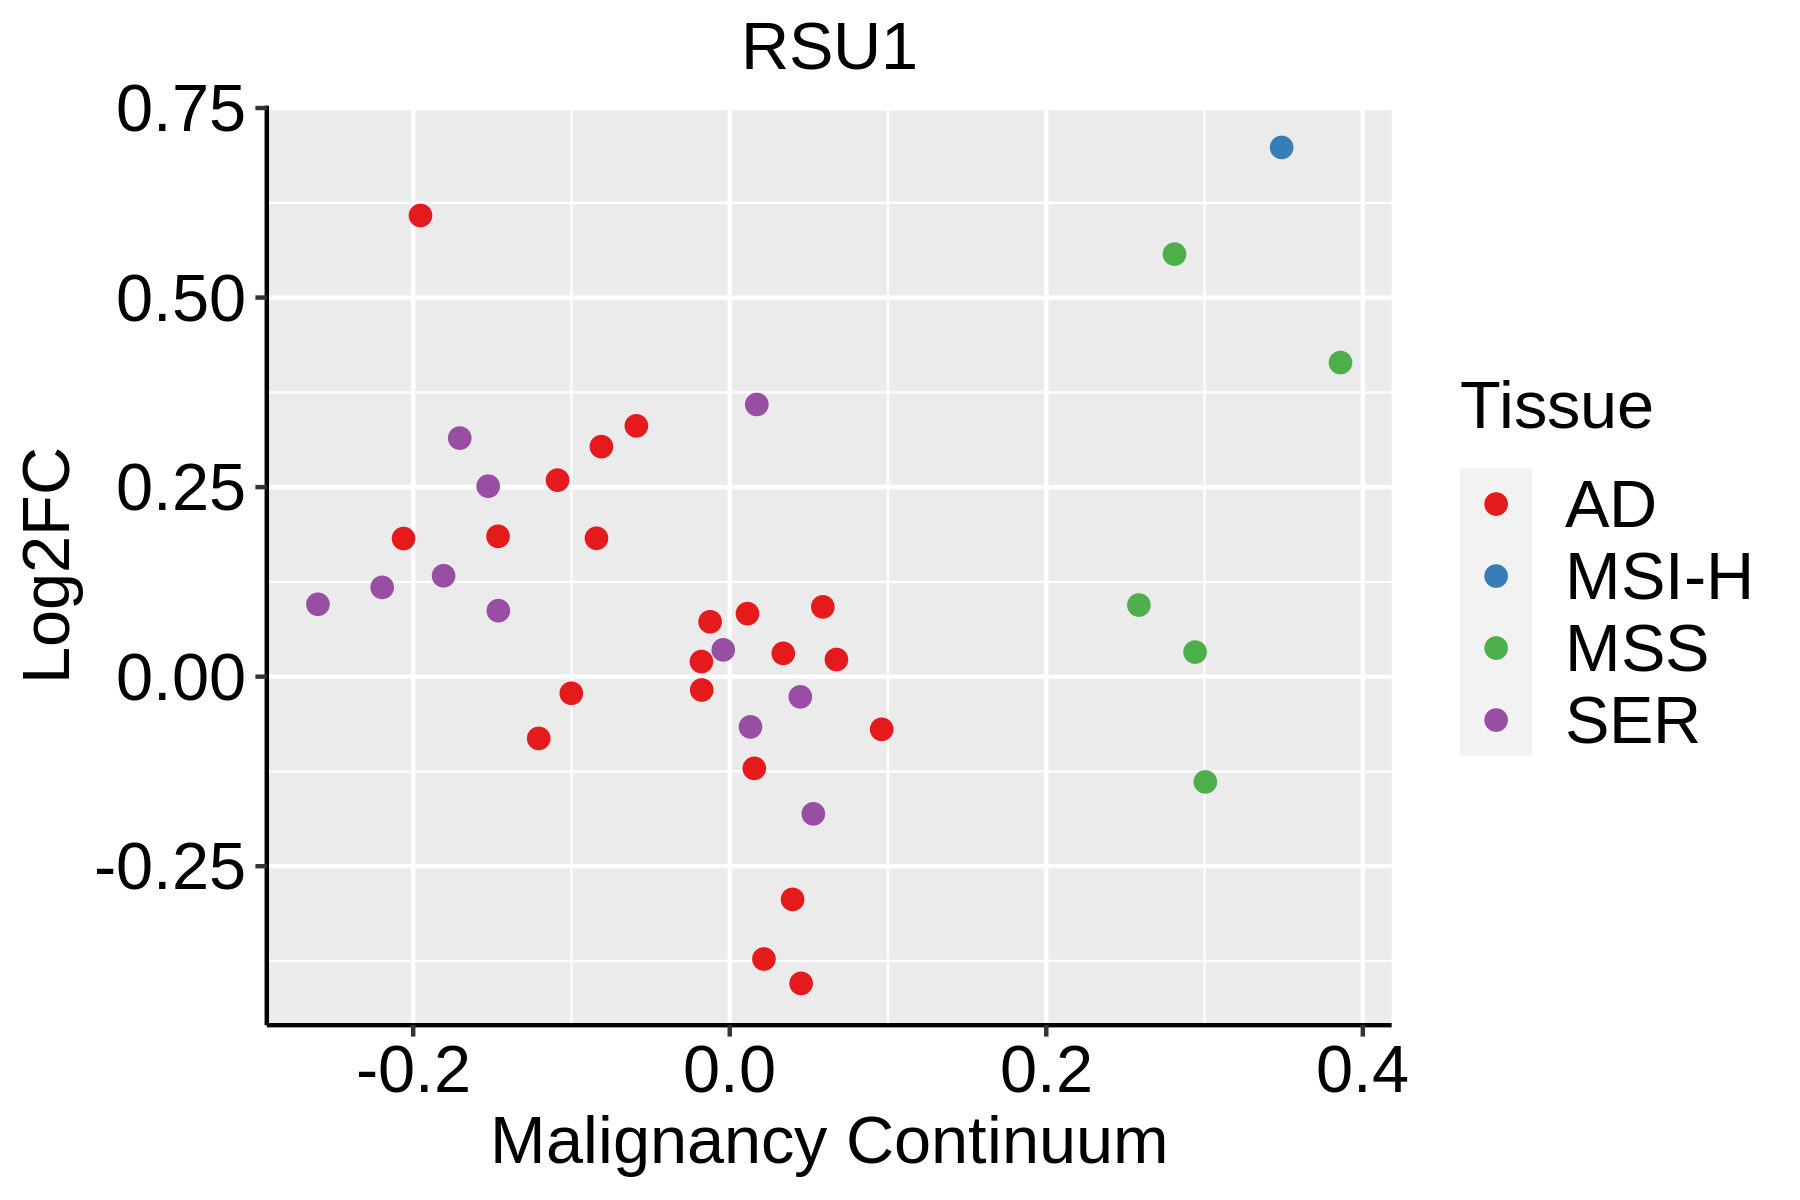 | AD: Adenomas |
| SER: Sessile serrated lesions | ||
| MSI-H: Microsatellite-high colorectal cancer | ||
| MSS: Microsatellite stable colorectal cancer | ||
| Esophagus | 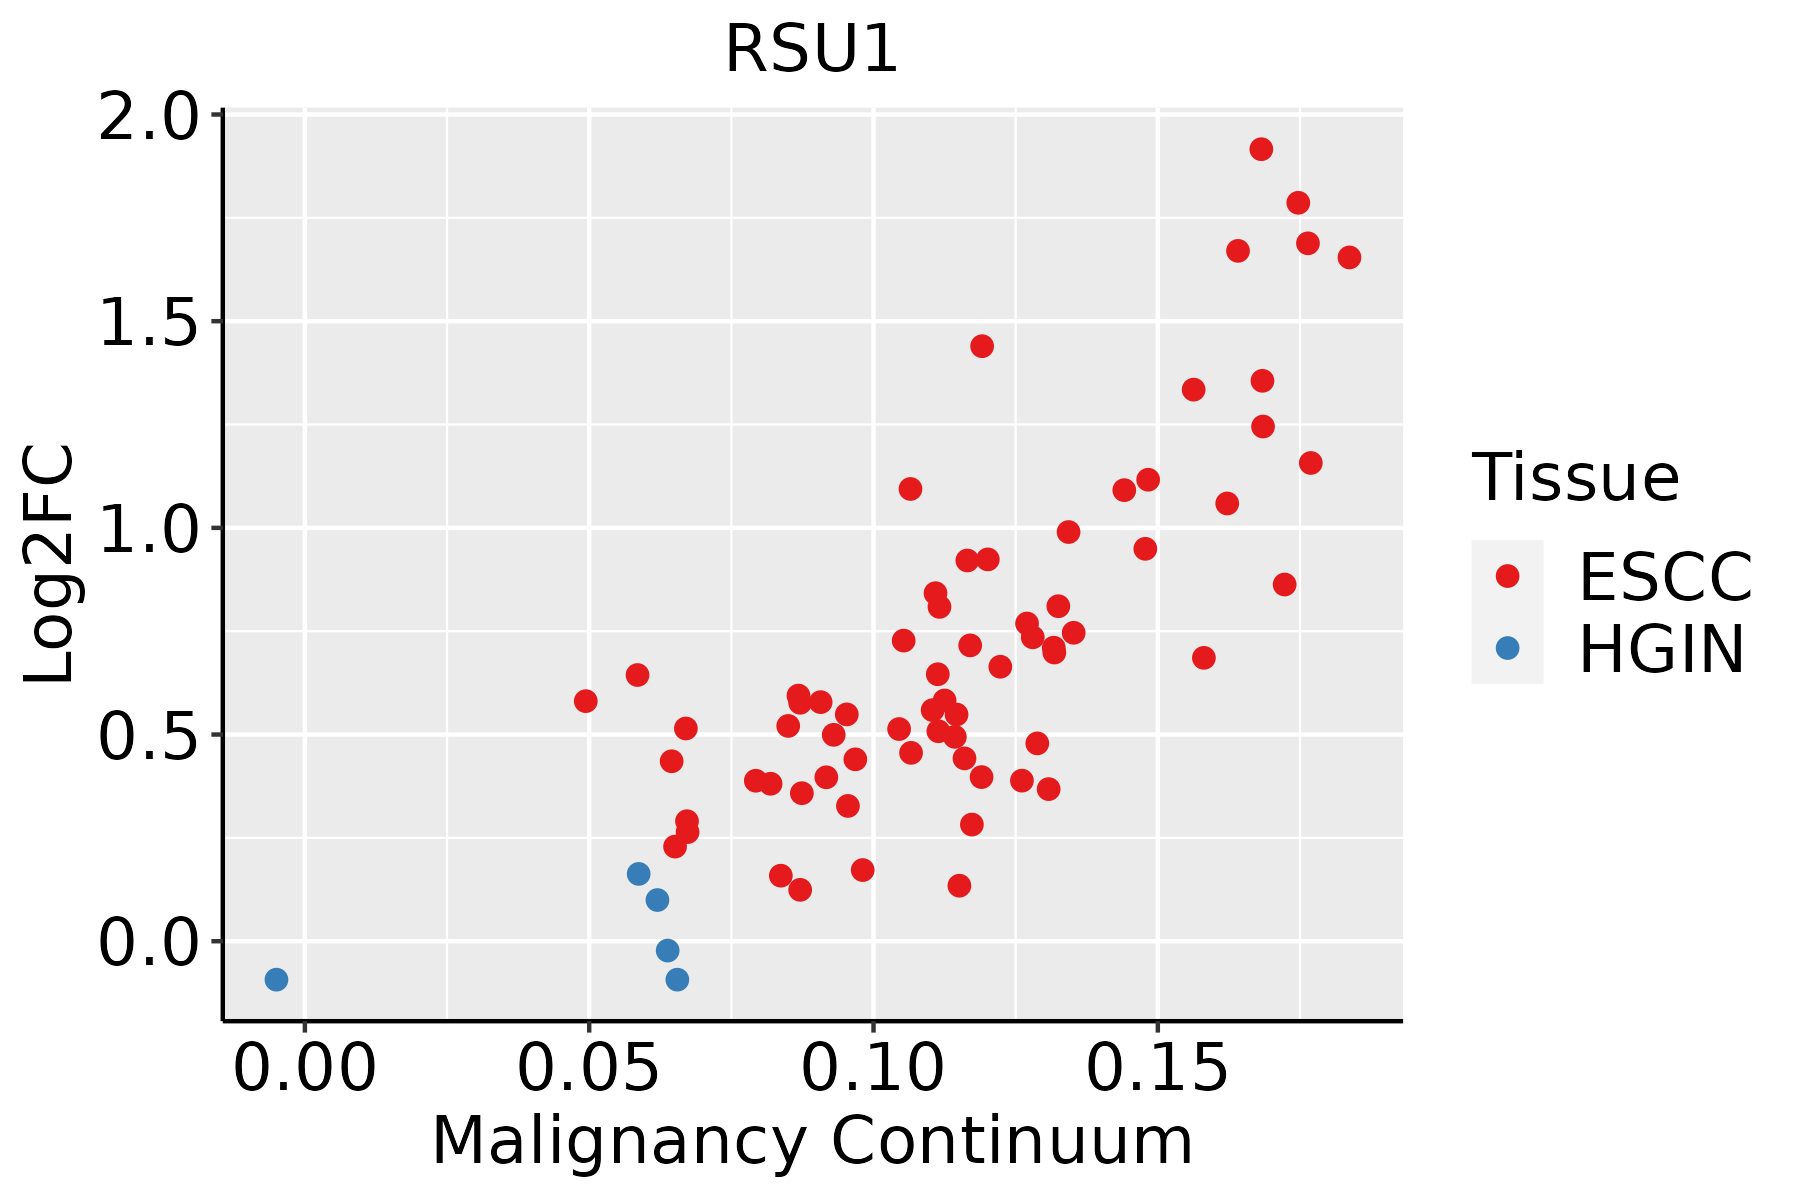 | ESCC: Esophageal squamous cell carcinoma |
| HGIN: High-grade intraepithelial neoplasias | ||
| LGIN: Low-grade intraepithelial neoplasias | ||
| Liver | 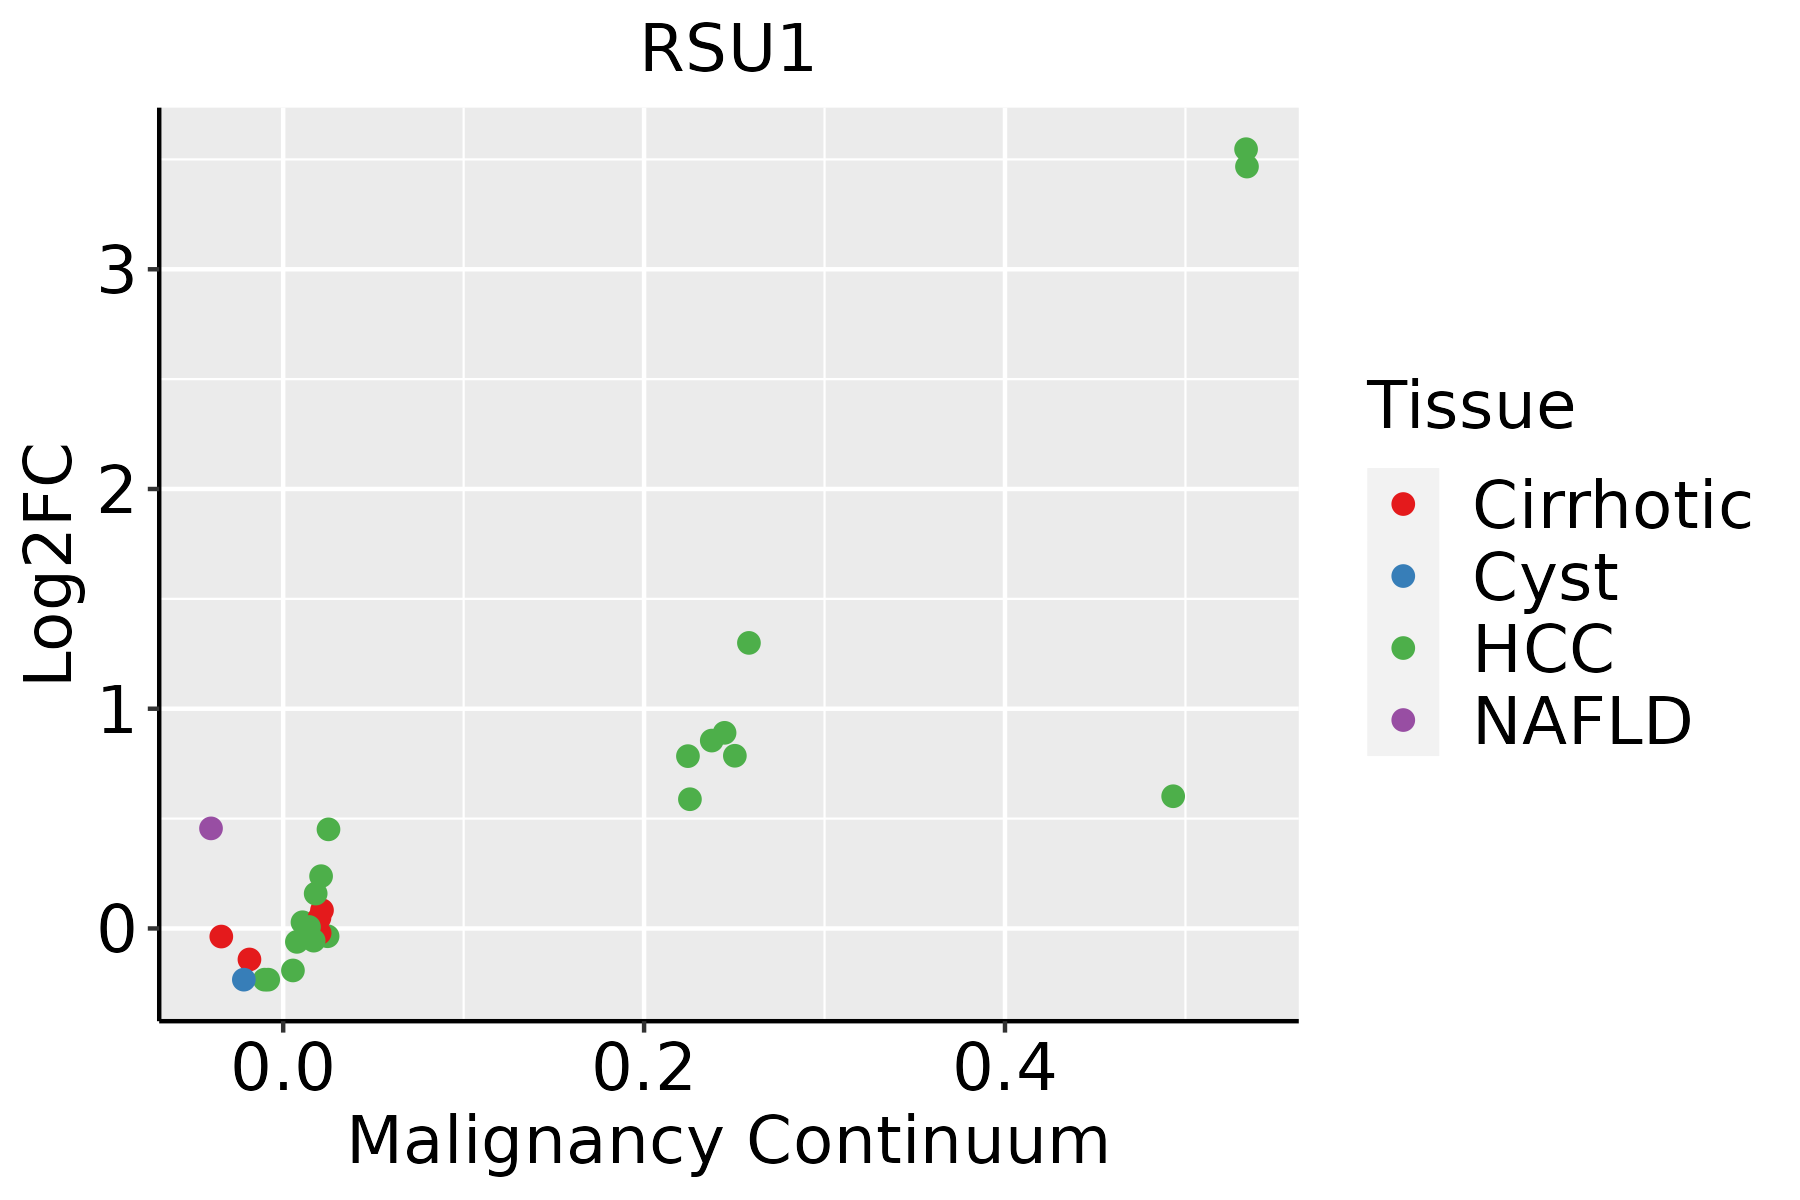 | HCC: Hepatocellular carcinoma |
| NAFLD: Non-alcoholic fatty liver disease | ||
| Oral Cavity | 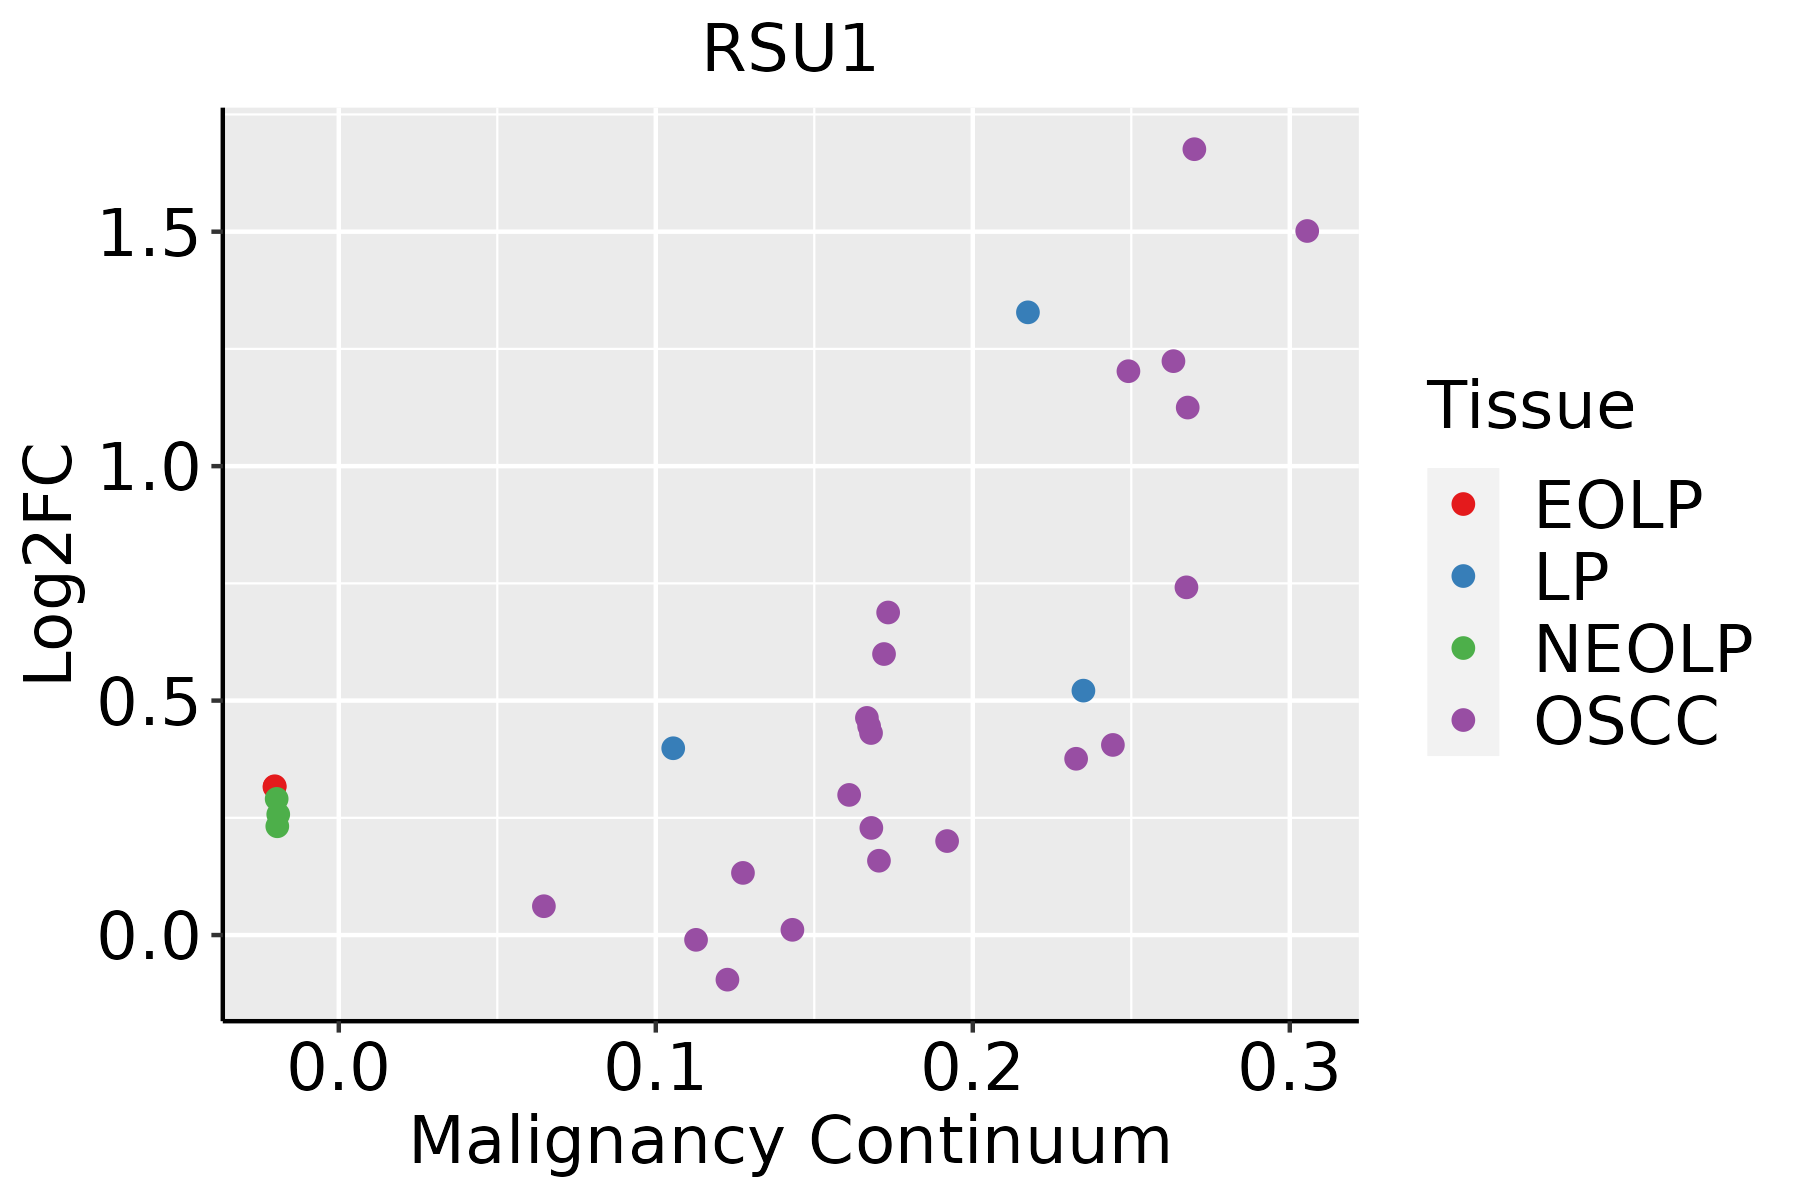 | EOLP: Erosive Oral lichen planus |
| LP: leukoplakia | ||
| NEOLP: Non-erosive oral lichen planus | ||
| OSCC: Oral squamous cell carcinoma | ||
| Skin | 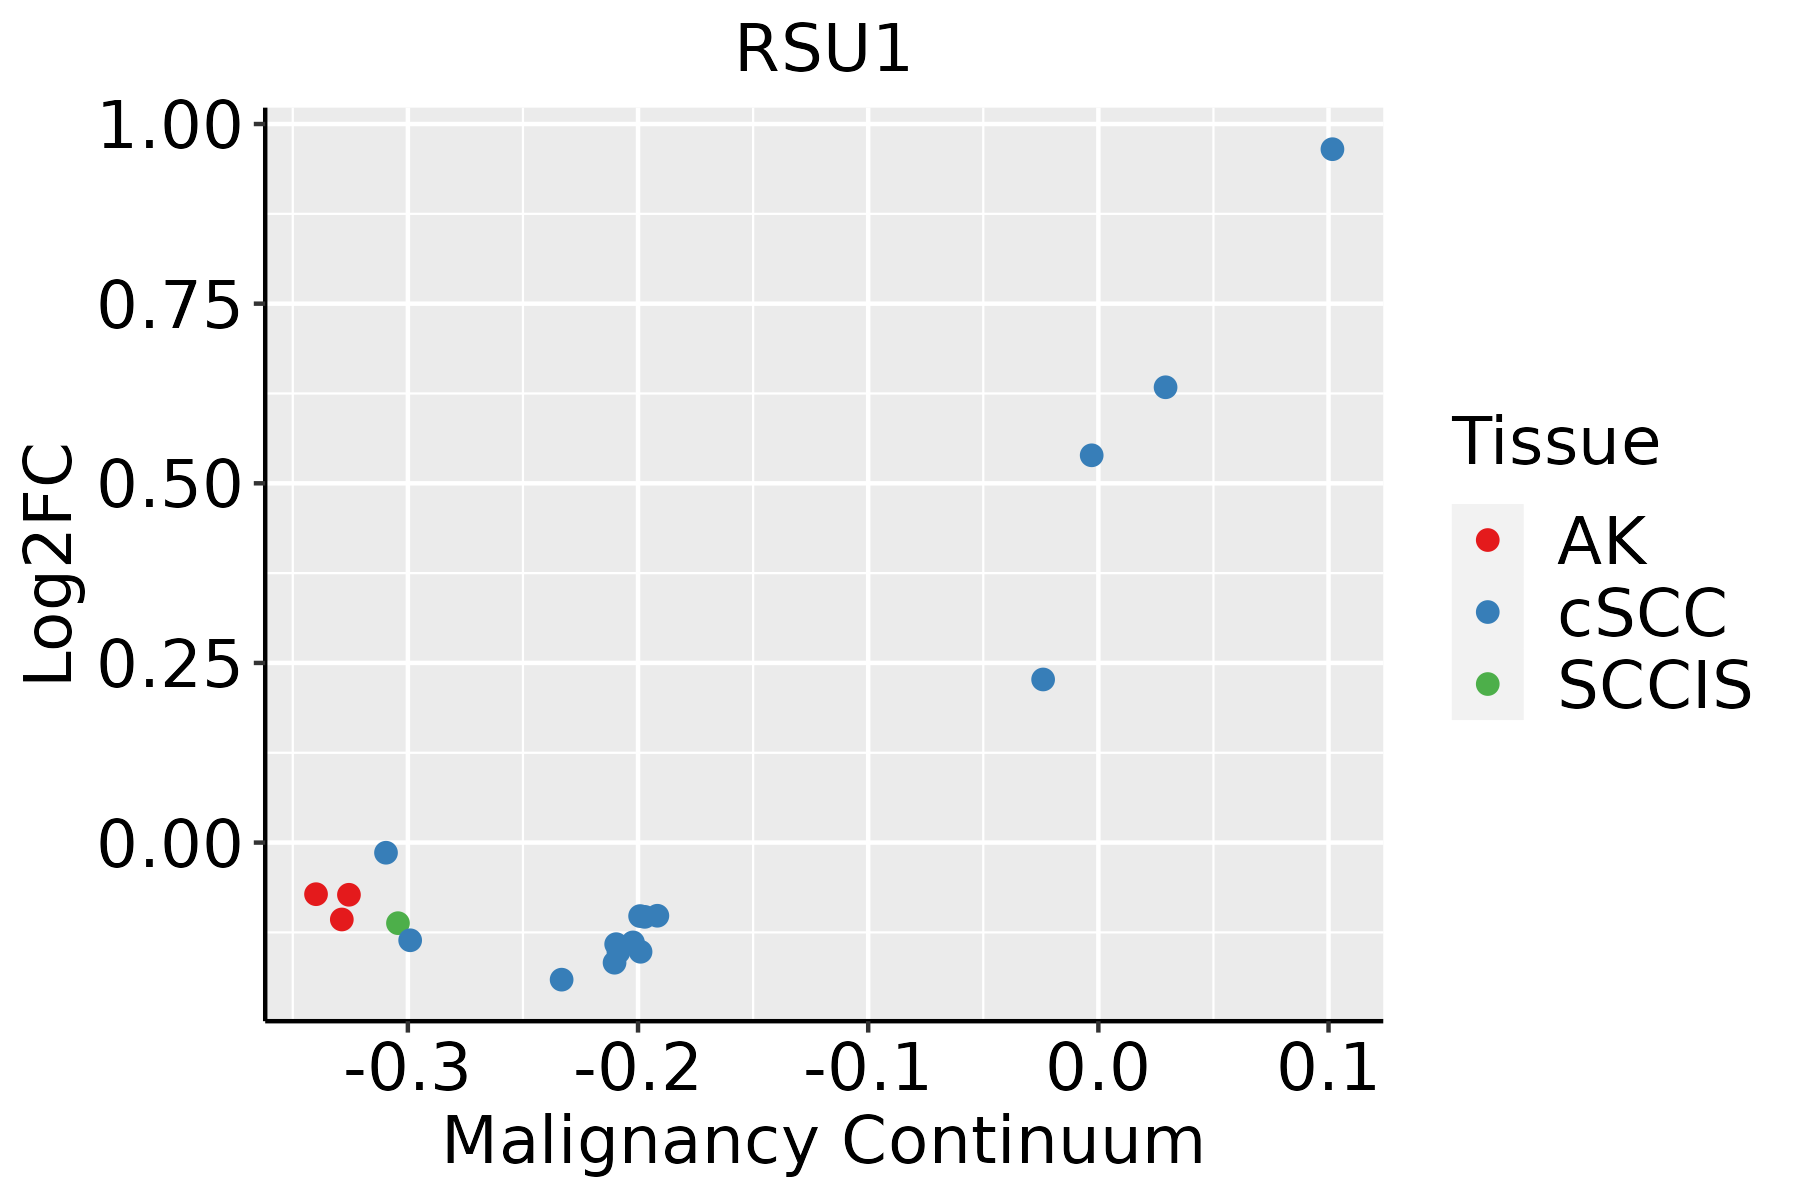 | AK: Actinic keratosis |
| cSCC: Cutaneous squamous cell carcinoma | ||
| SCCIS:squamous cell carcinoma in situ | ||
| Thyroid |  | ATC: Anaplastic thyroid cancer |
| HT: Hashimoto's thyroiditis | ||
| PTC: Papillary thyroid cancer |
| ∗log2FC in expression of this searched gene in stem-like cells from each diseased tissue sample relative to stem-like cells in normal samples in each tissue plotted against the malignancy continuum. Samples are colored based on if they are from different disease stage. |
Top |
Malignant transformation related pathway analysis |
| Find out the enriched GO biological processes and KEGG pathways involved in transition from healthy to precancer to cancer |
| Tissue | Disease Stage | Enriched GO biological Processes |
| Colorectum | AD |  |
| Colorectum | SER |  |
| Colorectum | MSS |  |
| Colorectum | MSI-H |  |
| Colorectum | FAP |  |
| ∗Top 15 enriched GO BP terms are showed in the bar plot of each disease state in each tissue. Each row represents a significant GO biological process which is colored according to the -log10(p.adjust). |
| Page: 1 2 3 4 5 6 7 8 9 |
| GO ID | Tissue | Disease Stage | Description | Gene Ratio | Bg Ratio | pvalue | p.adjust | Count |
| GO:0010811 | Colorectum | AD | positive regulation of cell-substrate adhesion | 53/3918 | 123/18723 | 2.30e-08 | 1.27e-06 | 53 |
| GO:0010810 | Colorectum | AD | regulation of cell-substrate adhesion | 81/3918 | 221/18723 | 4.80e-08 | 2.55e-06 | 81 |
| GO:0031589 | Colorectum | AD | cell-substrate adhesion | 116/3918 | 363/18723 | 4.68e-07 | 1.76e-05 | 116 |
| GO:0043087 | Colorectum | AD | regulation of GTPase activity | 110/3918 | 348/18723 | 1.64e-06 | 5.03e-05 | 110 |
| GO:0045785 | Colorectum | AD | positive regulation of cell adhesion | 122/3918 | 437/18723 | 2.65e-04 | 3.28e-03 | 122 |
| GO:0043547 | Colorectum | AD | positive regulation of GTPase activity | 75/3918 | 255/18723 | 7.95e-04 | 7.91e-03 | 75 |
| GO:00108102 | Colorectum | MSS | regulation of cell-substrate adhesion | 73/3467 | 221/18723 | 1.56e-07 | 7.16e-06 | 73 |
| GO:00108112 | Colorectum | MSS | positive regulation of cell-substrate adhesion | 47/3467 | 123/18723 | 2.28e-07 | 9.79e-06 | 47 |
| GO:00430872 | Colorectum | MSS | regulation of GTPase activity | 101/3467 | 348/18723 | 1.00e-06 | 3.46e-05 | 101 |
| GO:00315892 | Colorectum | MSS | cell-substrate adhesion | 104/3467 | 363/18723 | 1.35e-06 | 4.51e-05 | 104 |
| GO:00457852 | Colorectum | MSS | positive regulation of cell adhesion | 110/3467 | 437/18723 | 2.94e-04 | 3.87e-03 | 110 |
| GO:00435471 | Colorectum | MSS | positive regulation of GTPase activity | 68/3467 | 255/18723 | 7.97e-04 | 8.38e-03 | 68 |
| GO:00108104 | Colorectum | FAP | regulation of cell-substrate adhesion | 68/2622 | 221/18723 | 9.67e-11 | 2.96e-08 | 68 |
| GO:00315893 | Colorectum | FAP | cell-substrate adhesion | 93/2622 | 363/18723 | 2.48e-09 | 4.61e-07 | 93 |
| GO:00108114 | Colorectum | FAP | positive regulation of cell-substrate adhesion | 43/2622 | 123/18723 | 3.82e-09 | 6.33e-07 | 43 |
| GO:00430873 | Colorectum | FAP | regulation of GTPase activity | 85/2622 | 348/18723 | 1.20e-07 | 7.68e-06 | 85 |
| GO:00435472 | Colorectum | FAP | positive regulation of GTPase activity | 61/2622 | 255/18723 | 1.39e-05 | 3.73e-04 | 61 |
| GO:00457854 | Colorectum | FAP | positive regulation of cell adhesion | 92/2622 | 437/18723 | 3.09e-05 | 7.04e-04 | 92 |
| GO:00108105 | Colorectum | CRC | regulation of cell-substrate adhesion | 57/2078 | 221/18723 | 6.94e-10 | 2.60e-07 | 57 |
| GO:00315894 | Colorectum | CRC | cell-substrate adhesion | 78/2078 | 363/18723 | 6.22e-09 | 1.49e-06 | 78 |
| Page: 1 2 3 4 |
| Pathway ID | Tissue | Disease Stage | Description | Gene Ratio | Bg Ratio | pvalue | p.adjust | qvalue | Count |
| Page: 1 |
Top |
Cell-cell communication analysis |
| Identification of potential cell-cell interactions between two cell types and their ligand-receptor pairs for different disease states |
| Ligand | Receptor | LRpair | Pathway | Tissue | Disease Stage |
| Page: 1 |
Top |
Single-cell gene regulatory network inference analysis |
| Find out the significant the regulons (TFs) and the target genes of each regulon across cell types for different disease states |
| TF | Cell Type | Tissue | Disease Stage | Target Gene | RSS | Regulon Activity |
| ∗The dot plots of a searched regulon are shown for all cell subpopulations in each disease state of each tissue based on the regulon specific score inferred using pySCENIC and by calculating the average expression. |
| Page: 1 |
Top |
Somatic mutation of malignant transformation related genes |
| Annotation of somatic variants for genes involved in malignant transformation |
| Hugo Symbol | Variant Class | Variant Classification | dbSNP RS | HGVSc | HGVSp | HGVSp Short | SWISSPROT | BIOTYPE | SIFT | PolyPhen | Tumor Sample Barcode | Tissue | Histology | Sex | Age | Stage | Therapy Types | Drugs | Outcome |
| RSU1 | SNV | Missense_Mutation | rs144428707 | c.688N>A | p.Val230Met | p.V230M | Q15404 | protein_coding | deleterious(0.02) | benign(0.115) | TCGA-5M-AAT6-01 | Colorectum | colon adenocarcinoma | Female | <65 | III/IV | Unknown | Unknown | PD |
| RSU1 | SNV | Missense_Mutation | c.812N>T | p.Pro271Leu | p.P271L | Q15404 | protein_coding | tolerated_low_confidence(0.07) | possibly_damaging(0.829) | TCGA-D5-6530-01 | Colorectum | colon adenocarcinoma | Male | <65 | I/II | Unknown | Unknown | SD | |
| RSU1 | SNV | Missense_Mutation | c.202N>T | p.Leu68Phe | p.L68F | Q15404 | protein_coding | deleterious(0.03) | probably_damaging(1) | TCGA-G4-6304-01 | Colorectum | colon adenocarcinoma | Female | >=65 | I/II | Chemotherapy | fluorouracil | PD | |
| RSU1 | SNV | Missense_Mutation | rs116907560 | c.410N>A | p.Arg137His | p.R137H | Q15404 | protein_coding | deleterious(0) | probably_damaging(0.995) | TCGA-A5-A0G2-01 | Endometrium | uterine corpus endometrioid carcinoma | Female | <65 | III/IV | Unknown | Unknown | SD |
| RSU1 | SNV | Missense_Mutation | novel | c.659N>T | p.Thr220Ile | p.T220I | Q15404 | protein_coding | tolerated(0.17) | benign(0.067) | TCGA-AJ-A3EK-01 | Endometrium | uterine corpus endometrioid carcinoma | Female | <65 | I/II | Chemotherapy | carboplatin | CR |
| RSU1 | SNV | Missense_Mutation | rs749086834 | c.777N>T | p.Lys259Asn | p.K259N | Q15404 | protein_coding | tolerated(0.06) | probably_damaging(0.942) | TCGA-AX-A05Z-01 | Endometrium | uterine corpus endometrioid carcinoma | Female | <65 | III/IV | Chemotherapy | adriamycin | SD |
| RSU1 | SNV | Missense_Mutation | novel | c.502N>A | p.Asp168Asn | p.D168N | Q15404 | protein_coding | tolerated(0.11) | possibly_damaging(0.659) | TCGA-AX-A1CE-01 | Endometrium | uterine corpus endometrioid carcinoma | Female | <65 | I/II | Unspecific | Paclitaxel | SD |
| RSU1 | SNV | Missense_Mutation | rs200600927 | c.572N>A | p.Arg191His | p.R191H | Q15404 | protein_coding | deleterious(0.01) | probably_damaging(0.989) | TCGA-AX-A2H5-01 | Endometrium | uterine corpus endometrioid carcinoma | Female | >=65 | III/IV | Chemotherapy | carboplatin | CR |
| RSU1 | SNV | Missense_Mutation | novel | c.791N>T | p.Ser264Leu | p.S264L | Q15404 | protein_coding | deleterious(0.01) | benign(0.06) | TCGA-D1-A1O5-01 | Endometrium | uterine corpus endometrioid carcinoma | Female | <65 | I/II | Unknown | Unknown | SD |
| RSU1 | SNV | Missense_Mutation | novel | c.637G>T | p.Ala213Ser | p.A213S | Q15404 | protein_coding | tolerated(0.08) | benign(0.115) | TCGA-EO-A22R-01 | Endometrium | uterine corpus endometrioid carcinoma | Female | <65 | I/II | Unknown | Unknown | SD |
| Page: 1 2 3 |
Top |
Related drugs of malignant transformation related genes |
| Identification of chemicals and drugs interact with genes involved in malignant transfromation |
| (DGIdb 4.0) |
| Entrez ID | Symbol | Category | Interaction Types | Drug Claim Name | Drug Name | PMIDs |
| Page: 1 |

Copyright 2023-Present -The University of Texas Health Science Center at Houston |