
|
|||||
|
 | |
| |
| |
| |
| |
| |
|
Gene: RSRC2 |
Gene summary for RSRC2 |
| Gene information | Species | Human | Gene symbol | RSRC2 | Gene ID | 65117 |
| Gene name | arginine and serine rich coiled-coil 2 | |
| Gene Alias | RSRC2 | |
| Cytomap | 12q24.31 | |
| Gene Type | protein-coding | GO ID | GO:0003674 | UniProtAcc | Q7L4I2 |
Top |
Malignant transformation analysis |
| Identification of the aberrant gene expression in precancerous and cancerous lesions by comparing the gene expression of stem-like cells in diseased tissues with normal stem cells |
| Entrez ID | Symbol | Replicates | Species | Organ | Tissue | Adj P-value | Log2FC | Malignancy |
| 65117 | RSRC2 | GSM4909277 | Human | Breast | Precancer | 1.43e-03 | 6.51e-01 | 0.0177 |
| 65117 | RSRC2 | GSM4909280 | Human | Breast | Precancer | 1.42e-02 | 4.63e-01 | 0.0305 |
| 65117 | RSRC2 | GSM4909285 | Human | Breast | IDC | 1.26e-02 | -2.40e-01 | 0.21 |
| 65117 | RSRC2 | GSM4909286 | Human | Breast | IDC | 1.50e-03 | -1.88e-01 | 0.1081 |
| 65117 | RSRC2 | GSM4909293 | Human | Breast | IDC | 4.39e-07 | 1.63e-01 | 0.1581 |
| 65117 | RSRC2 | GSM4909296 | Human | Breast | IDC | 3.65e-10 | -3.89e-01 | 0.1524 |
| 65117 | RSRC2 | GSM4909297 | Human | Breast | IDC | 2.09e-15 | -3.40e-01 | 0.1517 |
| 65117 | RSRC2 | GSM4909311 | Human | Breast | IDC | 2.12e-24 | -4.81e-01 | 0.1534 |
| 65117 | RSRC2 | GSM4909312 | Human | Breast | IDC | 2.72e-08 | -3.51e-01 | 0.1552 |
| 65117 | RSRC2 | GSM4909313 | Human | Breast | IDC | 7.63e-07 | -3.06e-01 | 0.0391 |
| 65117 | RSRC2 | GSM4909319 | Human | Breast | IDC | 4.03e-36 | -3.94e-01 | 0.1563 |
| 65117 | RSRC2 | GSM4909320 | Human | Breast | IDC | 3.68e-04 | -2.03e-01 | 0.1575 |
| 65117 | RSRC2 | GSM4909321 | Human | Breast | IDC | 2.40e-09 | -3.99e-01 | 0.1559 |
| 65117 | RSRC2 | brca2 | Human | Breast | Precancer | 7.46e-03 | -1.60e-01 | -0.024 |
| 65117 | RSRC2 | NCCBC14 | Human | Breast | DCIS | 5.83e-11 | -3.27e-01 | 0.2021 |
| 65117 | RSRC2 | NCCBC2 | Human | Breast | DCIS | 2.20e-03 | -4.91e-01 | 0.1554 |
| 65117 | RSRC2 | NCCBC5 | Human | Breast | DCIS | 8.01e-13 | -3.96e-01 | 0.2046 |
| 65117 | RSRC2 | P1 | Human | Breast | IDC | 4.55e-17 | -3.38e-01 | 0.1527 |
| 65117 | RSRC2 | DCIS2 | Human | Breast | DCIS | 5.53e-47 | 9.27e-02 | 0.0085 |
| 65117 | RSRC2 | AEH-subject2 | Human | Endometrium | AEH | 4.61e-06 | -2.93e-01 | -0.2525 |
| Page: 1 2 3 4 5 6 7 8 9 10 11 |
| Tissue | Expression Dynamics | Abbreviation |
| Breast | 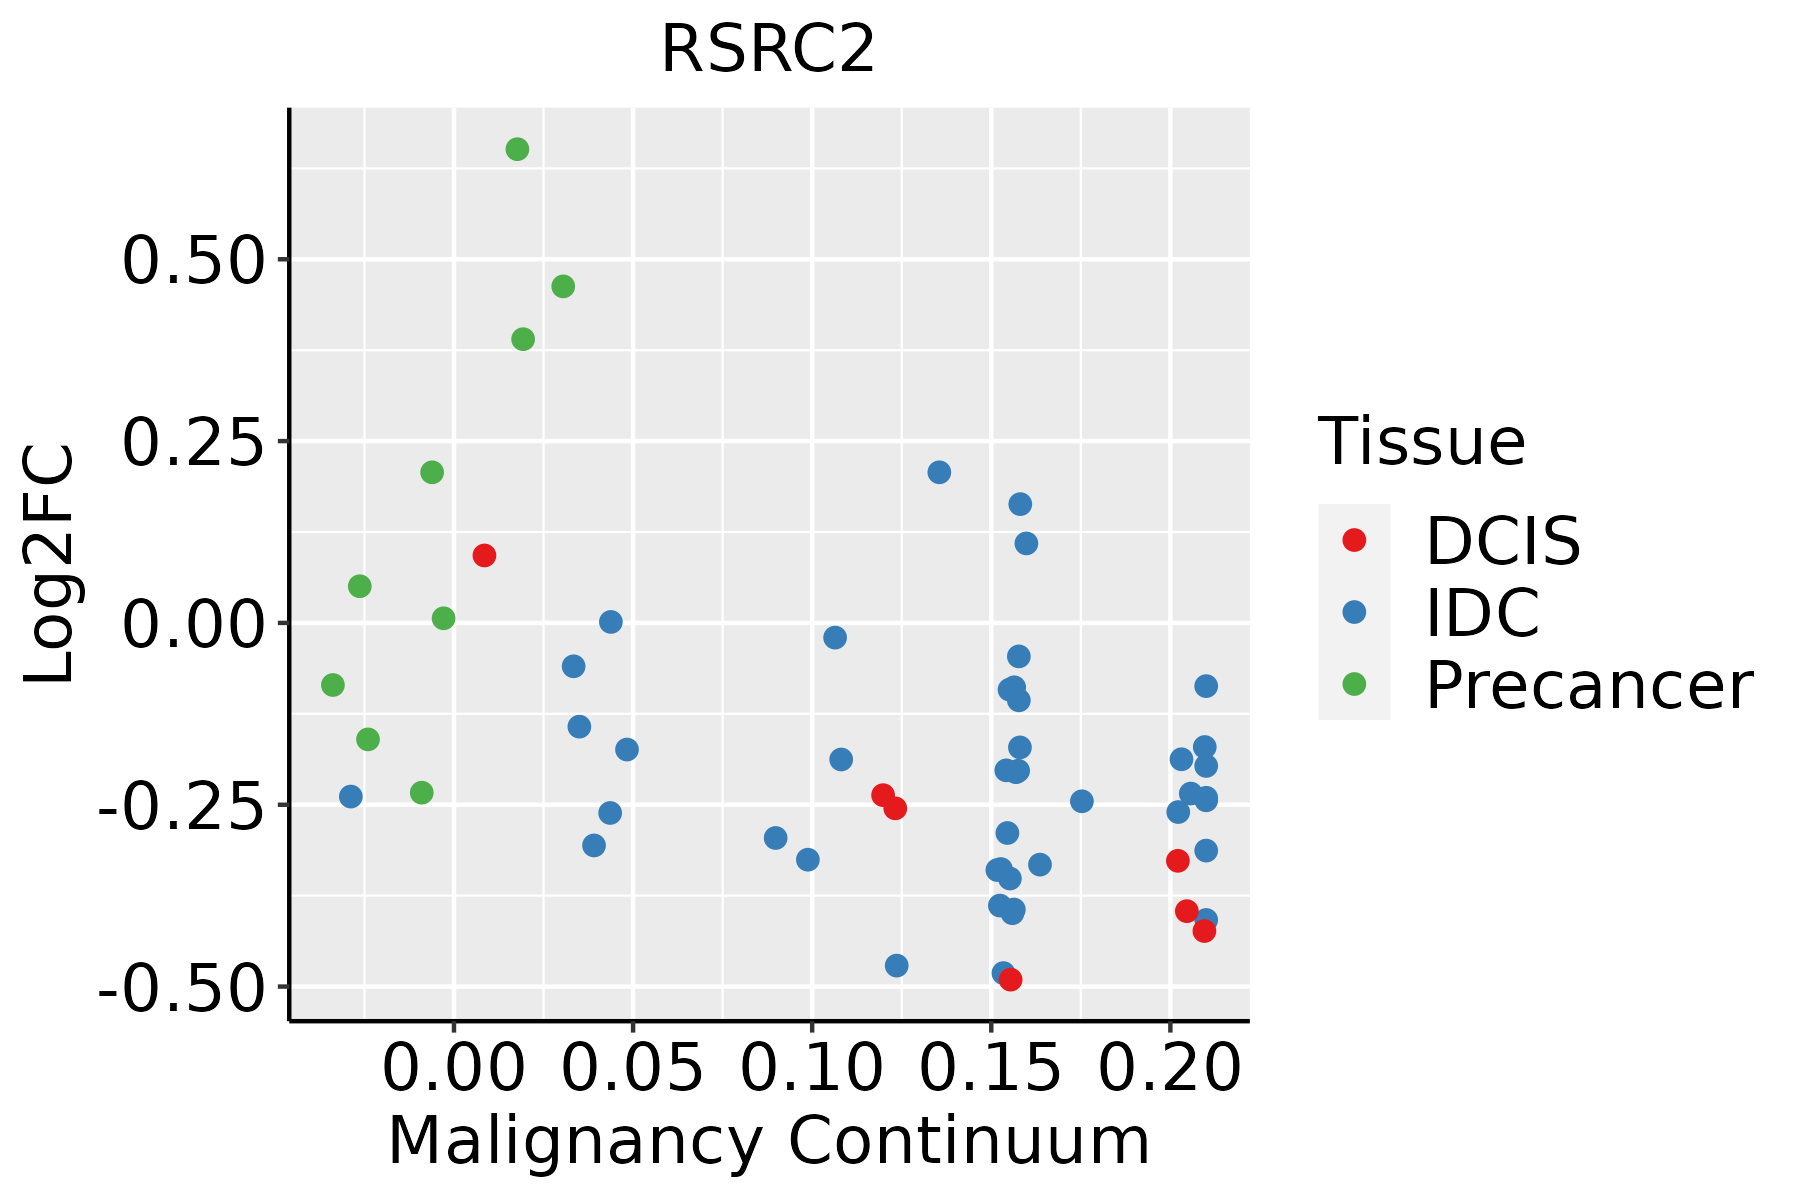 | IDC: Invasive ductal carcinoma |
| DCIS: Ductal carcinoma in situ | ||
| Precancer(BRCA1-mut): Precancerous lesion from BRCA1 mutation carriers | ||
| Endometrium | 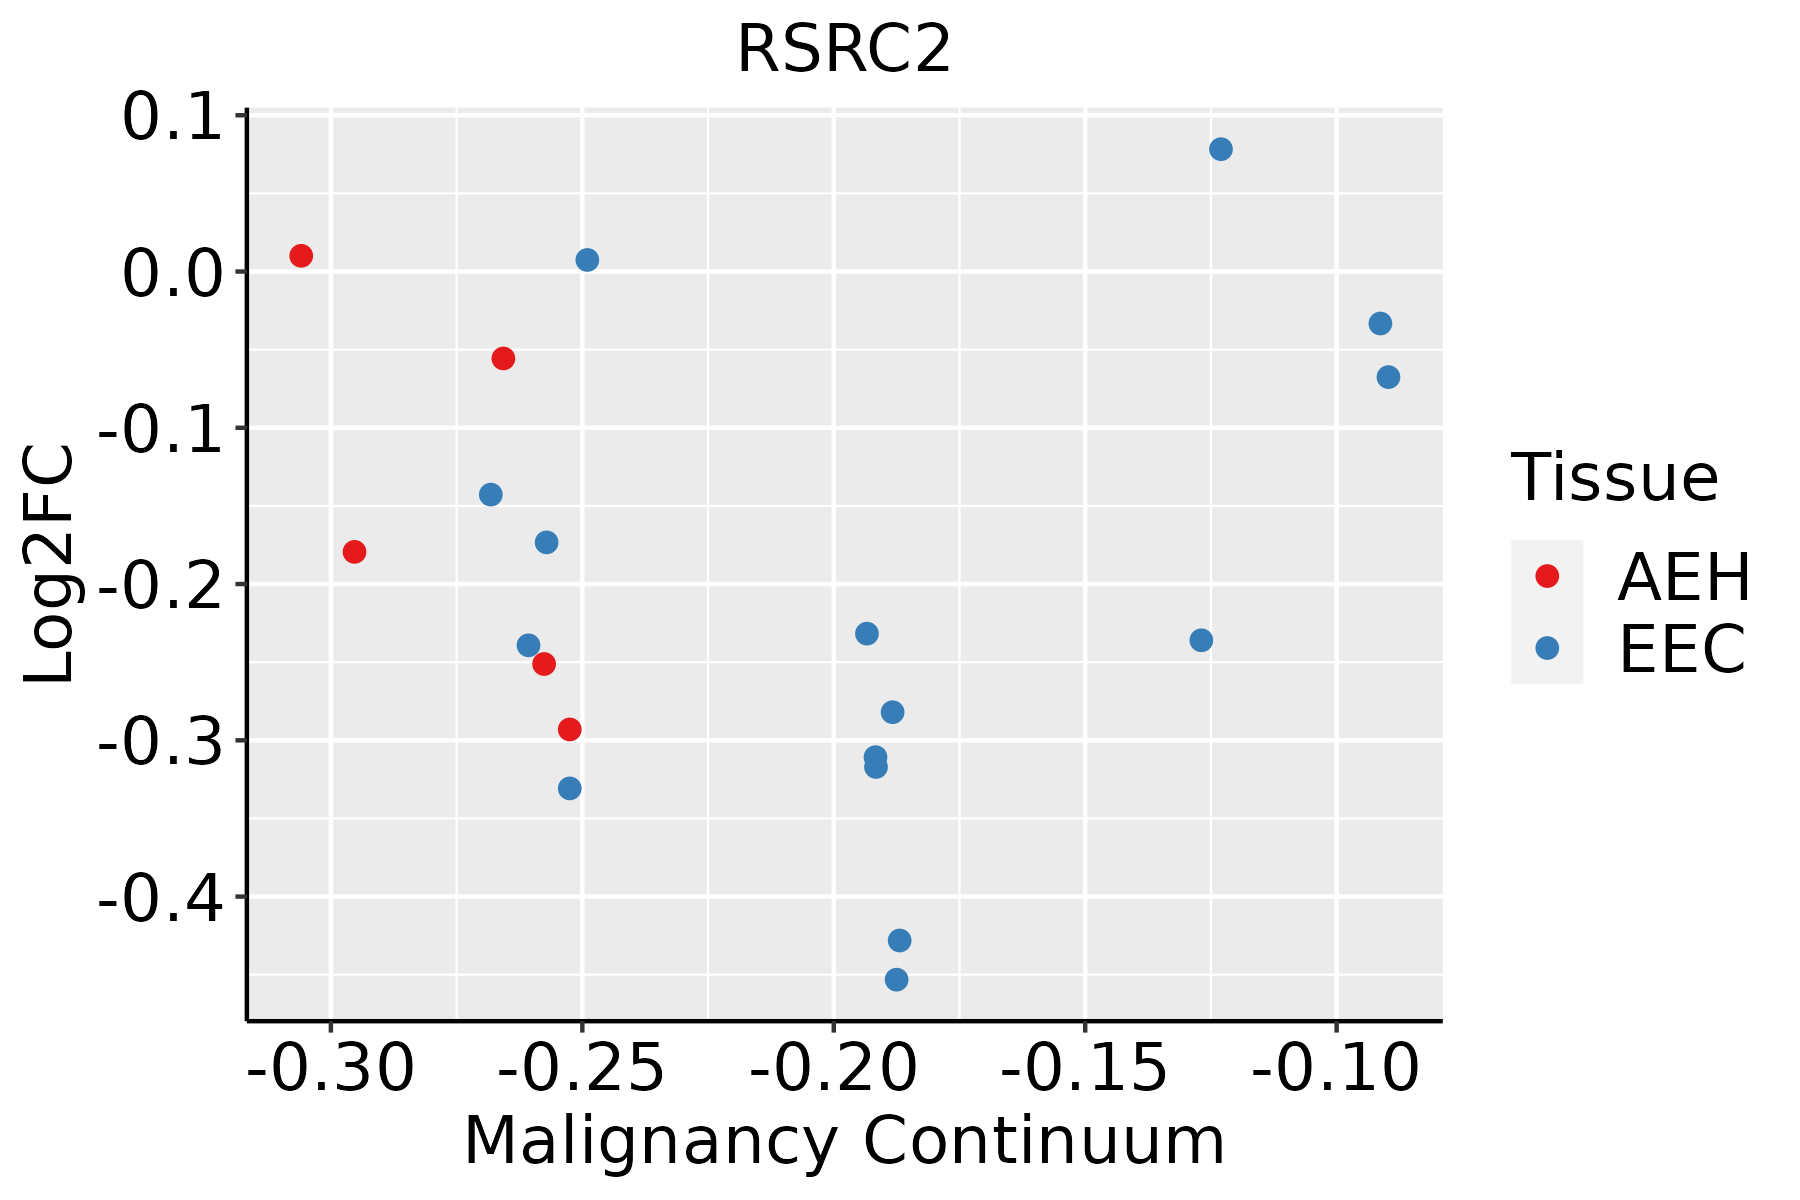 | AEH: Atypical endometrial hyperplasia |
| EEC: Endometrioid Cancer | ||
| Esophagus | 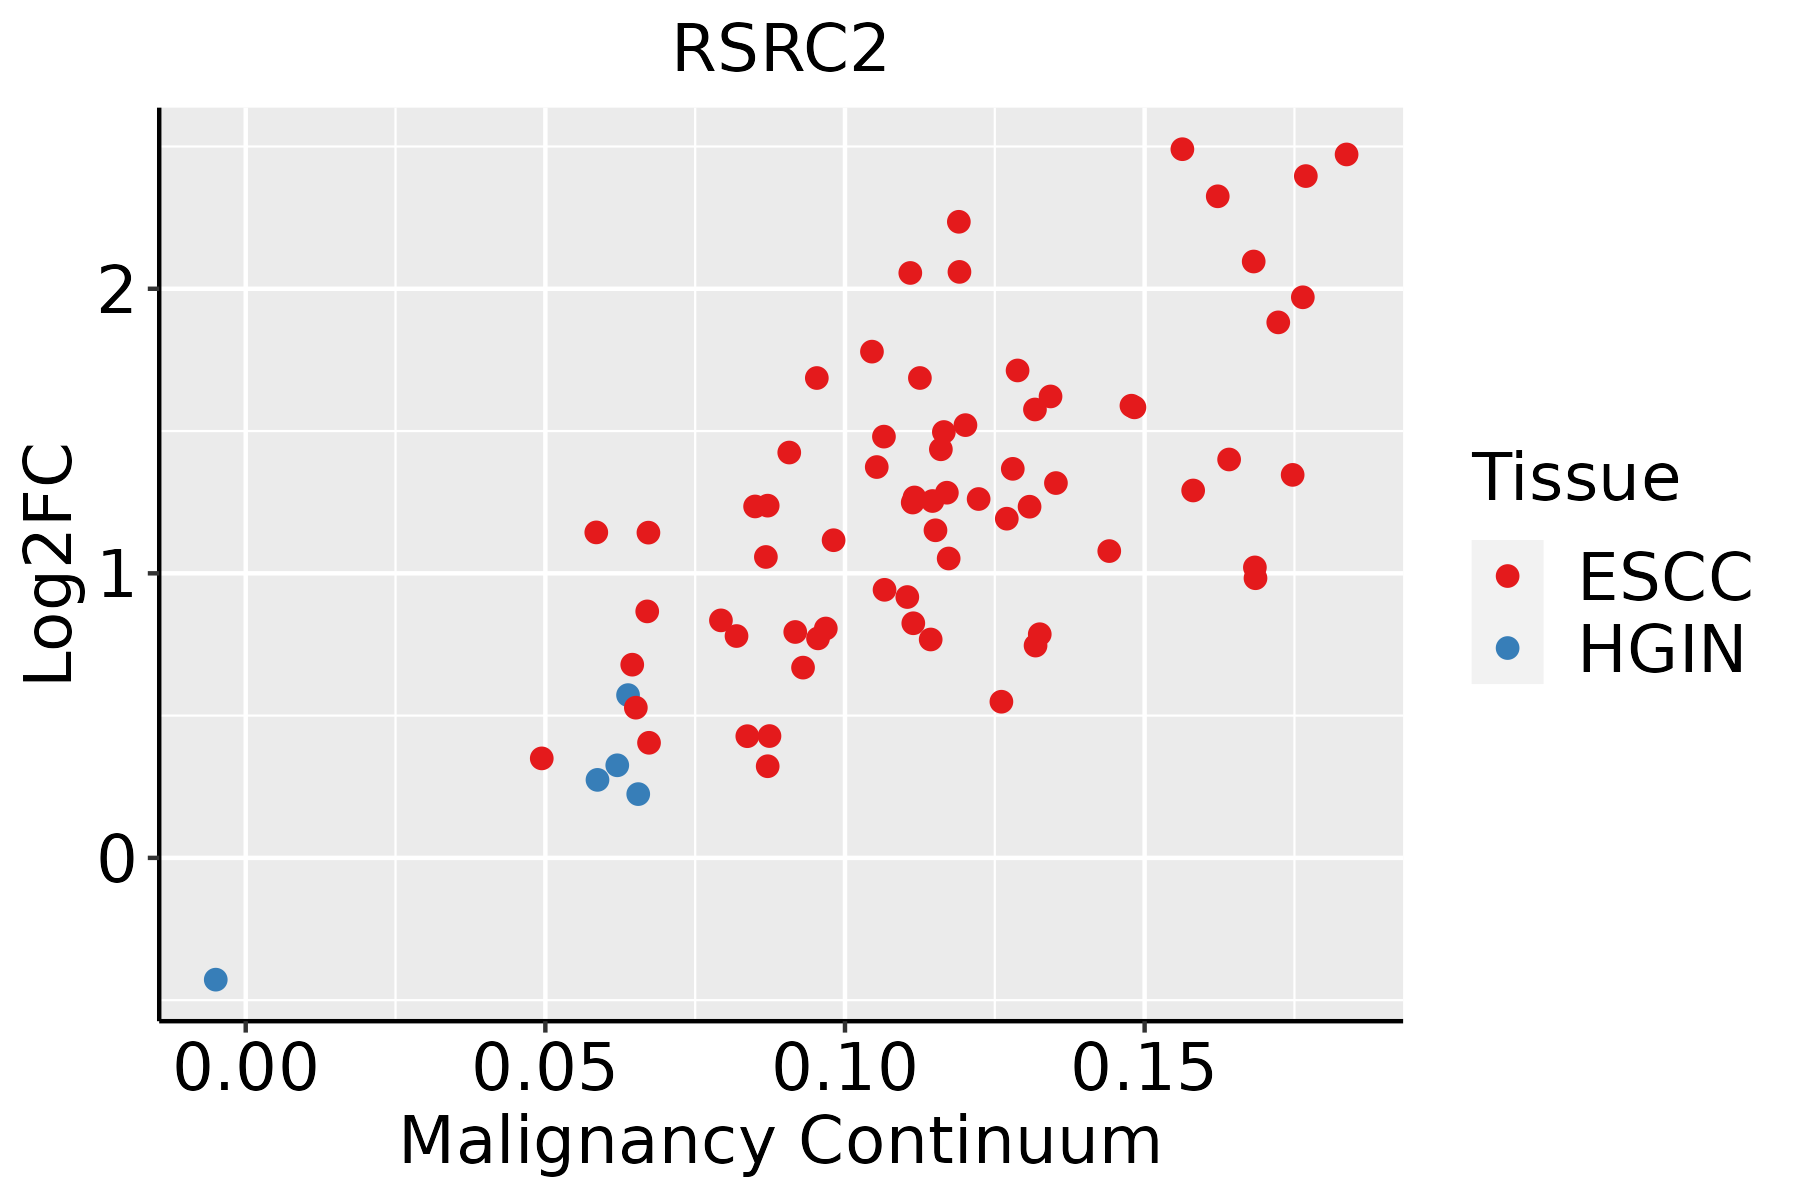 | ESCC: Esophageal squamous cell carcinoma |
| HGIN: High-grade intraepithelial neoplasias | ||
| LGIN: Low-grade intraepithelial neoplasias | ||
| Liver | 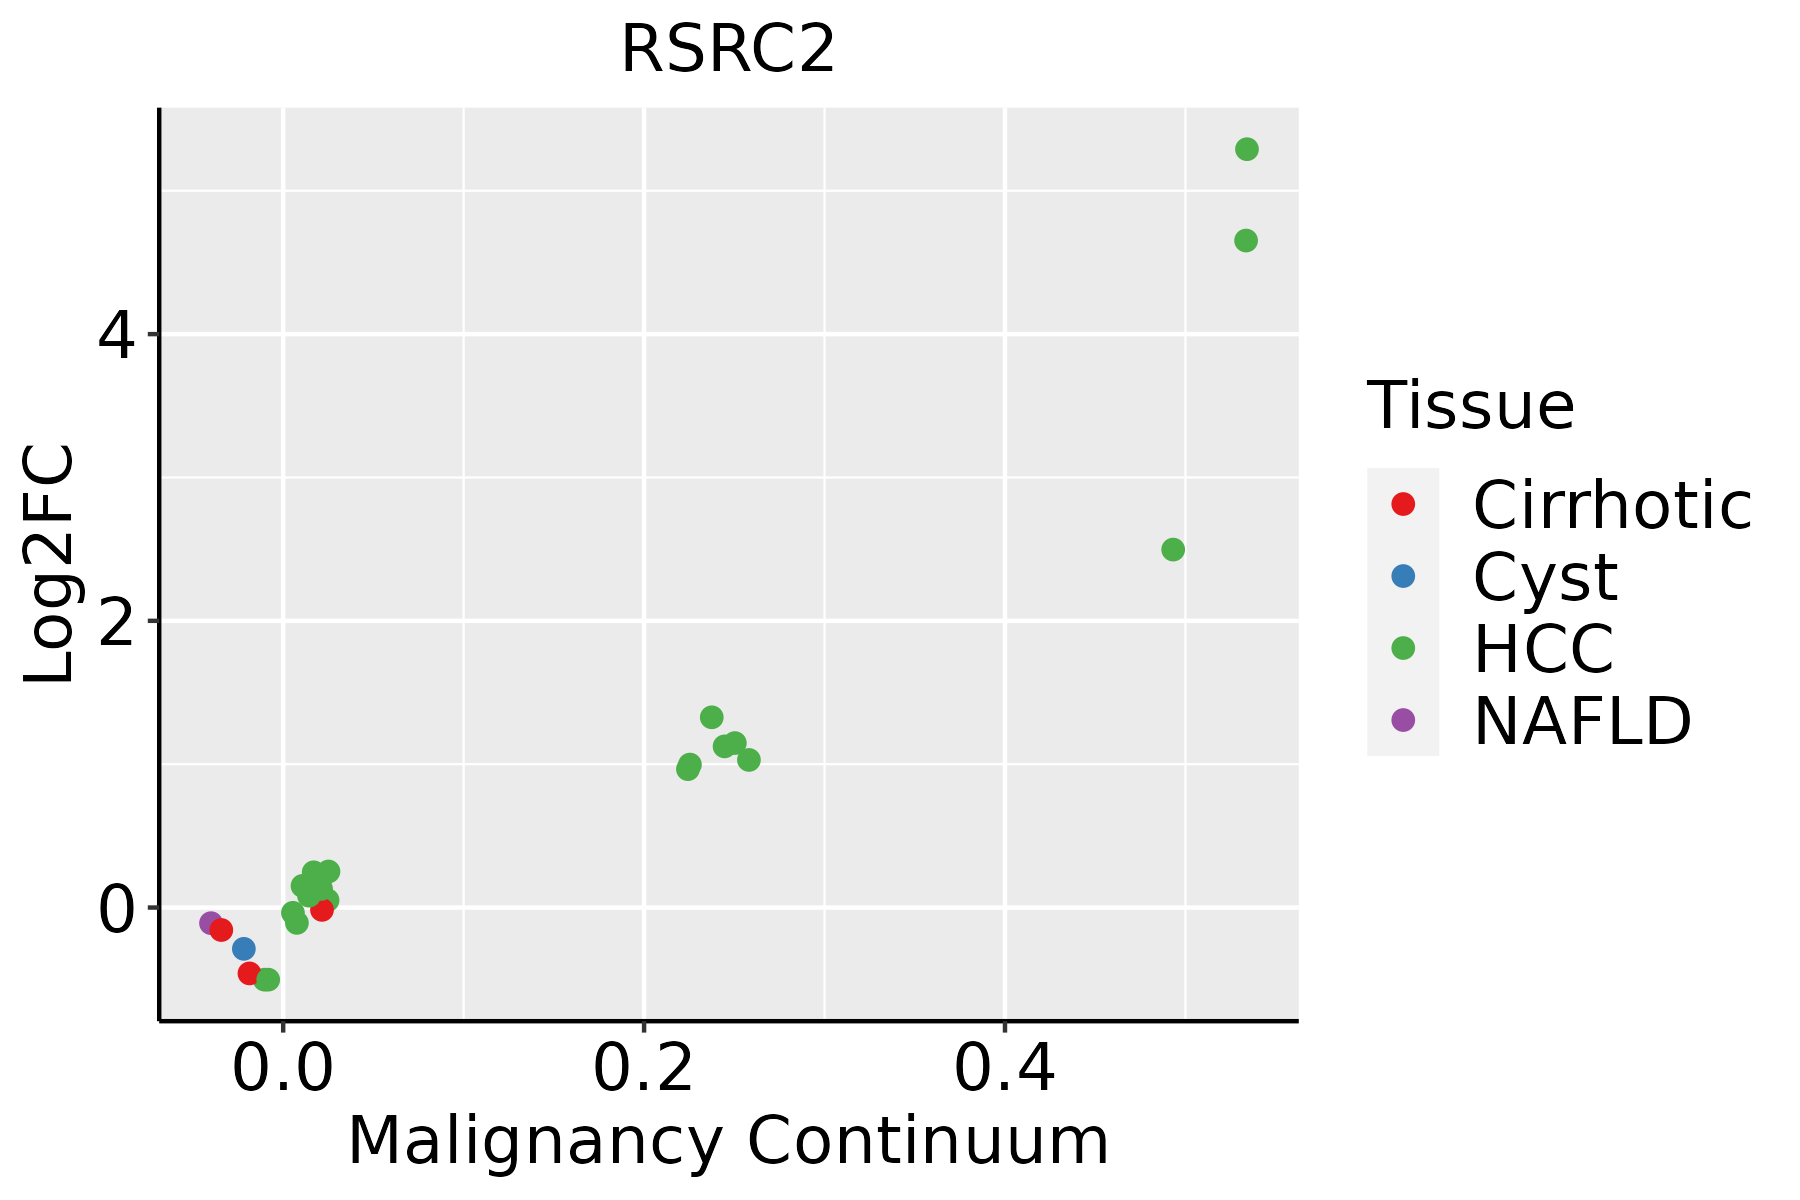 | HCC: Hepatocellular carcinoma |
| NAFLD: Non-alcoholic fatty liver disease | ||
| Lung | 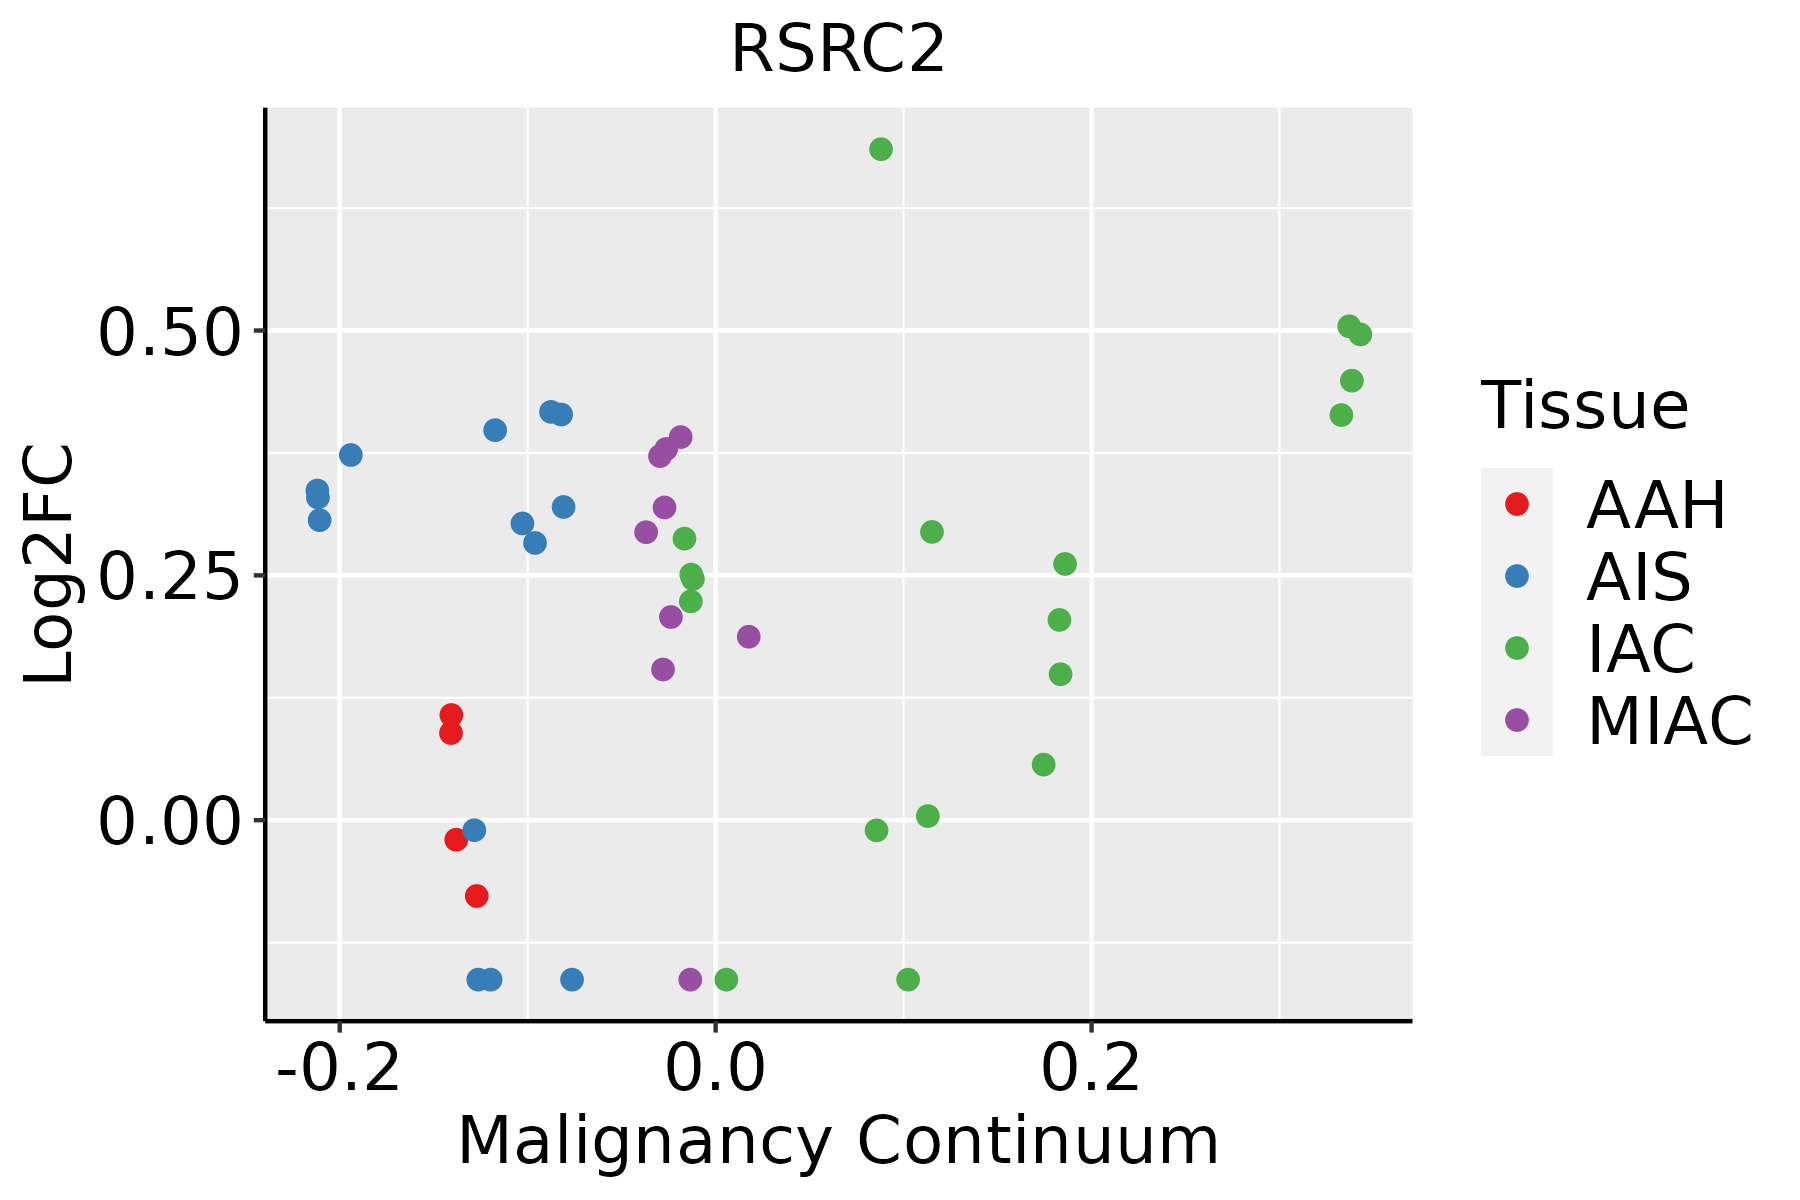 | AAH: Atypical adenomatous hyperplasia |
| AIS: Adenocarcinoma in situ | ||
| IAC: Invasive lung adenocarcinoma | ||
| MIA: Minimally invasive adenocarcinoma | ||
| Oral Cavity | 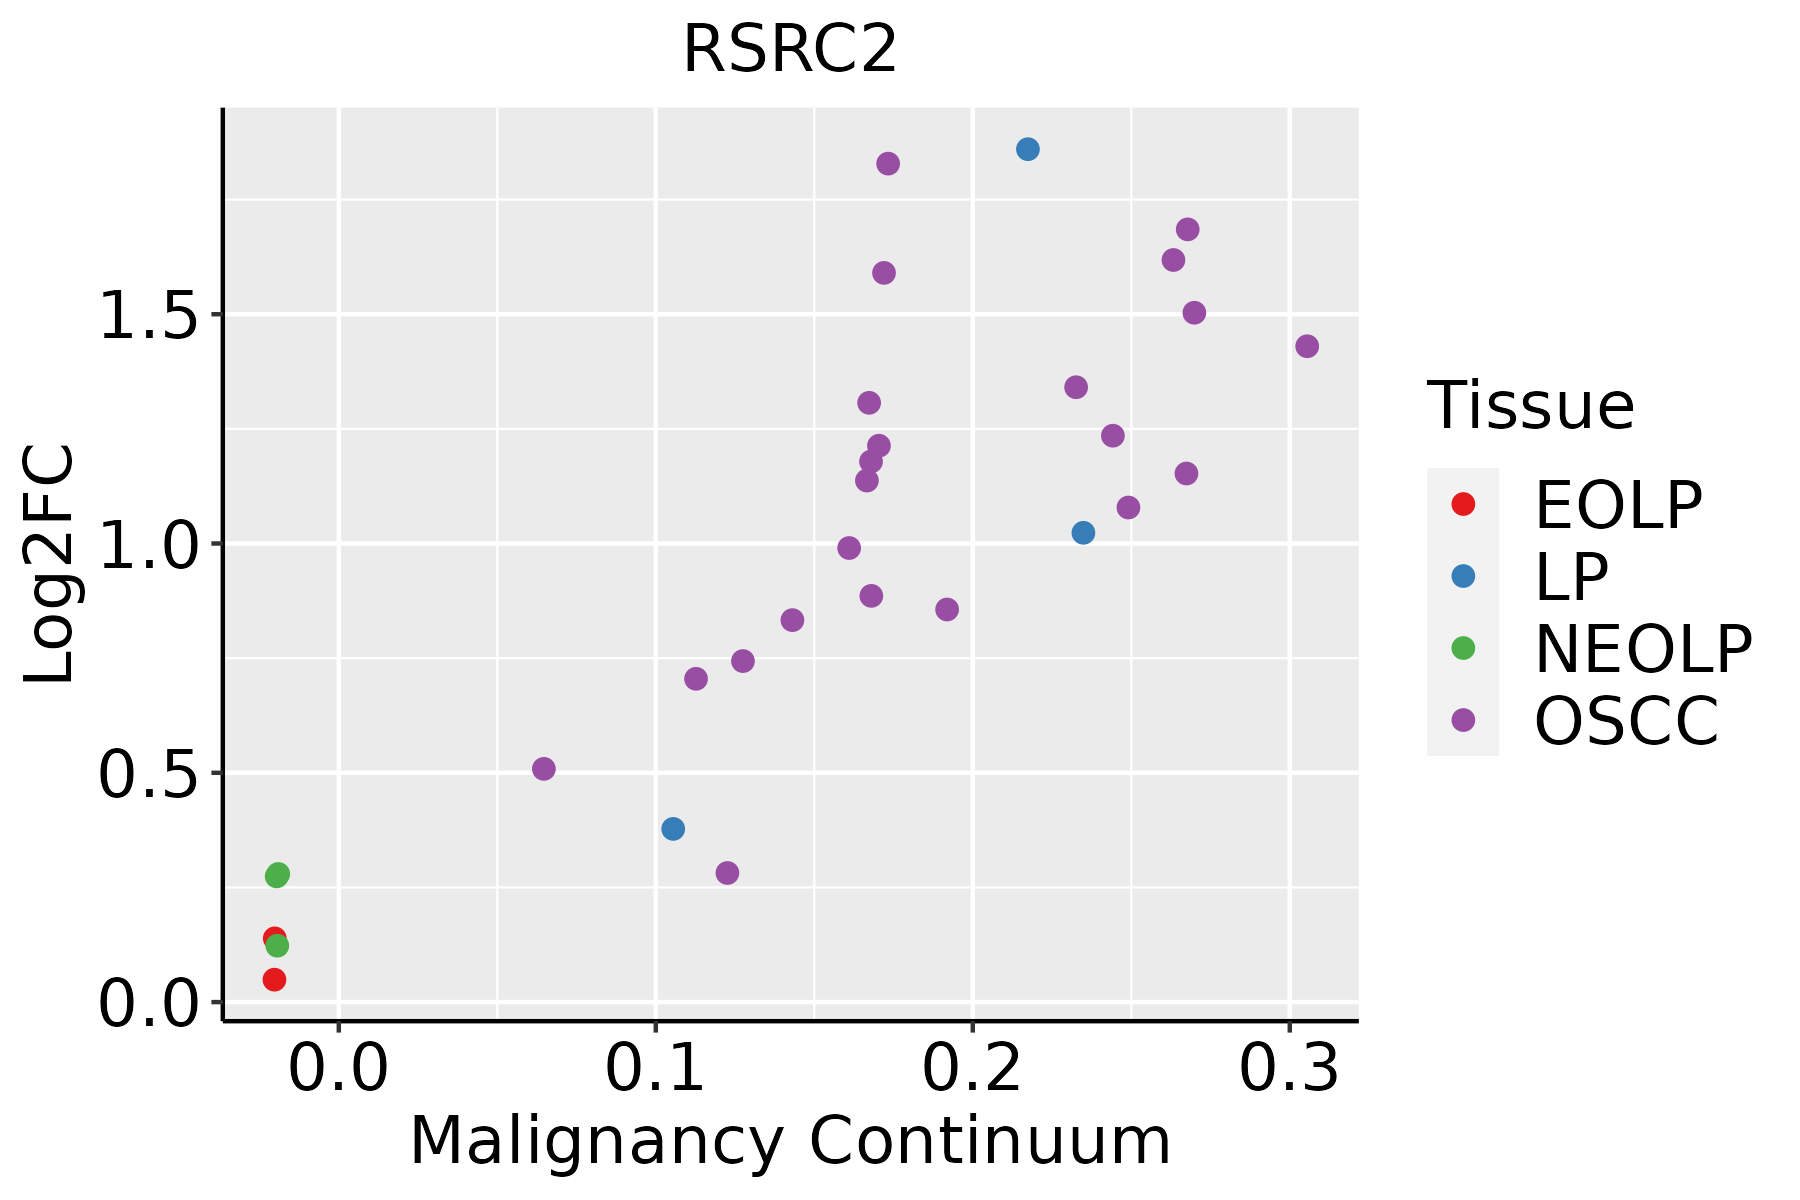 | EOLP: Erosive Oral lichen planus |
| LP: leukoplakia | ||
| NEOLP: Non-erosive oral lichen planus | ||
| OSCC: Oral squamous cell carcinoma | ||
| Prostate | 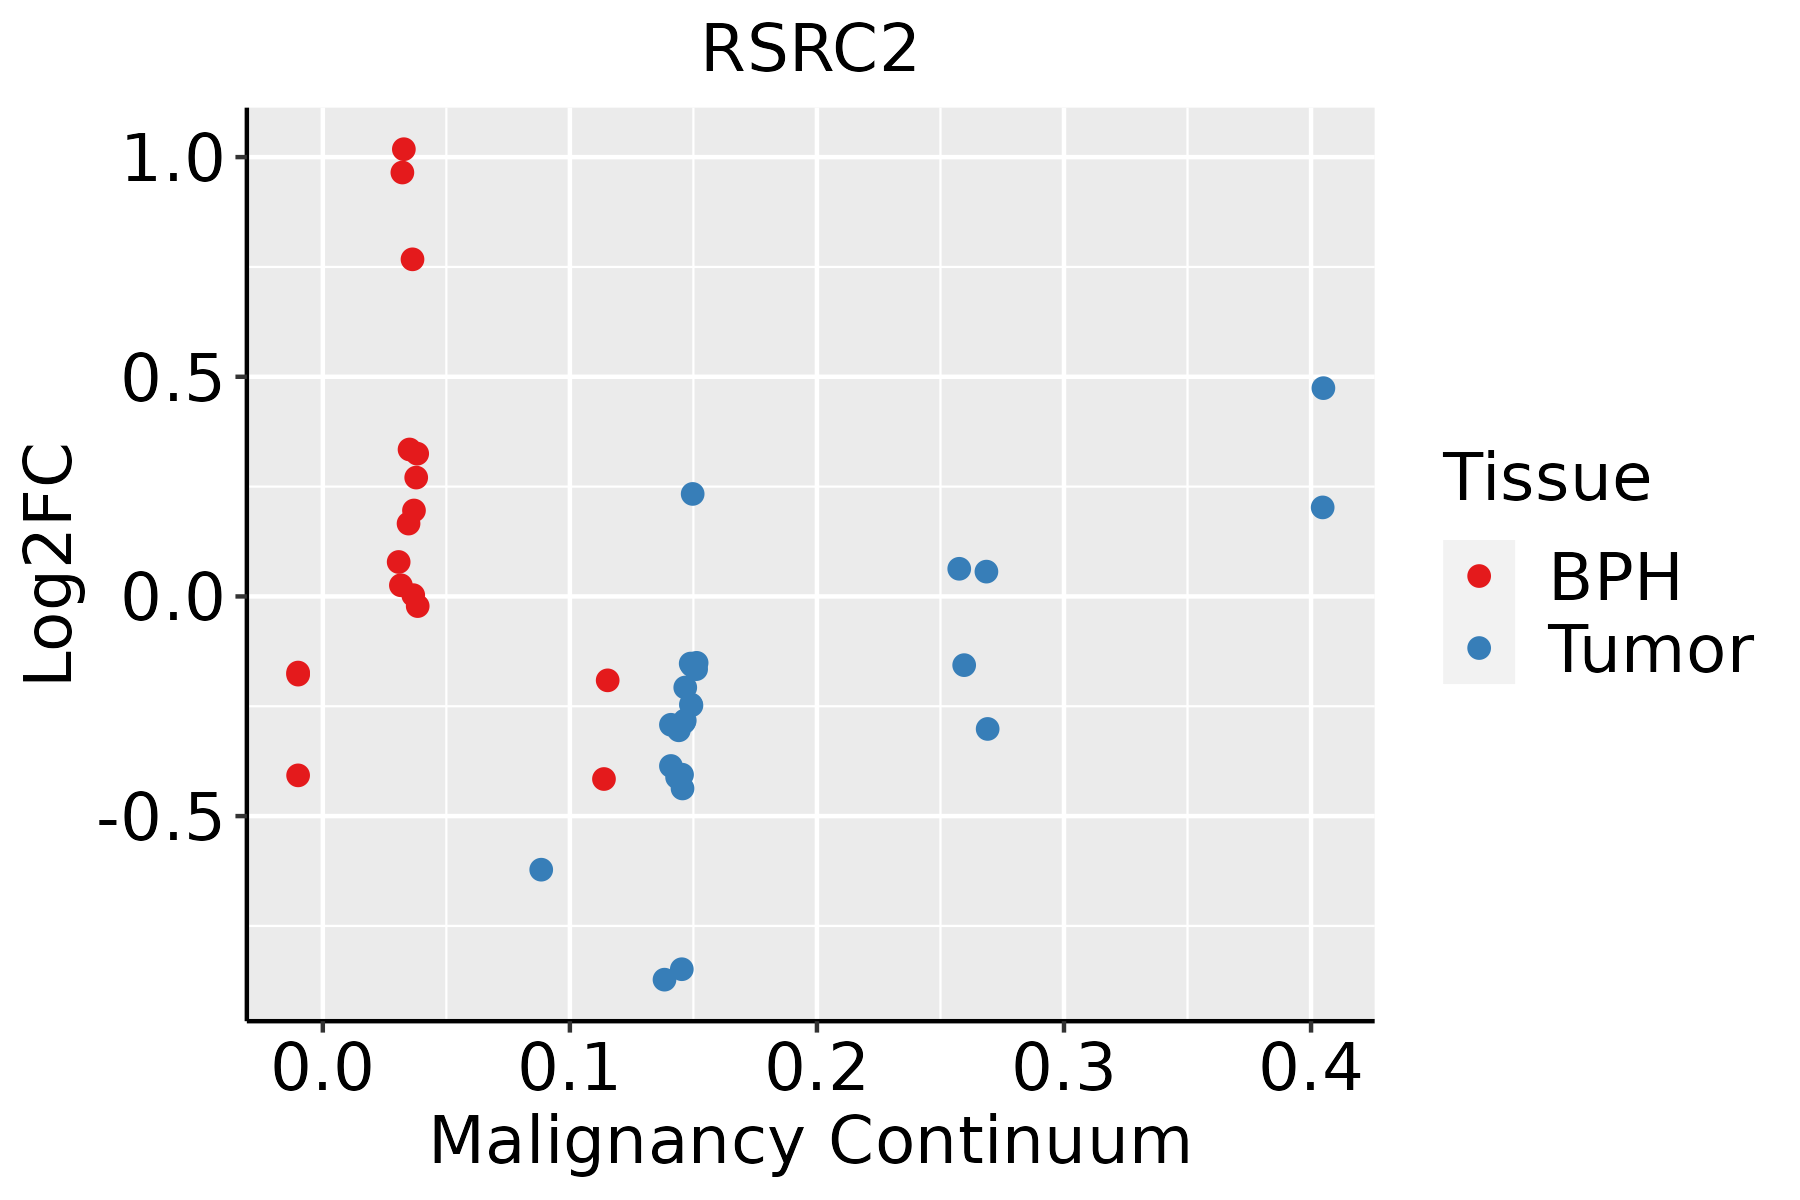 | BPH: Benign Prostatic Hyperplasia |
| Skin | 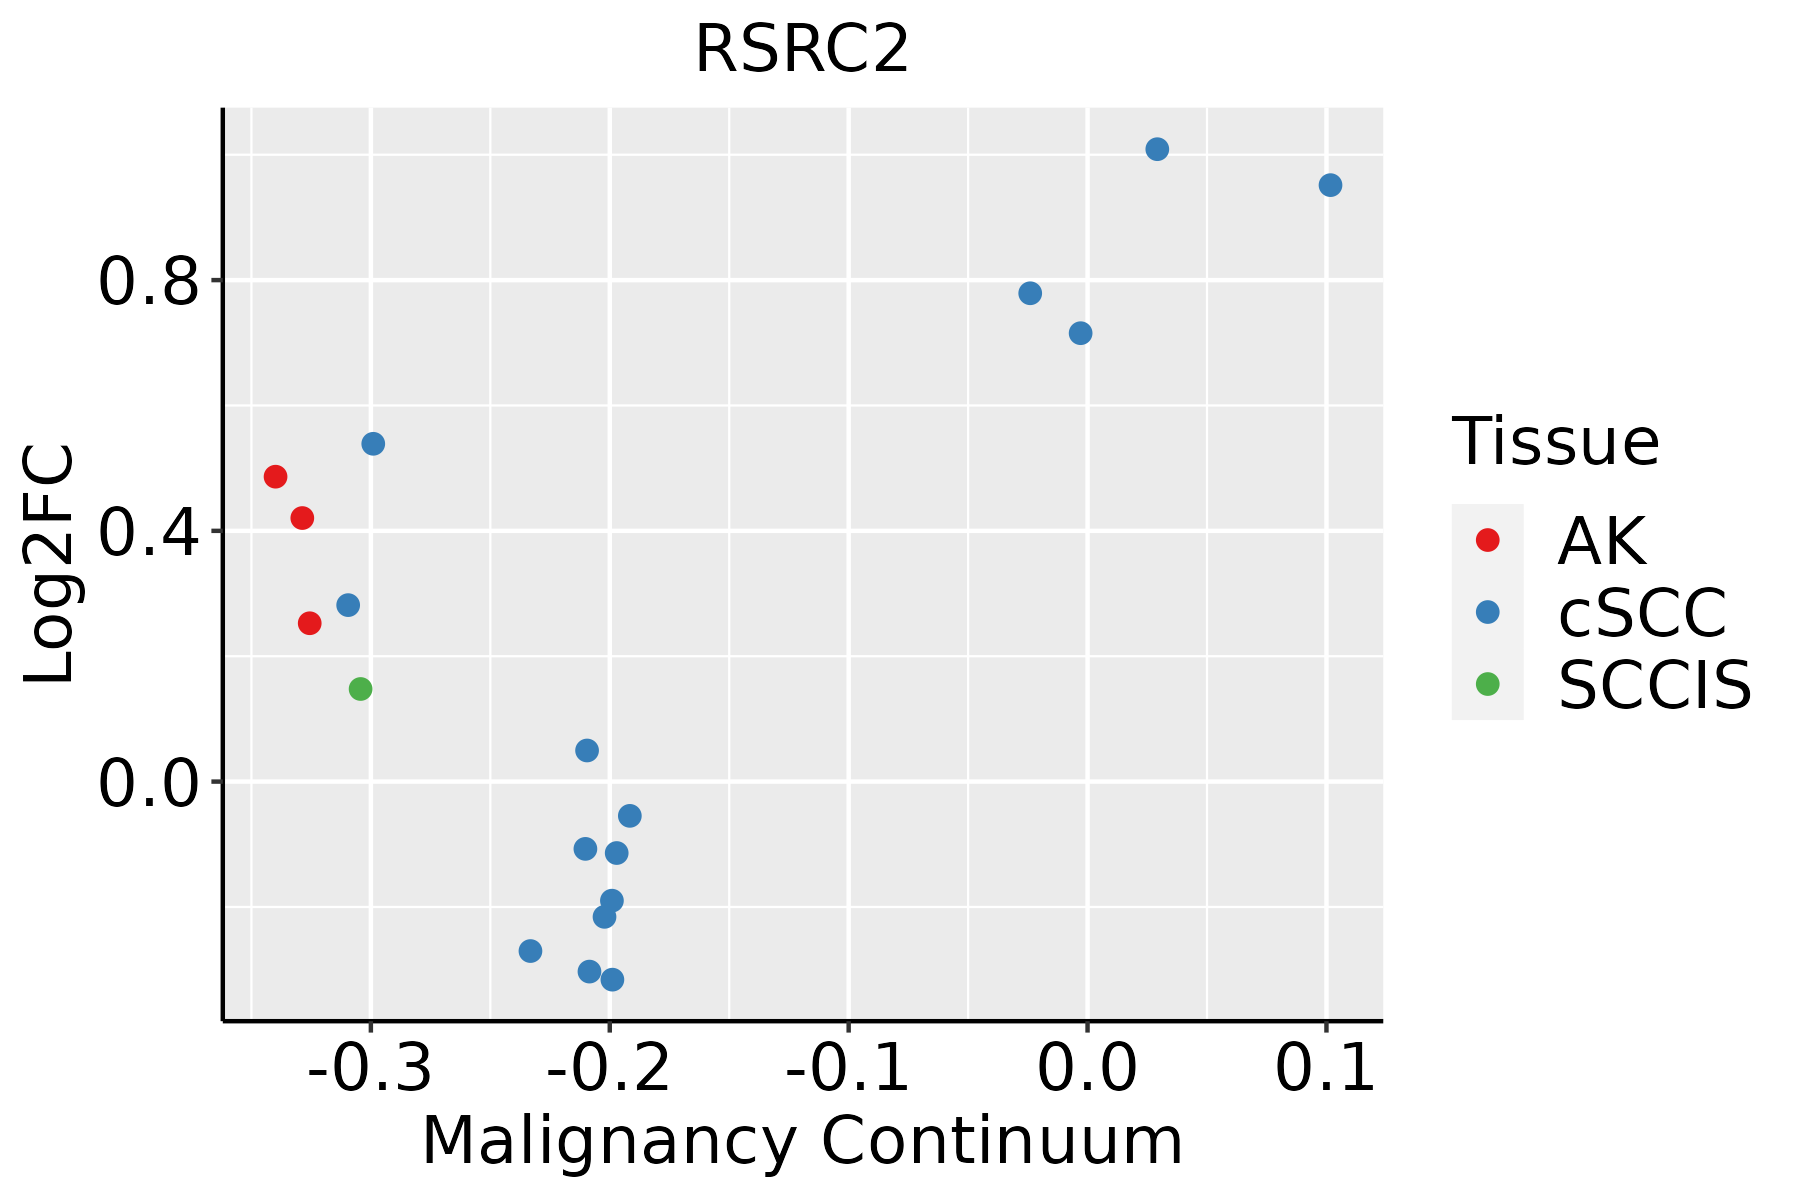 | AK: Actinic keratosis |
| cSCC: Cutaneous squamous cell carcinoma | ||
| SCCIS:squamous cell carcinoma in situ | ||
| Thyroid |  | ATC: Anaplastic thyroid cancer |
| HT: Hashimoto's thyroiditis | ||
| PTC: Papillary thyroid cancer |
| ∗log2FC in expression of this searched gene in stem-like cells from each diseased tissue sample relative to stem-like cells in normal samples in each tissue plotted against the malignancy continuum. Samples are colored based on if they are from different disease stage. |
Top |
Malignant transformation related pathway analysis |
| Find out the enriched GO biological processes and KEGG pathways involved in transition from healthy to precancer to cancer |
| Tissue | Disease Stage | Enriched GO biological Processes |
| Colorectum | AD |  |
| Colorectum | SER |  |
| Colorectum | MSS |  |
| Colorectum | MSI-H |  |
| Colorectum | FAP |  |
| ∗Top 15 enriched GO BP terms are showed in the bar plot of each disease state in each tissue. Each row represents a significant GO biological process which is colored according to the -log10(p.adjust). |
| Page: 1 2 3 4 5 6 7 8 9 |
| GO ID | Tissue | Disease Stage | Description | Gene Ratio | Bg Ratio | pvalue | p.adjust | Count |
| Page: 1 |
| Pathway ID | Tissue | Disease Stage | Description | Gene Ratio | Bg Ratio | pvalue | p.adjust | qvalue | Count |
| Page: 1 |
Top |
Cell-cell communication analysis |
| Identification of potential cell-cell interactions between two cell types and their ligand-receptor pairs for different disease states |
| Ligand | Receptor | LRpair | Pathway | Tissue | Disease Stage |
| Page: 1 |
Top |
Single-cell gene regulatory network inference analysis |
| Find out the significant the regulons (TFs) and the target genes of each regulon across cell types for different disease states |
| TF | Cell Type | Tissue | Disease Stage | Target Gene | RSS | Regulon Activity |
| ∗The dot plots of a searched regulon are shown for all cell subpopulations in each disease state of each tissue based on the regulon specific score inferred using pySCENIC and by calculating the average expression. |
| Page: 1 |
Top |
Somatic mutation of malignant transformation related genes |
| Annotation of somatic variants for genes involved in malignant transformation |
| Hugo Symbol | Variant Class | Variant Classification | dbSNP RS | HGVSc | HGVSp | HGVSp Short | SWISSPROT | BIOTYPE | SIFT | PolyPhen | Tumor Sample Barcode | Tissue | Histology | Sex | Age | Stage | Therapy Types | Drugs | Outcome |
| RSRC2 | SNV | Missense_Mutation | c.479N>C | p.Arg160Thr | p.R160T | Q7L4I2 | protein_coding | deleterious_low_confidence(0.04) | benign(0.173) | TCGA-AC-A23H-01 | Breast | breast invasive carcinoma | Female | >=65 | I/II | Unknown | Unknown | PD | |
| RSRC2 | SNV | Missense_Mutation | novel | c.1210N>C | p.Asp404His | p.D404H | Q7L4I2 | protein_coding | deleterious(0.04) | probably_damaging(0.996) | TCGA-AC-A5XS-01 | Breast | breast invasive carcinoma | Female | >=65 | I/II | Hormone Therapy | femara | SD |
| RSRC2 | SNV | Missense_Mutation | rs373991613 | c.542G>A | p.Arg181His | p.R181H | Q7L4I2 | protein_coding | tolerated_low_confidence(0.06) | possibly_damaging(0.519) | TCGA-OL-A66J-01 | Breast | breast invasive carcinoma | Female | >=65 | I/II | Unknown | Unknown | SD |
| RSRC2 | insertion | Frame_Shift_Ins | novel | c.886_887insTT | p.Ala296ValfsTer18 | p.A296Vfs*18 | Q7L4I2 | protein_coding | TCGA-AR-A0TY-01 | Breast | breast invasive carcinoma | Female | <65 | I/II | Unspecific | Paclitaxel | PD | ||
| RSRC2 | insertion | Frame_Shift_Ins | novel | c.885_886insAAACAGGAGAATCACTTGATCCTGGGAGGCGGAG | p.Ala296LysfsTer21 | p.A296Kfs*21 | Q7L4I2 | protein_coding | TCGA-AR-A0TY-01 | Breast | breast invasive carcinoma | Female | <65 | I/II | Unspecific | Paclitaxel | PD | ||
| RSRC2 | deletion | Frame_Shift_Del | novel | c.121delN | p.Ser41GlnfsTer62 | p.S41Qfs*62 | Q7L4I2 | protein_coding | TCGA-D8-A27V-01 | Breast | breast invasive carcinoma | Female | <65 | I/II | Hormone Therapy | tamoxiphen | SD | ||
| RSRC2 | deletion | Frame_Shift_Del | novel | c.553delN | p.Arg185AspfsTer33 | p.R185Dfs*33 | Q7L4I2 | protein_coding | TCGA-EW-A2FV-01 | Breast | breast invasive carcinoma | Female | <65 | III/IV | Chemotherapy | docetaxel | SD | ||
| RSRC2 | SNV | Missense_Mutation | c.964N>A | p.Ala322Thr | p.A322T | Q7L4I2 | protein_coding | deleterious(0.04) | possibly_damaging(0.502) | TCGA-2W-A8YY-01 | Cervix | cervical & endocervical cancer | Female | <65 | I/II | Chemotherapy | cisplatin | CR | |
| RSRC2 | SNV | Missense_Mutation | novel | c.1151N>T | p.Ser384Leu | p.S384L | Q7L4I2 | protein_coding | tolerated(0.16) | benign(0.133) | TCGA-ZJ-AAXU-01 | Cervix | cervical & endocervical cancer | Female | <65 | I/II | Unknown | Unknown | SD |
| RSRC2 | SNV | Missense_Mutation | c.575N>A | p.Ser192Asn | p.S192N | Q7L4I2 | protein_coding | tolerated_low_confidence(0.34) | probably_damaging(0.916) | TCGA-AA-3966-01 | Colorectum | colon adenocarcinoma | Female | >=65 | I/II | Unknown | Unknown | SD |
| Page: 1 2 3 4 5 |
Top |
Related drugs of malignant transformation related genes |
| Identification of chemicals and drugs interact with genes involved in malignant transfromation |
| (DGIdb 4.0) |
| Entrez ID | Symbol | Category | Interaction Types | Drug Claim Name | Drug Name | PMIDs |
| Page: 1 |

Copyright 2023-Present -The University of Texas Health Science Center at Houston |