
|
|||||
|
 | |
| |
| |
| |
| |
| |
|
Gene: RSL1D1 |
Gene summary for RSL1D1 |
| Gene information | Species | Human | Gene symbol | RSL1D1 | Gene ID | 26156 |
| Gene name | ribosomal L1 domain containing 1 | |
| Gene Alias | CSIG | |
| Cytomap | 16p13.13 | |
| Gene Type | protein-coding | GO ID | GO:0000470 | UniProtAcc | O76021 |
Top |
Malignant transformation analysis |
| Identification of the aberrant gene expression in precancerous and cancerous lesions by comparing the gene expression of stem-like cells in diseased tissues with normal stem cells |
| Entrez ID | Symbol | Replicates | Species | Organ | Tissue | Adj P-value | Log2FC | Malignancy |
| 26156 | RSL1D1 | GSM4909285 | Human | Breast | IDC | 3.11e-06 | -2.03e-01 | 0.21 |
| 26156 | RSL1D1 | GSM4909286 | Human | Breast | IDC | 1.28e-11 | -2.65e-01 | 0.1081 |
| 26156 | RSL1D1 | GSM4909293 | Human | Breast | IDC | 9.07e-09 | -2.78e-01 | 0.1581 |
| 26156 | RSL1D1 | GSM4909294 | Human | Breast | IDC | 1.56e-20 | -4.93e-01 | 0.2022 |
| 26156 | RSL1D1 | GSM4909296 | Human | Breast | IDC | 1.92e-25 | -5.06e-01 | 0.1524 |
| 26156 | RSL1D1 | GSM4909297 | Human | Breast | IDC | 1.33e-32 | -5.13e-01 | 0.1517 |
| 26156 | RSL1D1 | GSM4909299 | Human | Breast | IDC | 7.67e-05 | -2.55e-01 | 0.035 |
| 26156 | RSL1D1 | GSM4909301 | Human | Breast | IDC | 3.71e-24 | -5.72e-01 | 0.1577 |
| 26156 | RSL1D1 | GSM4909302 | Human | Breast | IDC | 9.22e-05 | -3.79e-01 | 0.1545 |
| 26156 | RSL1D1 | GSM4909304 | Human | Breast | IDC | 6.06e-07 | -2.59e-01 | 0.1636 |
| 26156 | RSL1D1 | GSM4909307 | Human | Breast | IDC | 2.69e-02 | -2.17e-01 | 0.1569 |
| 26156 | RSL1D1 | GSM4909309 | Human | Breast | IDC | 1.68e-05 | -4.04e-01 | 0.0483 |
| 26156 | RSL1D1 | GSM4909311 | Human | Breast | IDC | 1.32e-52 | -5.57e-01 | 0.1534 |
| 26156 | RSL1D1 | GSM4909312 | Human | Breast | IDC | 5.62e-16 | -2.66e-01 | 0.1552 |
| 26156 | RSL1D1 | GSM4909313 | Human | Breast | IDC | 3.85e-04 | -1.62e-01 | 0.0391 |
| 26156 | RSL1D1 | GSM4909315 | Human | Breast | IDC | 3.65e-13 | -3.92e-01 | 0.21 |
| 26156 | RSL1D1 | GSM4909316 | Human | Breast | IDC | 1.46e-05 | -5.10e-01 | 0.21 |
| 26156 | RSL1D1 | GSM4909319 | Human | Breast | IDC | 2.39e-69 | -5.95e-01 | 0.1563 |
| 26156 | RSL1D1 | GSM4909320 | Human | Breast | IDC | 8.34e-08 | -4.73e-01 | 0.1575 |
| 26156 | RSL1D1 | GSM4909321 | Human | Breast | IDC | 1.05e-32 | -5.08e-01 | 0.1559 |
| Page: 1 2 3 4 5 6 7 8 9 10 11 12 |
| Tissue | Expression Dynamics | Abbreviation |
| Breast | 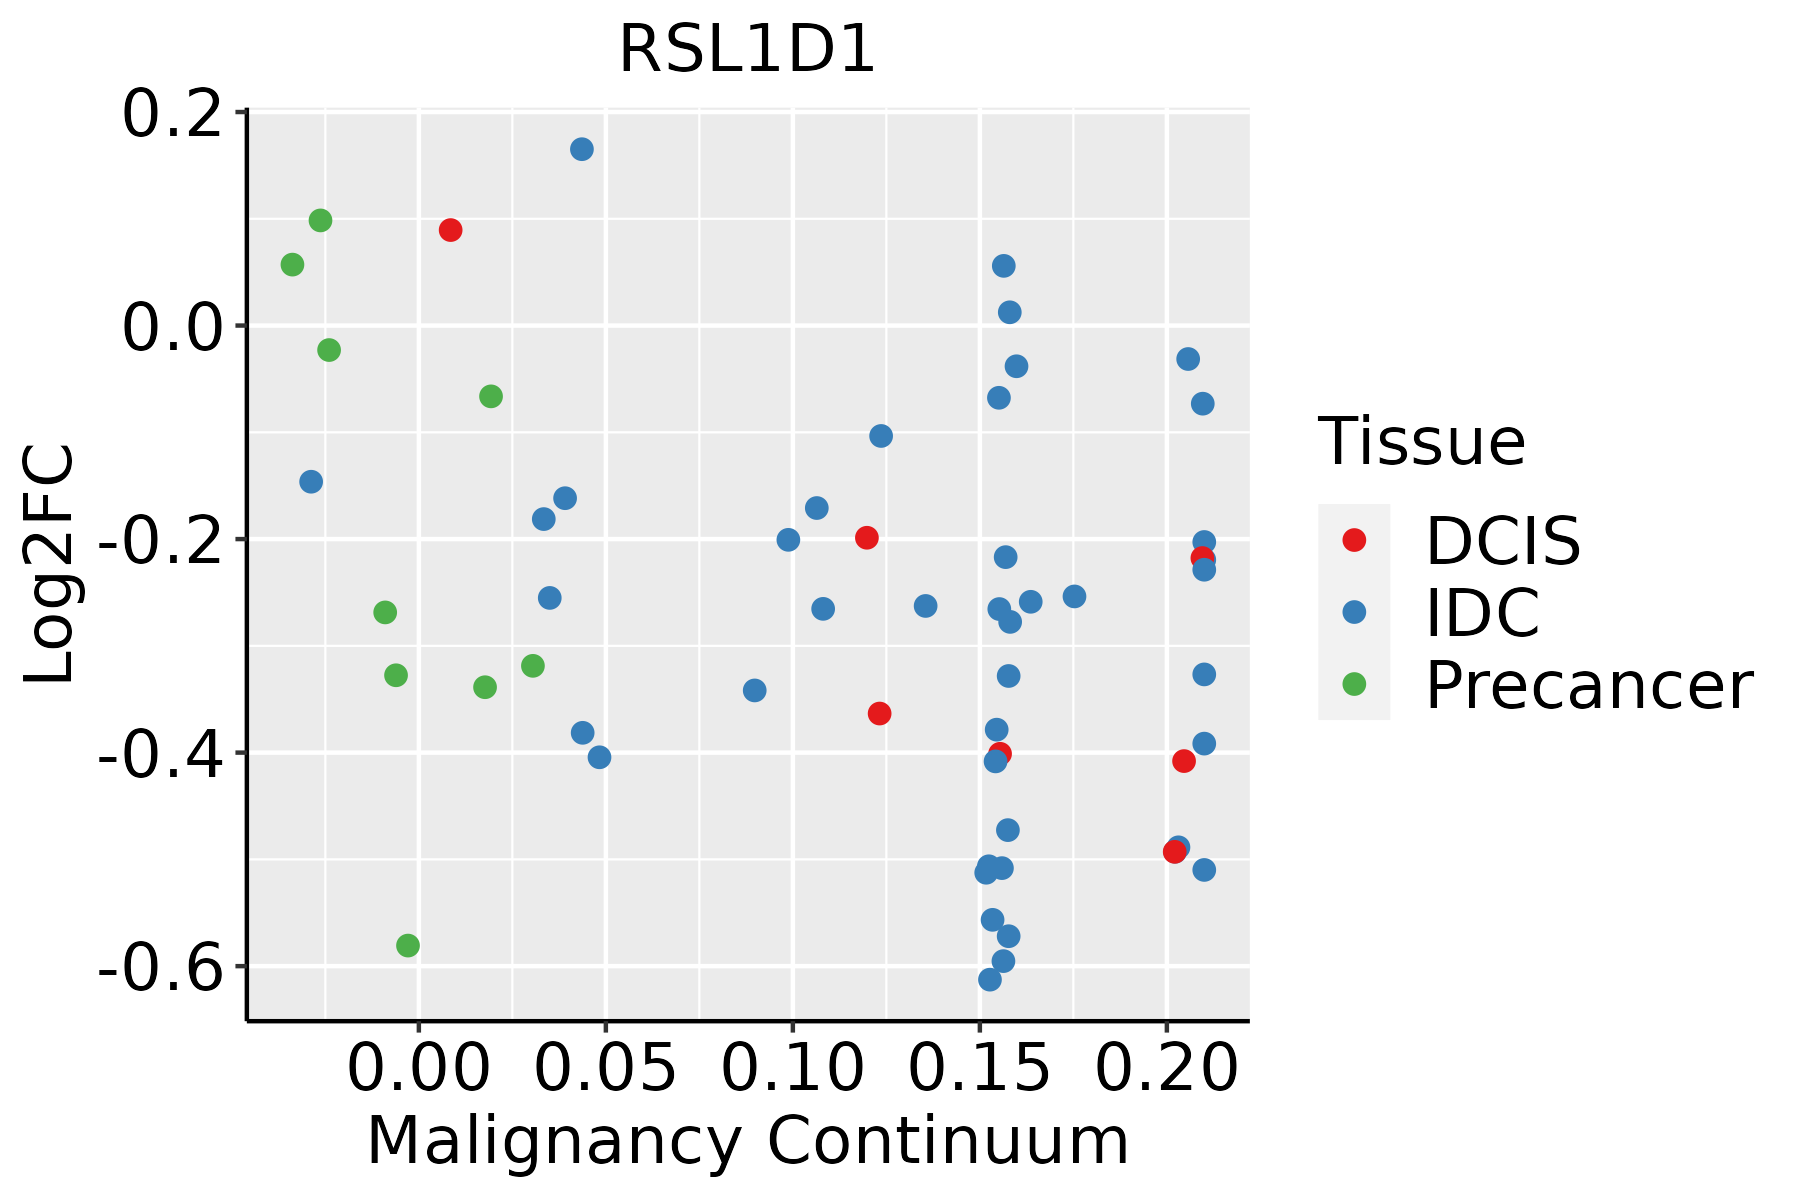 | IDC: Invasive ductal carcinoma |
| DCIS: Ductal carcinoma in situ | ||
| Precancer(BRCA1-mut): Precancerous lesion from BRCA1 mutation carriers | ||
| Colorectum (GSE201348) |  | FAP: Familial adenomatous polyposis |
| CRC: Colorectal cancer | ||
| Colorectum (HTA11) |  | AD: Adenomas |
| SER: Sessile serrated lesions | ||
| MSI-H: Microsatellite-high colorectal cancer | ||
| MSS: Microsatellite stable colorectal cancer | ||
| Endometrium | 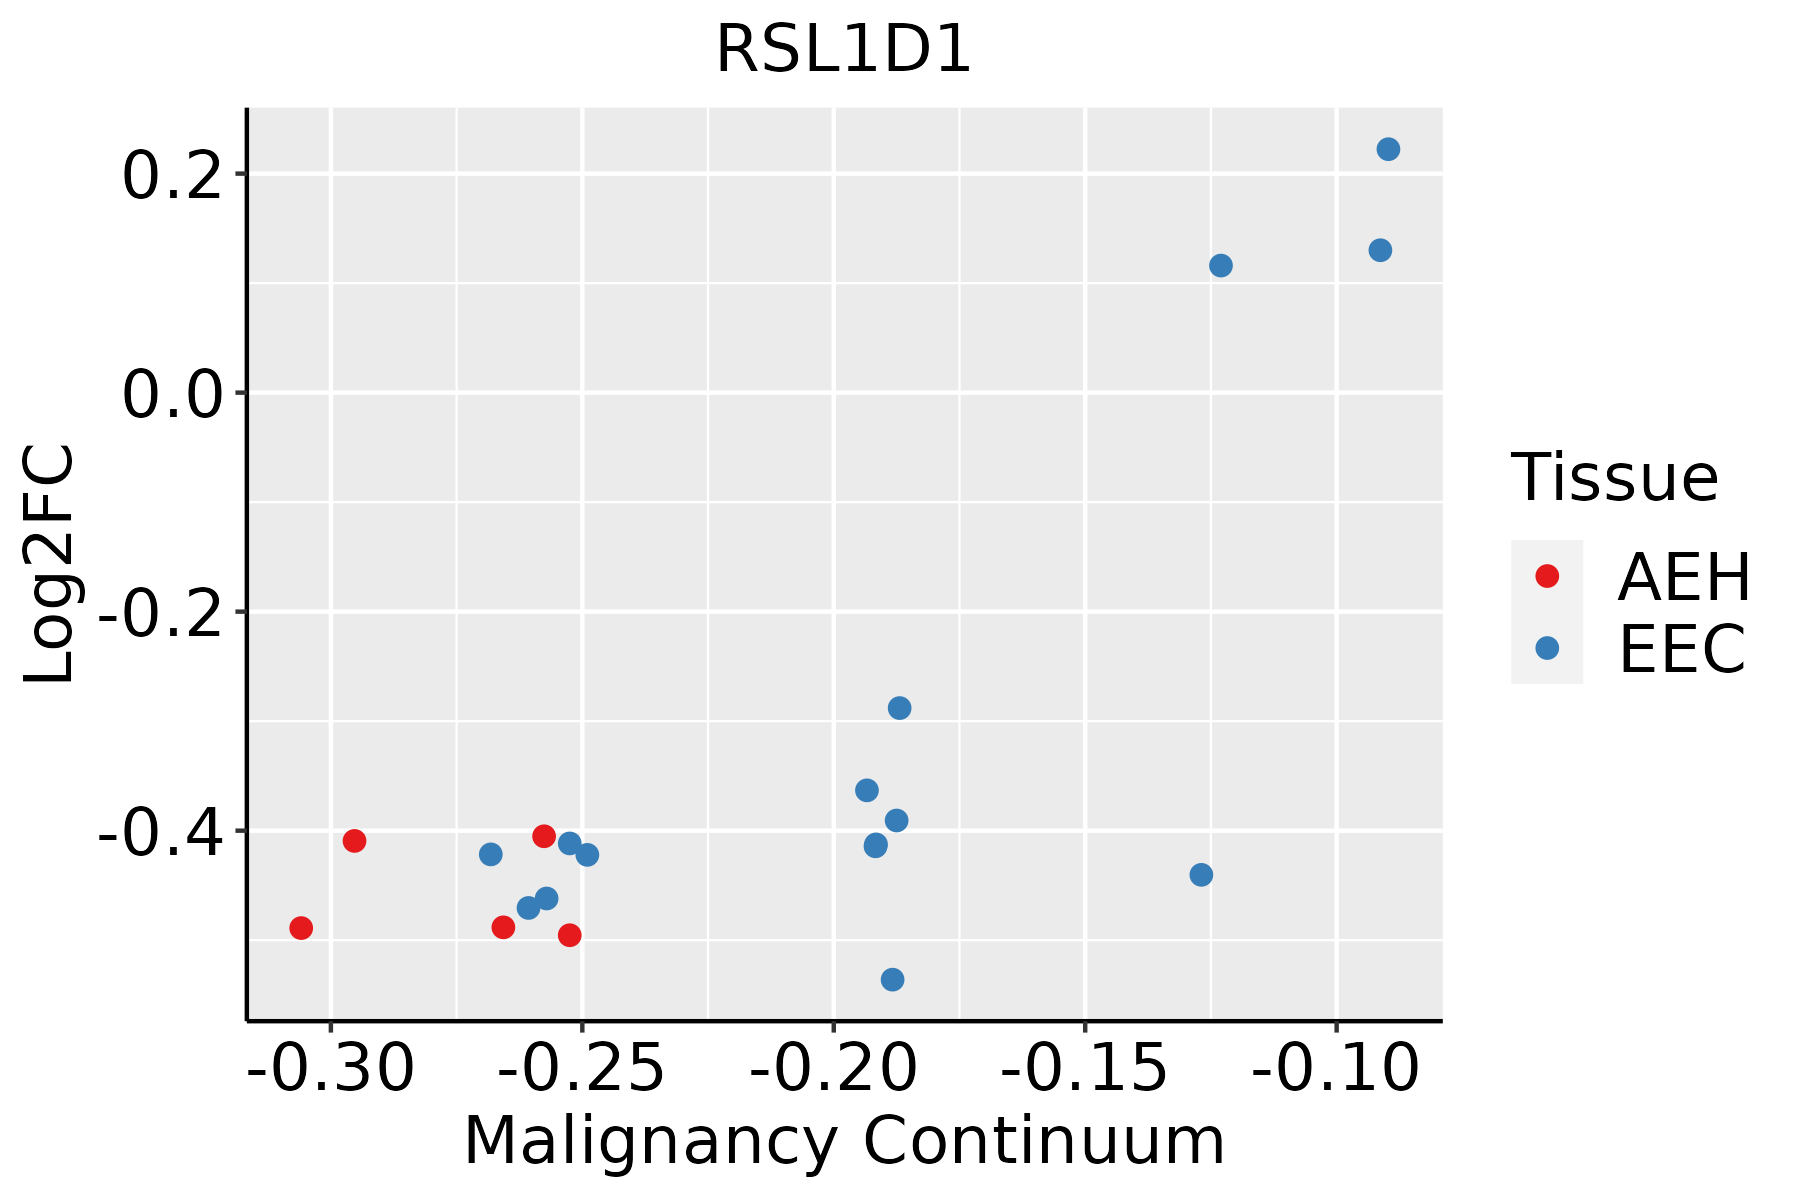 | AEH: Atypical endometrial hyperplasia |
| EEC: Endometrioid Cancer | ||
| Esophagus | 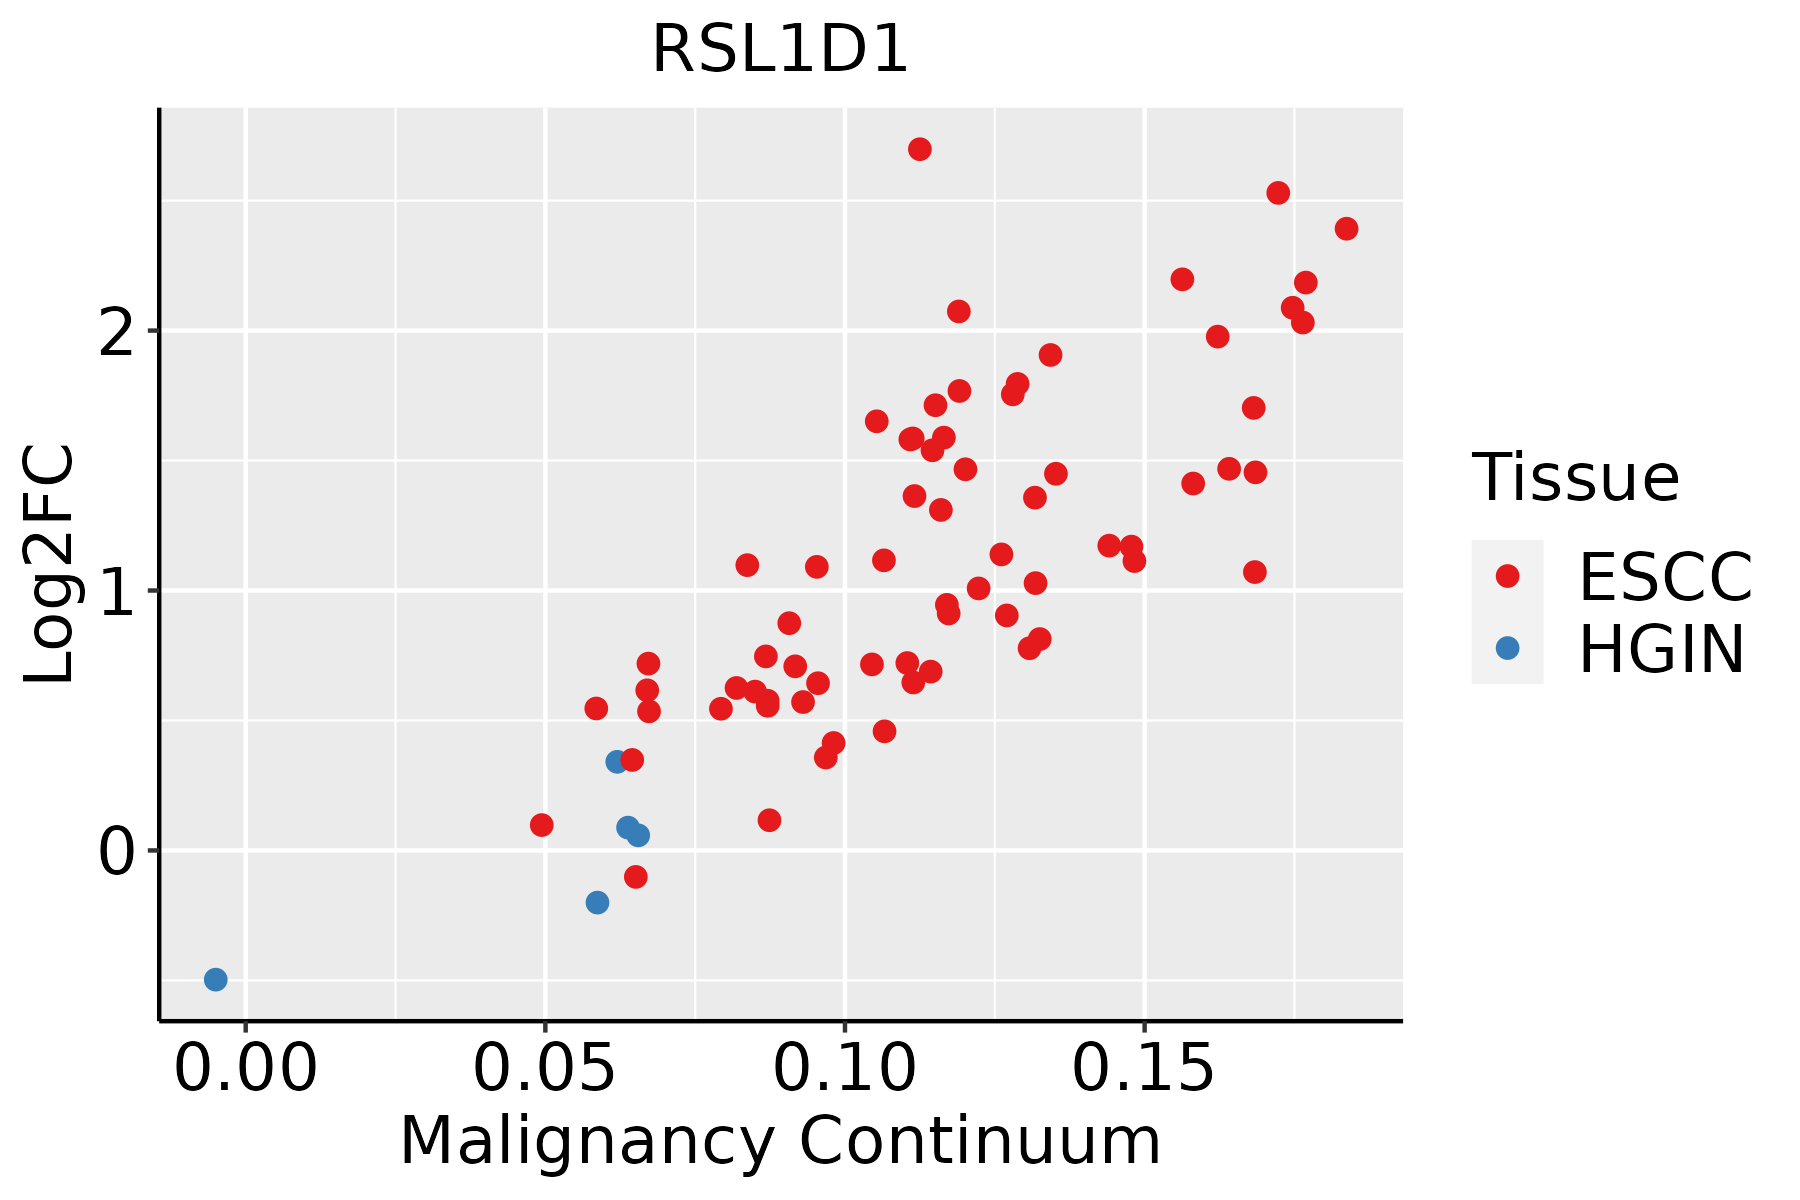 | ESCC: Esophageal squamous cell carcinoma |
| HGIN: High-grade intraepithelial neoplasias | ||
| LGIN: Low-grade intraepithelial neoplasias | ||
| Liver | 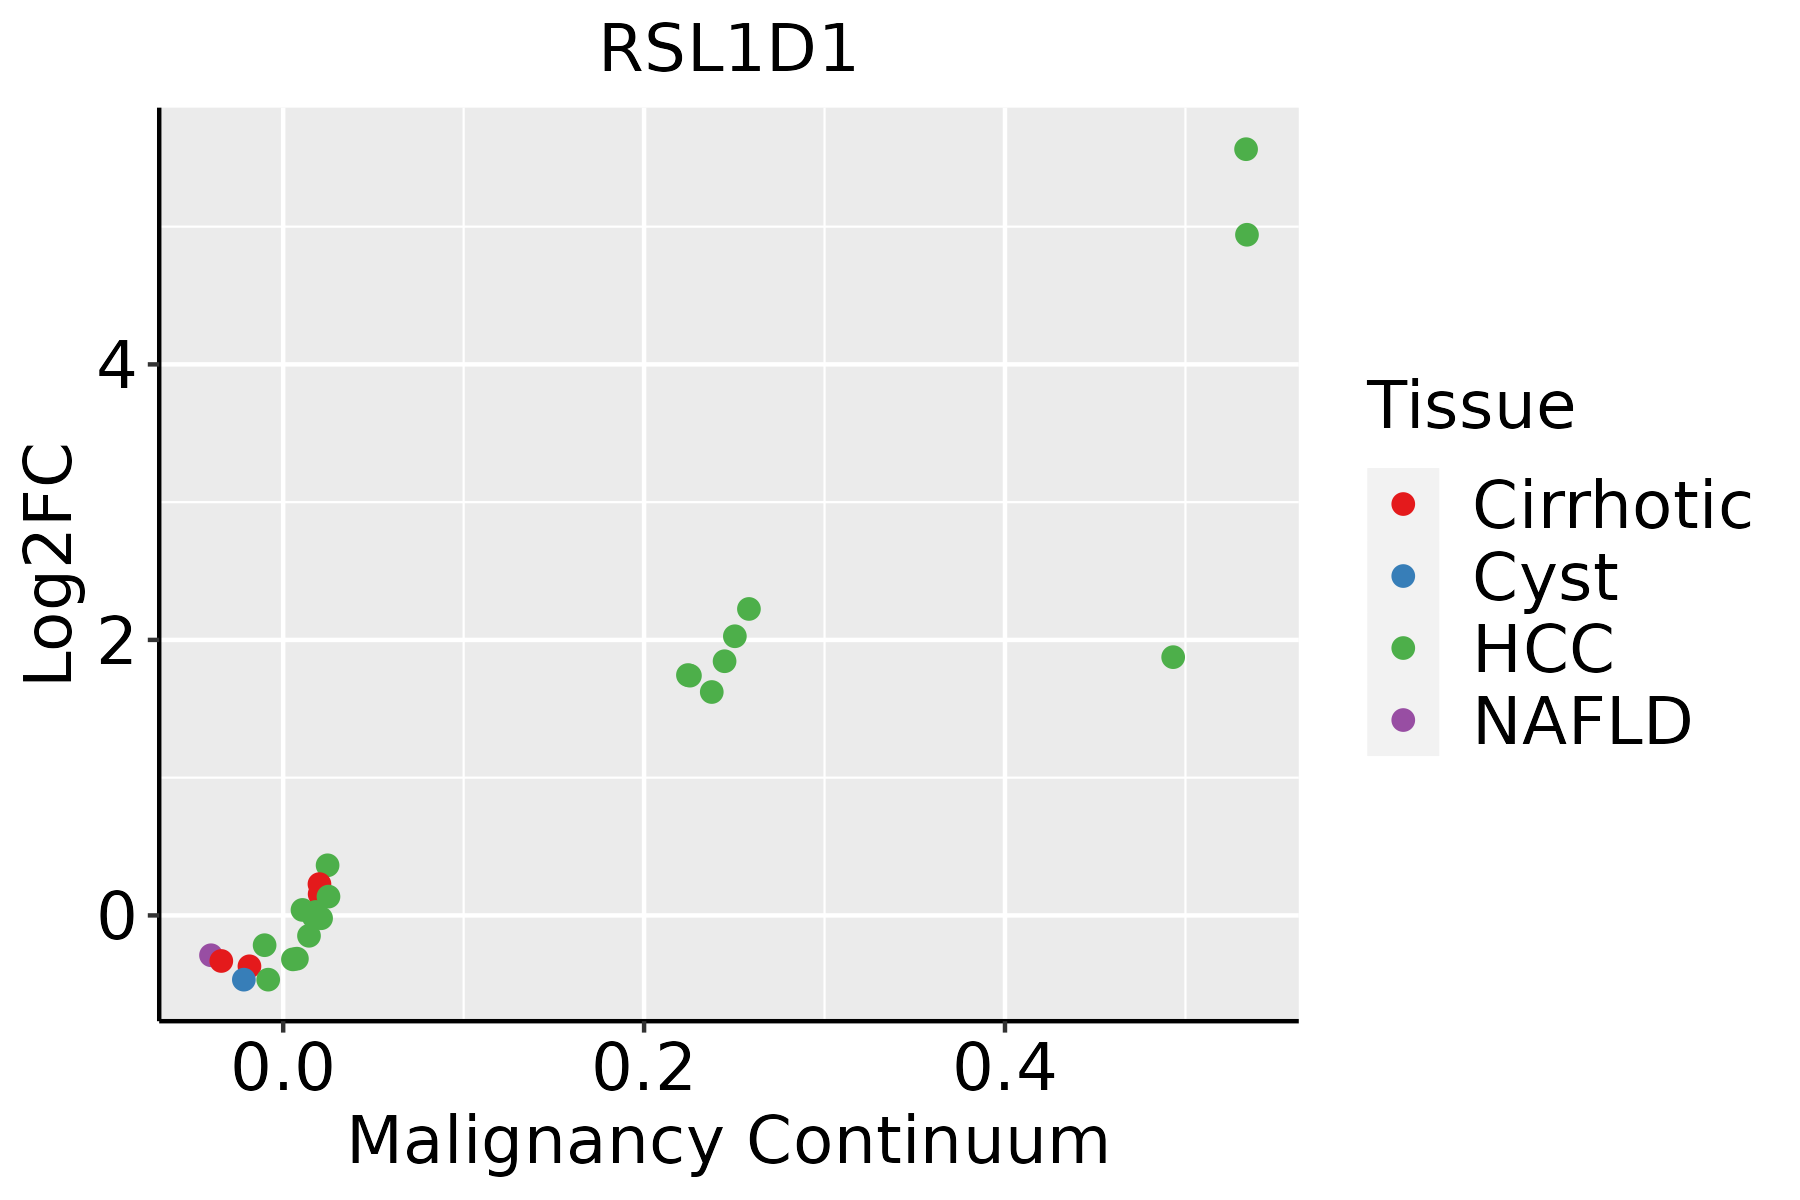 | HCC: Hepatocellular carcinoma |
| NAFLD: Non-alcoholic fatty liver disease | ||
| Oral Cavity | 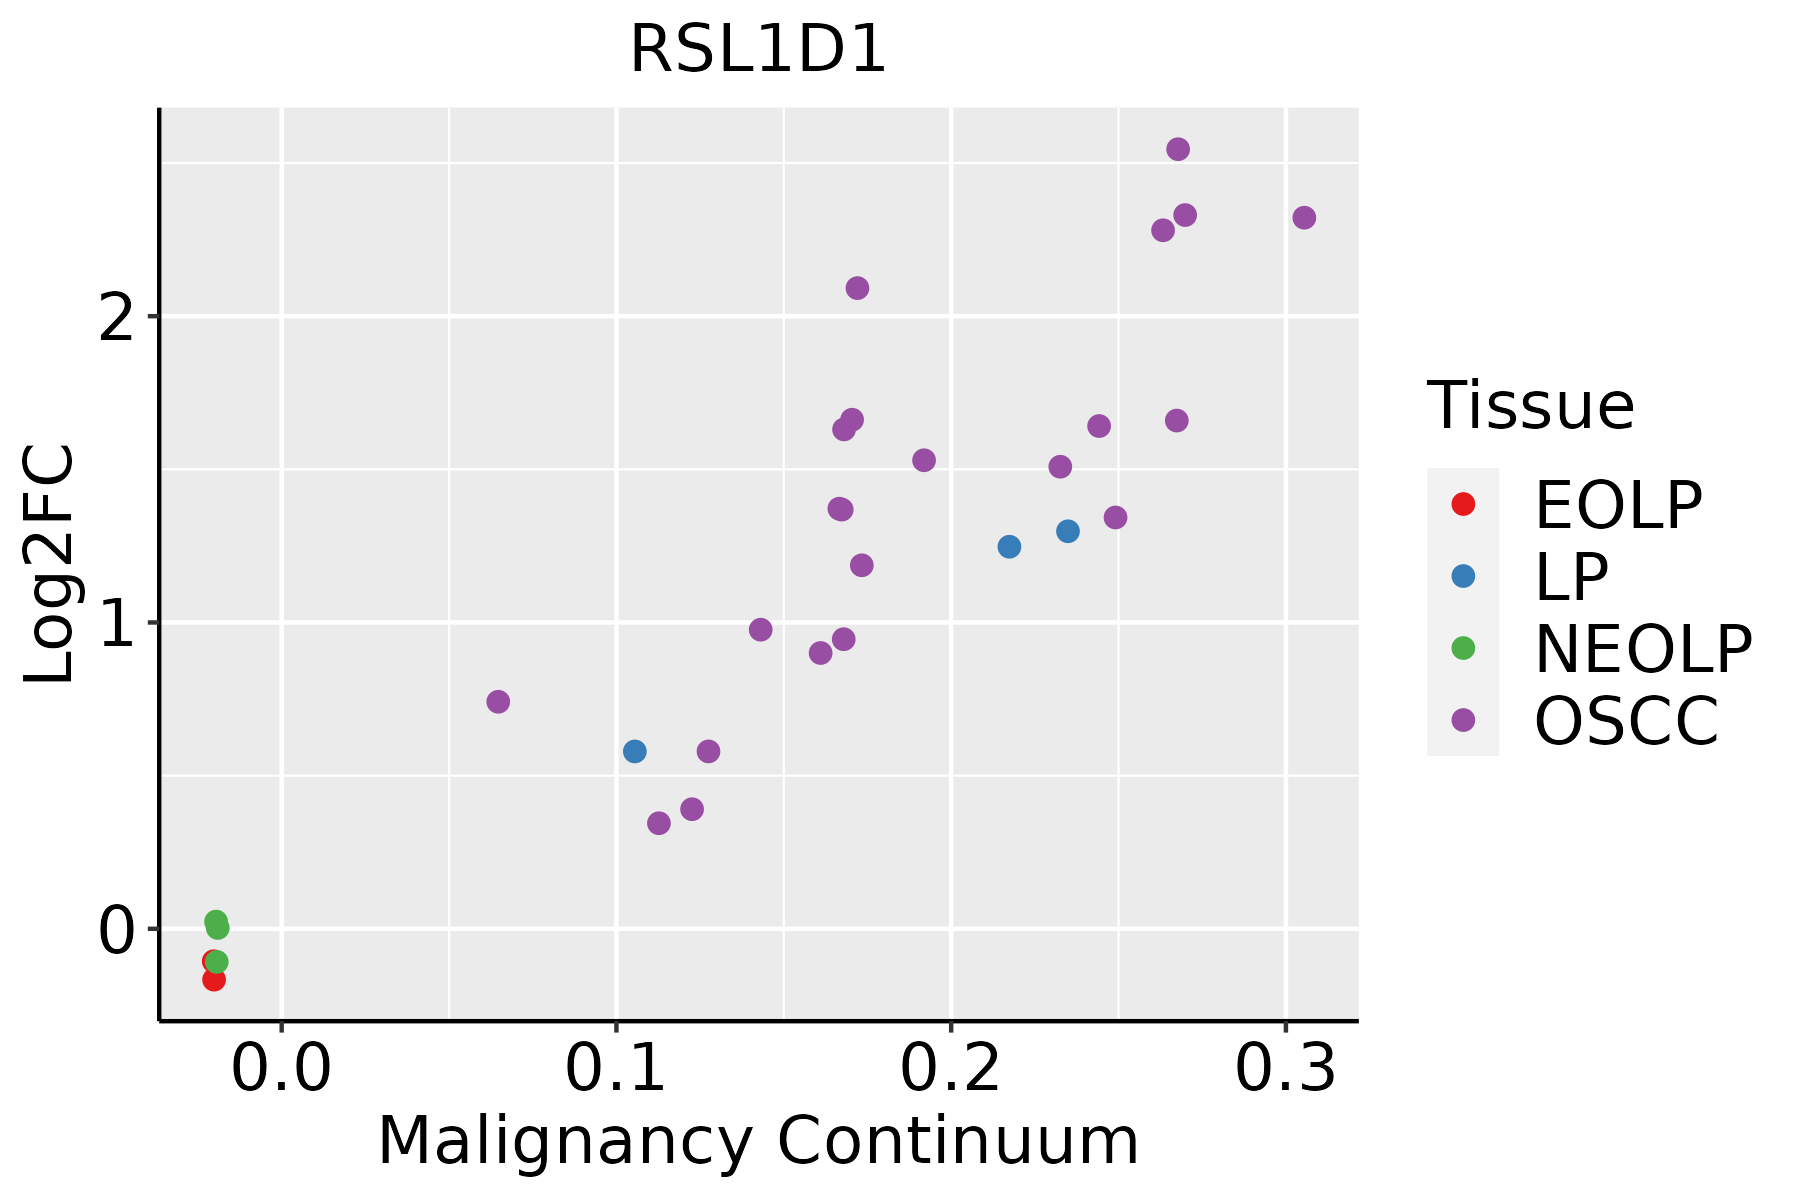 | EOLP: Erosive Oral lichen planus |
| LP: leukoplakia | ||
| NEOLP: Non-erosive oral lichen planus | ||
| OSCC: Oral squamous cell carcinoma | ||
| Prostate | 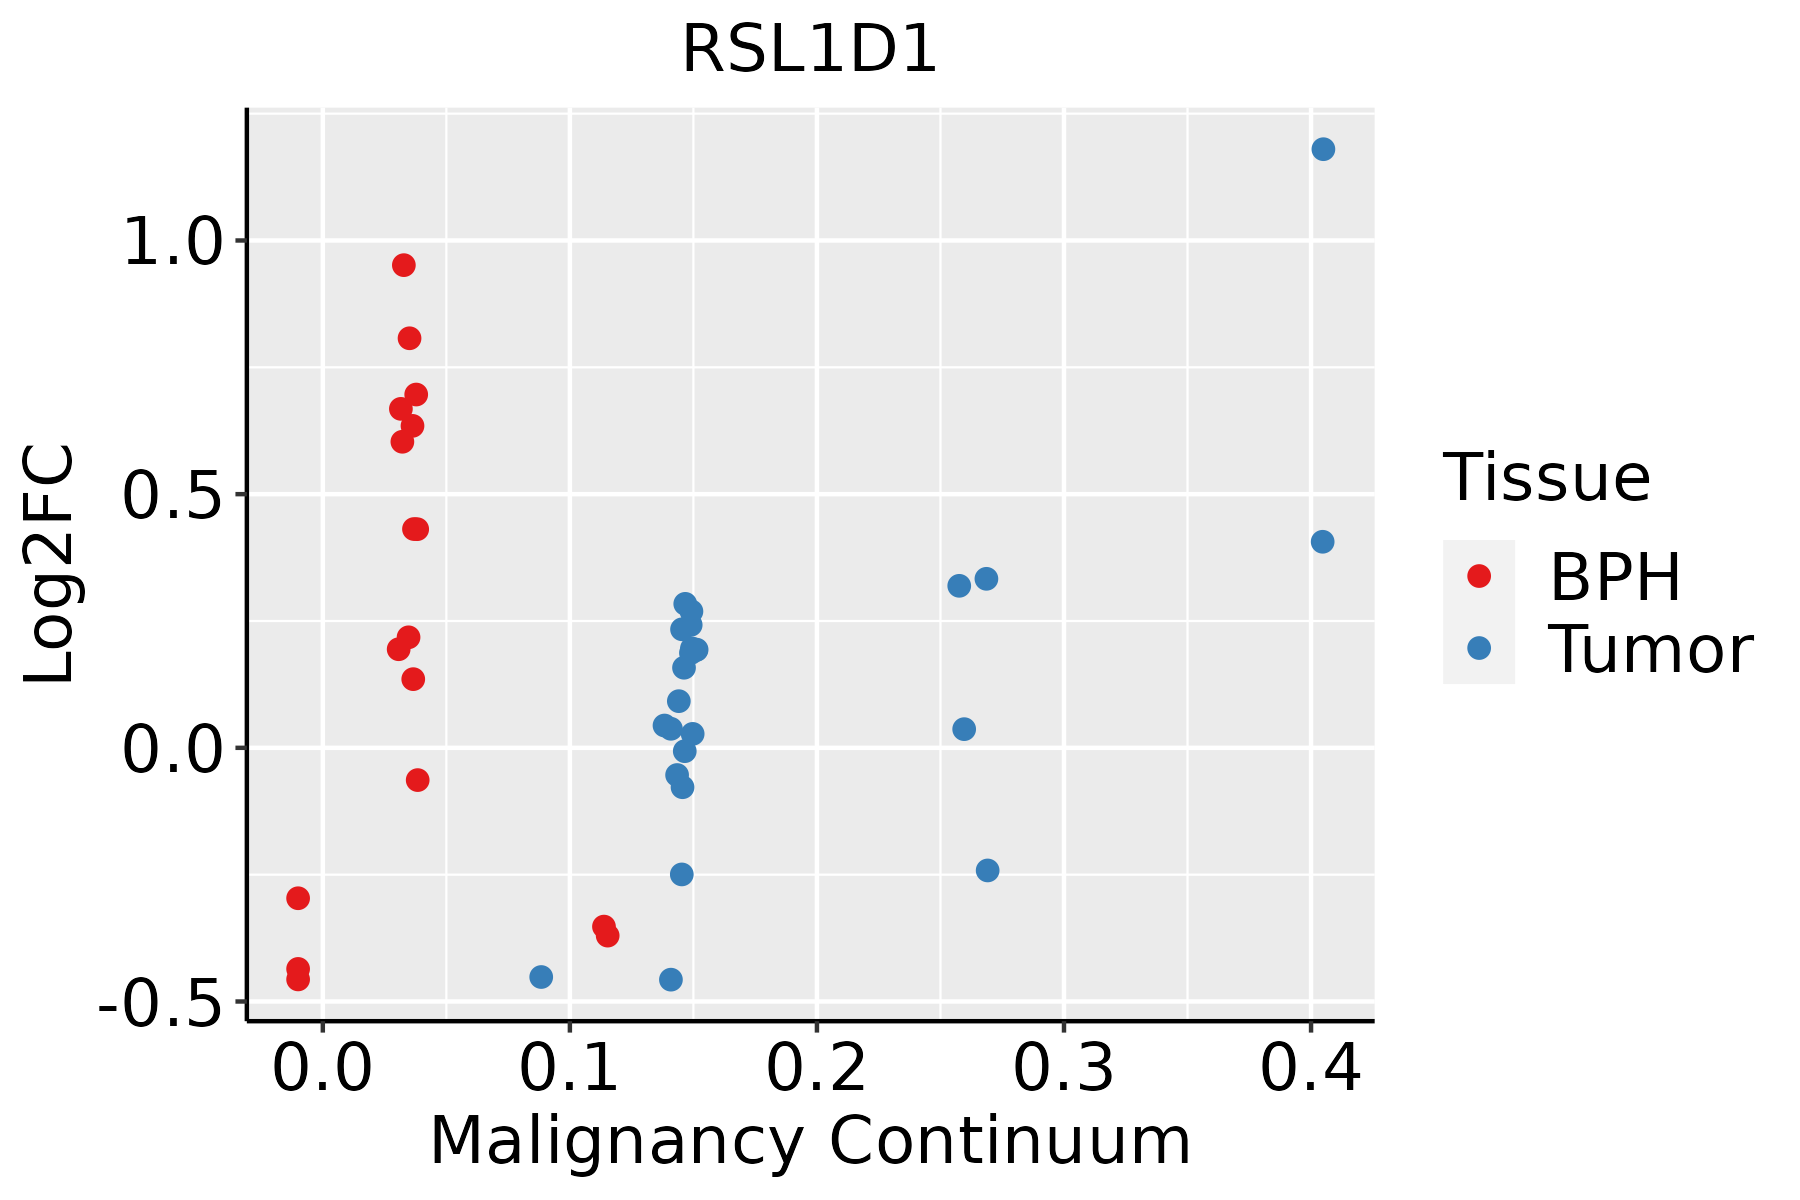 | BPH: Benign Prostatic Hyperplasia |
| Skin |  | AK: Actinic keratosis |
| cSCC: Cutaneous squamous cell carcinoma | ||
| SCCIS:squamous cell carcinoma in situ | ||
| Thyroid | 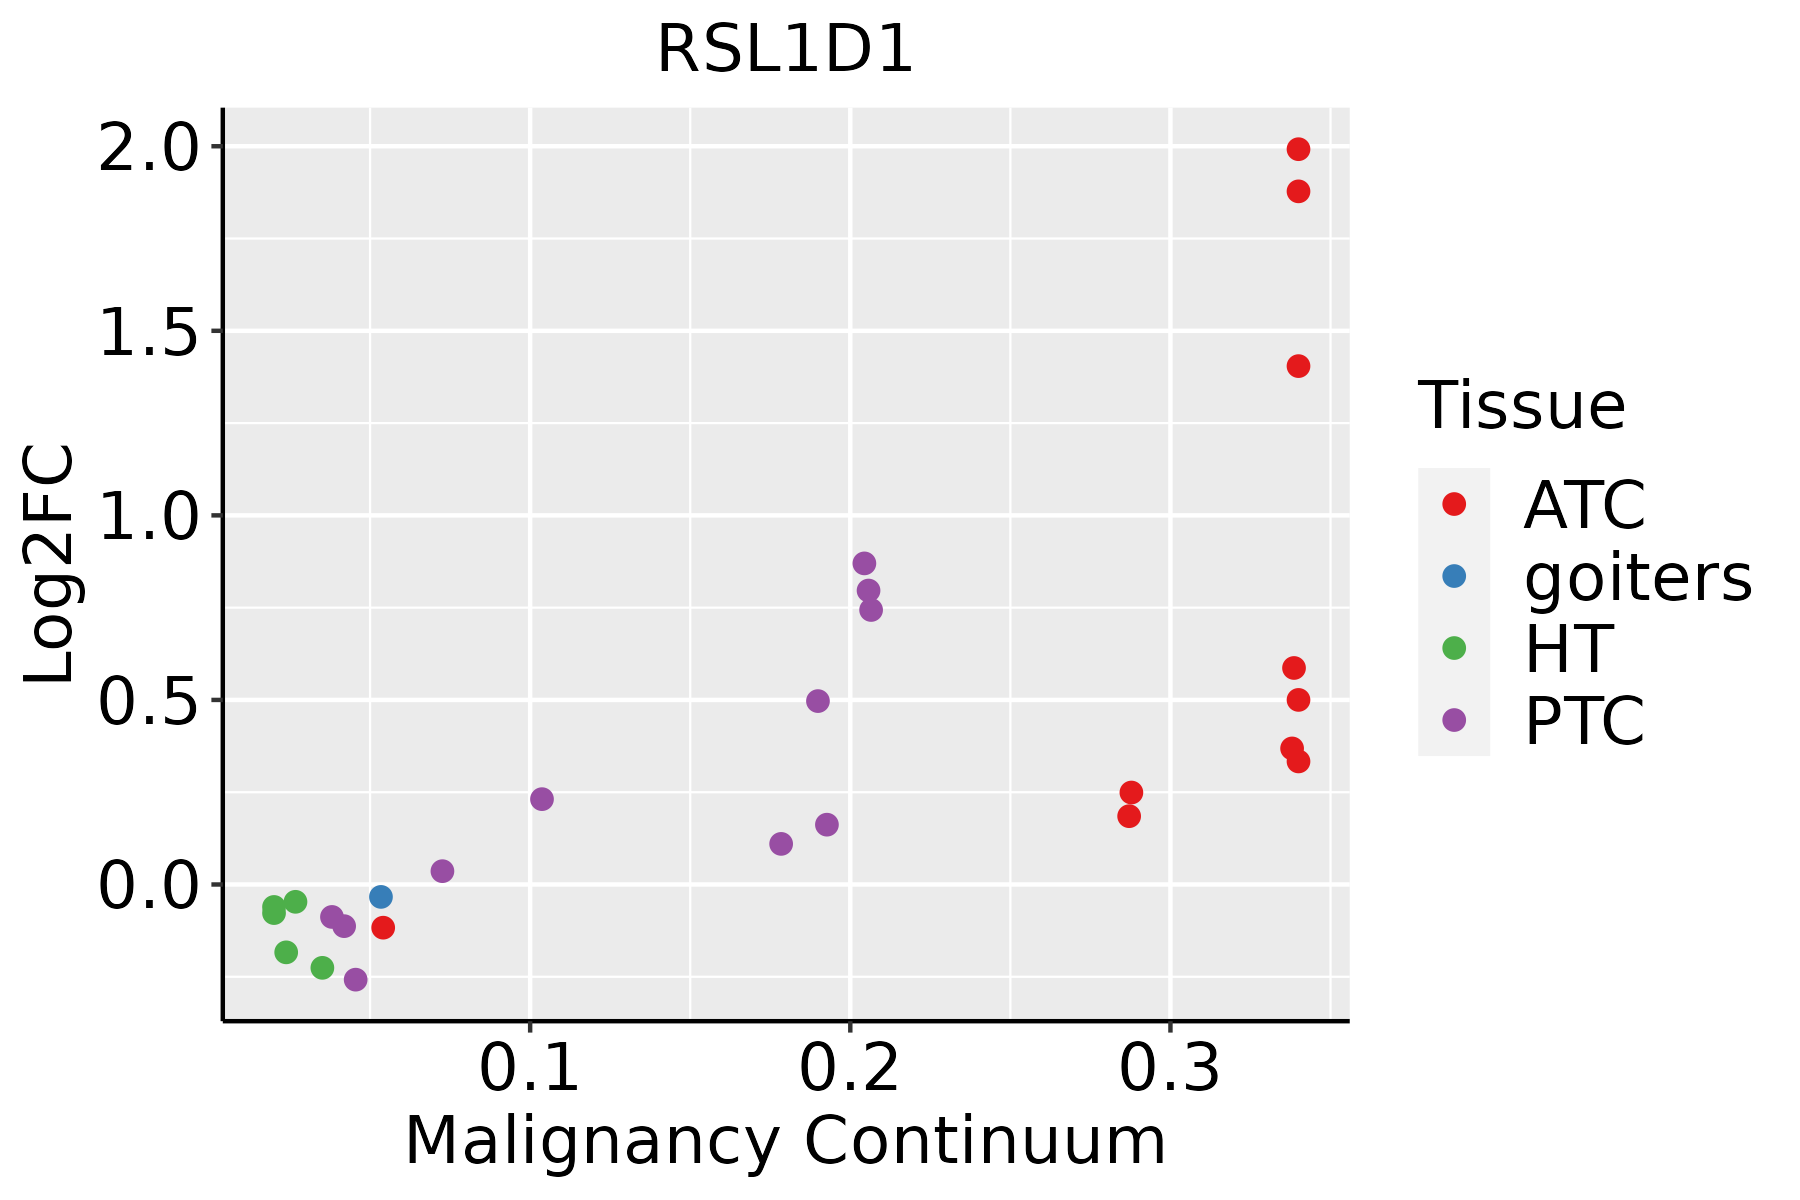 | ATC: Anaplastic thyroid cancer |
| HT: Hashimoto's thyroiditis | ||
| PTC: Papillary thyroid cancer |
| ∗log2FC in expression of this searched gene in stem-like cells from each diseased tissue sample relative to stem-like cells in normal samples in each tissue plotted against the malignancy continuum. Samples are colored based on if they are from different disease stage. |
Top |
Malignant transformation related pathway analysis |
| Find out the enriched GO biological processes and KEGG pathways involved in transition from healthy to precancer to cancer |
| Tissue | Disease Stage | Enriched GO biological Processes |
| Colorectum | AD |  |
| Colorectum | SER |  |
| Colorectum | MSS |  |
| Colorectum | MSI-H |  |
| Colorectum | FAP |  |
| ∗Top 15 enriched GO BP terms are showed in the bar plot of each disease state in each tissue. Each row represents a significant GO biological process which is colored according to the -log10(p.adjust). |
| Page: 1 2 3 4 5 6 7 8 9 |
| GO ID | Tissue | Disease Stage | Description | Gene Ratio | Bg Ratio | pvalue | p.adjust | Count |
| GO:00226139 | Breast | Precancer | ribonucleoprotein complex biogenesis | 79/1080 | 463/18723 | 2.11e-18 | 1.03e-15 | 79 |
| GO:00422549 | Breast | Precancer | ribosome biogenesis | 52/1080 | 299/18723 | 7.35e-13 | 1.51e-10 | 52 |
| GO:00422739 | Breast | Precancer | ribosomal large subunit biogenesis | 22/1080 | 72/18723 | 5.03e-11 | 5.61e-09 | 22 |
| GO:00063646 | Breast | Precancer | rRNA processing | 35/1080 | 225/18723 | 7.90e-08 | 4.60e-06 | 35 |
| GO:00160726 | Breast | Precancer | rRNA metabolic process | 36/1080 | 236/18723 | 8.59e-08 | 4.84e-06 | 36 |
| GO:00075688 | Breast | Precancer | aging | 41/1080 | 339/18723 | 5.95e-06 | 1.71e-04 | 41 |
| GO:00344705 | Breast | Precancer | ncRNA processing | 42/1080 | 395/18723 | 9.91e-05 | 1.83e-03 | 42 |
| GO:00016496 | Breast | Precancer | osteoblast differentiation | 27/1080 | 229/18723 | 3.35e-04 | 4.73e-03 | 27 |
| GO:00004703 | Breast | Precancer | maturation of LSU-rRNA | 7/1080 | 28/18723 | 8.46e-04 | 9.82e-03 | 7 |
| GO:00346604 | Breast | Precancer | ncRNA metabolic process | 45/1080 | 485/18723 | 1.15e-03 | 1.26e-02 | 45 |
| GO:00075694 | Breast | Precancer | cell aging | 17/1080 | 132/18723 | 1.55e-03 | 1.59e-02 | 17 |
| GO:00903423 | Breast | Precancer | regulation of cell aging | 10/1080 | 61/18723 | 2.40e-03 | 2.21e-02 | 10 |
| GO:00015036 | Breast | Precancer | ossification | 36/1080 | 408/18723 | 7.53e-03 | 4.98e-02 | 36 |
| GO:002261314 | Breast | IDC | ribonucleoprotein complex biogenesis | 83/1434 | 463/18723 | 2.01e-13 | 5.20e-11 | 83 |
| GO:004227314 | Breast | IDC | ribosomal large subunit biogenesis | 22/1434 | 72/18723 | 1.04e-08 | 7.67e-07 | 22 |
| GO:004225414 | Breast | IDC | ribosome biogenesis | 52/1434 | 299/18723 | 1.90e-08 | 1.32e-06 | 52 |
| GO:000756813 | Breast | IDC | aging | 52/1434 | 339/18723 | 1.14e-06 | 5.10e-05 | 52 |
| GO:000636414 | Breast | IDC | rRNA processing | 35/1434 | 225/18723 | 4.59e-05 | 1.03e-03 | 35 |
| GO:001607214 | Breast | IDC | rRNA metabolic process | 36/1434 | 236/18723 | 5.48e-05 | 1.17e-03 | 36 |
| GO:000164912 | Breast | IDC | osteoblast differentiation | 35/1434 | 229/18723 | 6.64e-05 | 1.35e-03 | 35 |
| Page: 1 2 3 4 5 6 7 8 9 10 11 12 |
| Pathway ID | Tissue | Disease Stage | Description | Gene Ratio | Bg Ratio | pvalue | p.adjust | qvalue | Count |
| Page: 1 |
Top |
Cell-cell communication analysis |
| Identification of potential cell-cell interactions between two cell types and their ligand-receptor pairs for different disease states |
| Ligand | Receptor | LRpair | Pathway | Tissue | Disease Stage |
| Page: 1 |
Top |
Single-cell gene regulatory network inference analysis |
| Find out the significant the regulons (TFs) and the target genes of each regulon across cell types for different disease states |
| TF | Cell Type | Tissue | Disease Stage | Target Gene | RSS | Regulon Activity |
| ∗The dot plots of a searched regulon are shown for all cell subpopulations in each disease state of each tissue based on the regulon specific score inferred using pySCENIC and by calculating the average expression. |
| Page: 1 |
Top |
Somatic mutation of malignant transformation related genes |
| Annotation of somatic variants for genes involved in malignant transformation |
| Hugo Symbol | Variant Class | Variant Classification | dbSNP RS | HGVSc | HGVSp | HGVSp Short | SWISSPROT | BIOTYPE | SIFT | PolyPhen | Tumor Sample Barcode | Tissue | Histology | Sex | Age | Stage | Therapy Types | Drugs | Outcome |
| RSL1D1 | SNV | Missense_Mutation | novel | c.806N>C | p.Ser269Thr | p.S269T | O76021 | protein_coding | tolerated(0.19) | benign(0.104) | TCGA-AC-A2FM-01 | Breast | breast invasive carcinoma | Female | >=65 | I/II | Unknown | Unknown | PD |
| RSL1D1 | SNV | Missense_Mutation | novel | c.1406C>A | p.Ser469Tyr | p.S469Y | O76021 | protein_coding | deleterious(0) | probably_damaging(0.997) | TCGA-AN-A046-01 | Breast | breast invasive carcinoma | Female | >=65 | I/II | Unknown | Unknown | SD |
| RSL1D1 | SNV | Missense_Mutation | c.670N>A | p.Glu224Lys | p.E224K | O76021 | protein_coding | tolerated(0.11) | benign(0.206) | TCGA-AR-A251-01 | Breast | breast invasive carcinoma | Female | <65 | III/IV | Chemotherapy | doxorubicin | SD | |
| RSL1D1 | SNV | Missense_Mutation | c.617N>T | p.Ser206Phe | p.S206F | O76021 | protein_coding | deleterious(0) | probably_damaging(0.987) | TCGA-B6-A0IB-01 | Breast | breast invasive carcinoma | Female | <65 | III/IV | Unknown | Unknown | PD | |
| RSL1D1 | SNV | Missense_Mutation | rs780843348 | c.427N>A | p.Glu143Lys | p.E143K | O76021 | protein_coding | deleterious(0) | probably_damaging(0.974) | TCGA-D8-A1XL-01 | Breast | breast invasive carcinoma | Female | <65 | I/II | Chemotherapy | doxorubicine+cyclophosphamide+tamoxifen | SD |
| RSL1D1 | insertion | Frame_Shift_Ins | novel | c.1350_1351insCCCAGCACTTTGGAAC | p.Ala451ProfsTer22 | p.A451Pfs*22 | O76021 | protein_coding | TCGA-A2-A0CT-01 | Breast | breast invasive carcinoma | Female | >=65 | I/II | Chemotherapy | cytoxan | SD | ||
| RSL1D1 | insertion | Nonsense_Mutation | novel | c.1307_1308insCCCTTGACCCTGGACATATTCCAAGACTCTTTTACATTATGT | p.Glu436delinsAspProTerProTrpThrTyrSerLysThrLeuLeuHisTyrVal | p.E436delinsDP*PWTYSKTLLHYV | O76021 | protein_coding | TCGA-AO-A03R-01 | Breast | breast invasive carcinoma | Female | <65 | I/II | Chemotherapy | doxorubicin | SD | ||
| RSL1D1 | insertion | Frame_Shift_Ins | novel | c.1187_1188insCAAAACTGAAAAAAAGAGAAAAAAAAAAACATCTAGCTCT | p.Pro397LysfsTer15 | p.P397Kfs*15 | O76021 | protein_coding | TCGA-AR-A0TY-01 | Breast | breast invasive carcinoma | Female | <65 | I/II | Unspecific | Paclitaxel | PD | ||
| RSL1D1 | deletion | Frame_Shift_Del | c.964delG | p.Ala322HisfsTer9 | p.A322Hfs*9 | O76021 | protein_coding | TCGA-D8-A27V-01 | Breast | breast invasive carcinoma | Female | <65 | I/II | Hormone Therapy | tamoxiphen | SD | |||
| RSL1D1 | deletion | Frame_Shift_Del | novel | c.191delT | p.Leu64TyrfsTer3 | p.L64Yfs*3 | O76021 | protein_coding | TCGA-EW-A2FV-01 | Breast | breast invasive carcinoma | Female | <65 | III/IV | Chemotherapy | docetaxel | SD |
| Page: 1 2 3 4 5 6 |
Top |
Related drugs of malignant transformation related genes |
| Identification of chemicals and drugs interact with genes involved in malignant transfromation |
| (DGIdb 4.0) |
| Entrez ID | Symbol | Category | Interaction Types | Drug Claim Name | Drug Name | PMIDs |
| Page: 1 |

Copyright 2023-Present -The University of Texas Health Science Center at Houston |