
|
|||||
|
 | |
| |
| |
| |
| |
| |
|
Gene: RRP8 |
Gene summary for RRP8 |
| Gene information | Species | Human | Gene symbol | RRP8 | Gene ID | 23378 |
| Gene name | ribosomal RNA processing 8 | |
| Gene Alias | KIAA0409 | |
| Cytomap | 11p15.4 | |
| Gene Type | protein-coding | GO ID | GO:0000183 | UniProtAcc | O43159 |
Top |
Malignant transformation analysis |
| Identification of the aberrant gene expression in precancerous and cancerous lesions by comparing the gene expression of stem-like cells in diseased tissues with normal stem cells |
| Entrez ID | Symbol | Replicates | Species | Organ | Tissue | Adj P-value | Log2FC | Malignancy |
| 23378 | RRP8 | LZE4T | Human | Esophagus | ESCC | 4.34e-02 | 1.20e-01 | 0.0811 |
| 23378 | RRP8 | LZE7T | Human | Esophagus | ESCC | 2.60e-07 | 2.31e-01 | 0.0667 |
| 23378 | RRP8 | LZE8T | Human | Esophagus | ESCC | 6.02e-05 | 1.59e-01 | 0.067 |
| 23378 | RRP8 | LZE20T | Human | Esophagus | ESCC | 2.65e-03 | 1.01e-01 | 0.0662 |
| 23378 | RRP8 | LZE24T | Human | Esophagus | ESCC | 1.39e-08 | 2.33e-01 | 0.0596 |
| 23378 | RRP8 | P1T-E | Human | Esophagus | ESCC | 2.80e-03 | 1.51e-01 | 0.0875 |
| 23378 | RRP8 | P2T-E | Human | Esophagus | ESCC | 2.52e-18 | 2.49e-01 | 0.1177 |
| 23378 | RRP8 | P4T-E | Human | Esophagus | ESCC | 1.34e-07 | 1.95e-01 | 0.1323 |
| 23378 | RRP8 | P5T-E | Human | Esophagus | ESCC | 1.52e-08 | 1.84e-01 | 0.1327 |
| 23378 | RRP8 | P8T-E | Human | Esophagus | ESCC | 4.83e-15 | 1.31e-01 | 0.0889 |
| 23378 | RRP8 | P9T-E | Human | Esophagus | ESCC | 1.72e-11 | 2.62e-01 | 0.1131 |
| 23378 | RRP8 | P10T-E | Human | Esophagus | ESCC | 1.65e-17 | 2.77e-01 | 0.116 |
| 23378 | RRP8 | P11T-E | Human | Esophagus | ESCC | 6.58e-10 | 4.62e-01 | 0.1426 |
| 23378 | RRP8 | P12T-E | Human | Esophagus | ESCC | 8.48e-10 | 1.93e-01 | 0.1122 |
| 23378 | RRP8 | P15T-E | Human | Esophagus | ESCC | 6.61e-11 | 2.37e-01 | 0.1149 |
| 23378 | RRP8 | P16T-E | Human | Esophagus | ESCC | 3.83e-12 | 1.35e-01 | 0.1153 |
| 23378 | RRP8 | P17T-E | Human | Esophagus | ESCC | 2.46e-07 | 3.76e-01 | 0.1278 |
| 23378 | RRP8 | P19T-E | Human | Esophagus | ESCC | 8.01e-04 | 3.82e-01 | 0.1662 |
| 23378 | RRP8 | P20T-E | Human | Esophagus | ESCC | 6.22e-11 | 2.55e-01 | 0.1124 |
| 23378 | RRP8 | P21T-E | Human | Esophagus | ESCC | 1.42e-14 | 1.97e-01 | 0.1617 |
| Page: 1 2 3 4 5 |
| Tissue | Expression Dynamics | Abbreviation |
| Esophagus |  | ESCC: Esophageal squamous cell carcinoma |
| HGIN: High-grade intraepithelial neoplasias | ||
| LGIN: Low-grade intraepithelial neoplasias | ||
| Liver |  | HCC: Hepatocellular carcinoma |
| NAFLD: Non-alcoholic fatty liver disease | ||
| Oral Cavity | 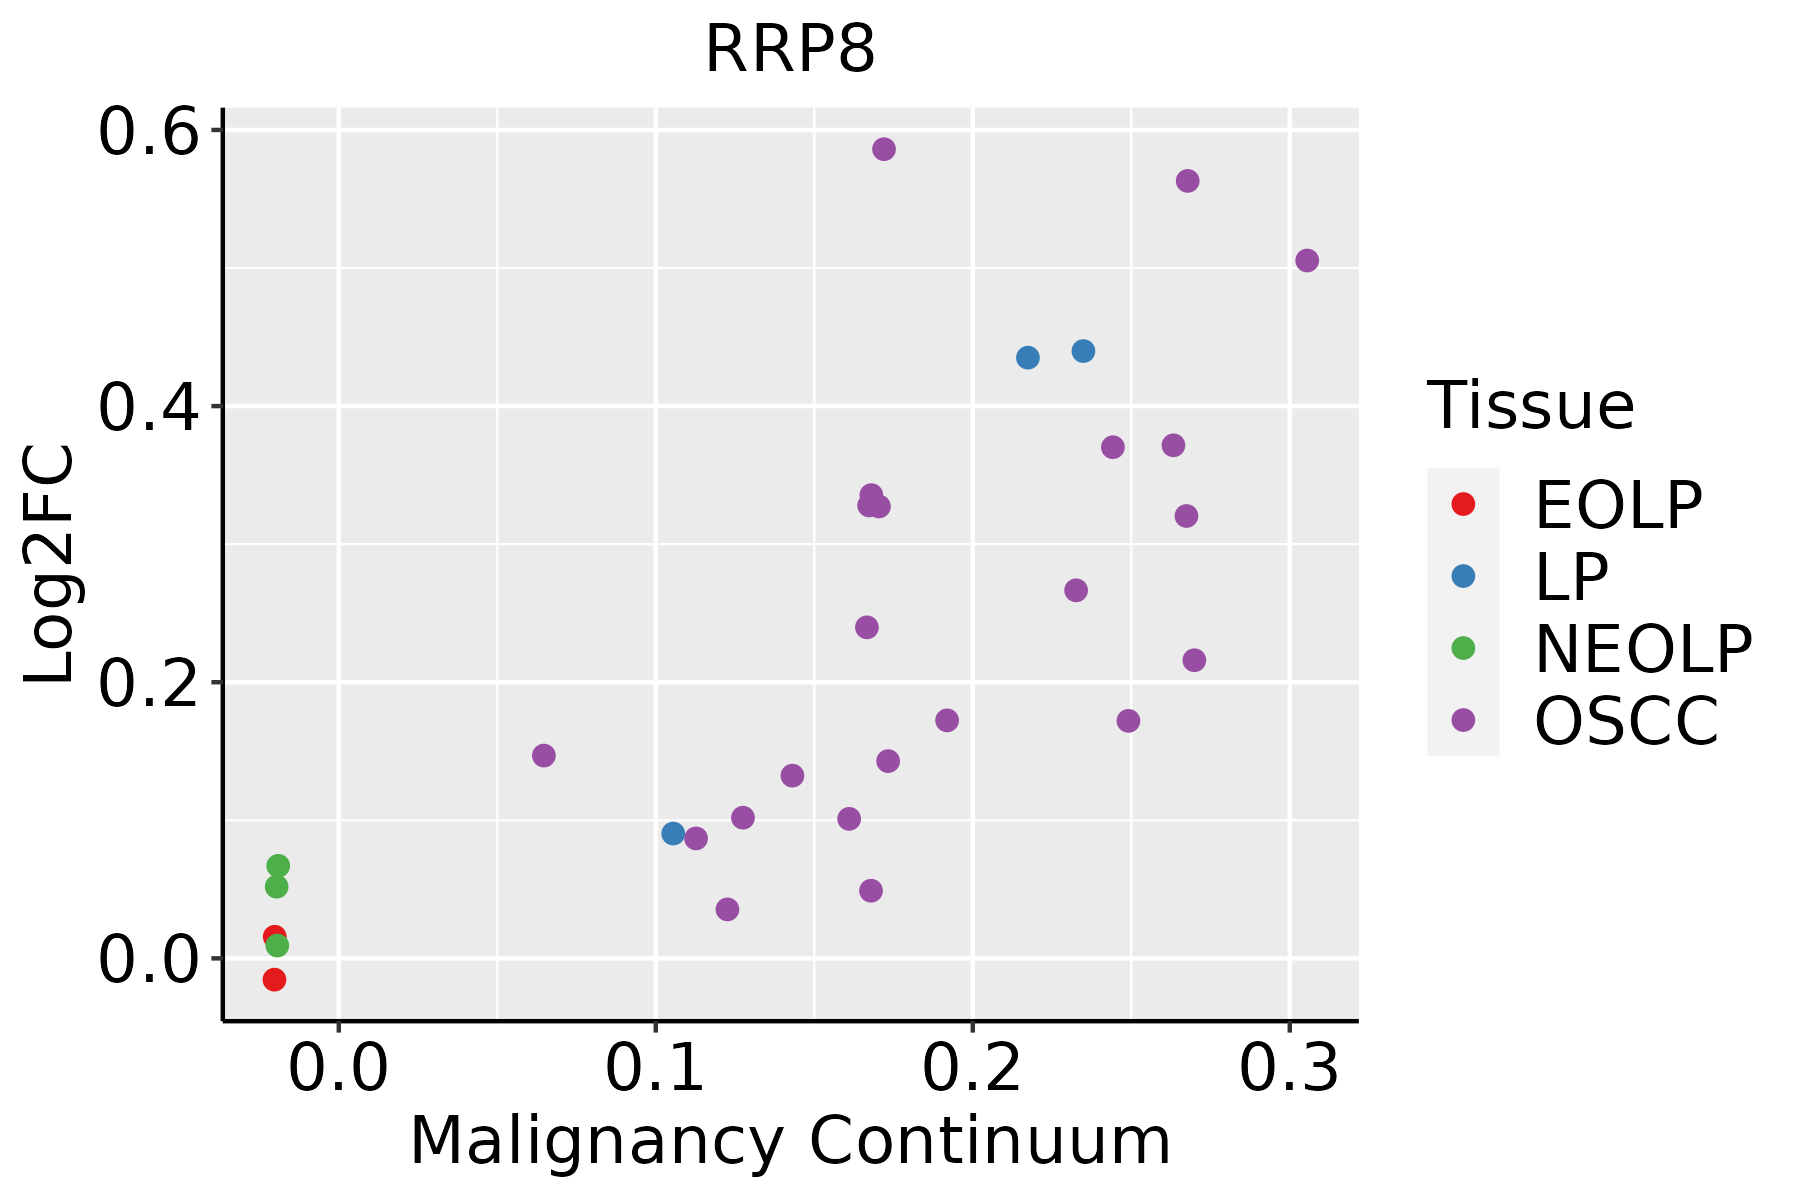 | EOLP: Erosive Oral lichen planus |
| LP: leukoplakia | ||
| NEOLP: Non-erosive oral lichen planus | ||
| OSCC: Oral squamous cell carcinoma |
| ∗log2FC in expression of this searched gene in stem-like cells from each diseased tissue sample relative to stem-like cells in normal samples in each tissue plotted against the malignancy continuum. Samples are colored based on if they are from different disease stage. |
Top |
Malignant transformation related pathway analysis |
| Find out the enriched GO biological processes and KEGG pathways involved in transition from healthy to precancer to cancer |
| Tissue | Disease Stage | Enriched GO biological Processes |
| Colorectum | AD |  |
| Colorectum | SER |  |
| Colorectum | MSS |  |
| Colorectum | MSI-H |  |
| Colorectum | FAP |  |
| ∗Top 15 enriched GO BP terms are showed in the bar plot of each disease state in each tissue. Each row represents a significant GO biological process which is colored according to the -log10(p.adjust). |
| Page: 1 2 3 4 5 6 7 8 9 |
| GO ID | Tissue | Disease Stage | Description | Gene Ratio | Bg Ratio | pvalue | p.adjust | Count |
| GO:0022613111 | Esophagus | ESCC | ribonucleoprotein complex biogenesis | 365/8552 | 463/18723 | 1.74e-49 | 1.11e-45 | 365 |
| GO:0042254111 | Esophagus | ESCC | ribosome biogenesis | 252/8552 | 299/18723 | 3.27e-44 | 1.04e-40 | 252 |
| GO:003447015 | Esophagus | ESCC | ncRNA processing | 300/8552 | 395/18723 | 3.09e-35 | 3.26e-32 | 300 |
| GO:0016072110 | Esophagus | ESCC | rRNA metabolic process | 197/8552 | 236/18723 | 1.31e-33 | 1.18e-30 | 197 |
| GO:0006364110 | Esophagus | ESCC | rRNA processing | 189/8552 | 225/18723 | 4.88e-33 | 3.87e-30 | 189 |
| GO:003466012 | Esophagus | ESCC | ncRNA metabolic process | 346/8552 | 485/18723 | 4.35e-31 | 2.51e-28 | 346 |
| GO:0097193111 | Esophagus | ESCC | intrinsic apoptotic signaling pathway | 222/8552 | 288/18723 | 5.87e-28 | 2.02e-25 | 222 |
| GO:0071496111 | Esophagus | ESCC | cellular response to external stimulus | 215/8552 | 320/18723 | 4.29e-15 | 2.43e-13 | 215 |
| GO:0072331111 | Esophagus | ESCC | signal transduction by p53 class mediator | 121/8552 | 163/18723 | 9.61e-14 | 4.69e-12 | 121 |
| GO:0031668111 | Esophagus | ESCC | cellular response to extracellular stimulus | 168/8552 | 246/18723 | 4.93e-13 | 2.23e-11 | 168 |
| GO:0031669110 | Esophagus | ESCC | cellular response to nutrient levels | 148/8552 | 215/18723 | 4.58e-12 | 1.76e-10 | 148 |
| GO:0031667111 | Esophagus | ESCC | response to nutrient levels | 289/8552 | 474/18723 | 9.25e-12 | 3.47e-10 | 289 |
| GO:0009267110 | Esophagus | ESCC | cellular response to starvation | 110/8552 | 156/18723 | 2.63e-10 | 7.37e-09 | 110 |
| GO:004259419 | Esophagus | ESCC | response to starvation | 133/8552 | 197/18723 | 4.31e-10 | 1.14e-08 | 133 |
| GO:000699713 | Esophagus | ESCC | nucleus organization | 96/8552 | 133/18723 | 4.66e-10 | 1.21e-08 | 96 |
| GO:00322592 | Esophagus | ESCC | methylation | 222/8552 | 364/18723 | 2.26e-09 | 5.09e-08 | 222 |
| GO:0072332111 | Esophagus | ESCC | intrinsic apoptotic signaling pathway by p53 class mediator | 59/8552 | 76/18723 | 1.22e-08 | 2.42e-07 | 59 |
| GO:000632517 | Esophagus | ESCC | chromatin organization | 240/8552 | 409/18723 | 6.52e-08 | 1.14e-06 | 240 |
| GO:00400295 | Esophagus | ESCC | regulation of gene expression, epigenetic | 74/8552 | 105/18723 | 2.24e-07 | 3.42e-06 | 74 |
| GO:00421492 | Esophagus | ESCC | cellular response to glucose starvation | 36/8552 | 48/18723 | 3.43e-05 | 2.80e-04 | 36 |
| Page: 1 2 3 4 |
| Pathway ID | Tissue | Disease Stage | Description | Gene Ratio | Bg Ratio | pvalue | p.adjust | qvalue | Count |
| Page: 1 |
Top |
Cell-cell communication analysis |
| Identification of potential cell-cell interactions between two cell types and their ligand-receptor pairs for different disease states |
| Ligand | Receptor | LRpair | Pathway | Tissue | Disease Stage |
| Page: 1 |
Top |
Single-cell gene regulatory network inference analysis |
| Find out the significant the regulons (TFs) and the target genes of each regulon across cell types for different disease states |
| TF | Cell Type | Tissue | Disease Stage | Target Gene | RSS | Regulon Activity |
| ∗The dot plots of a searched regulon are shown for all cell subpopulations in each disease state of each tissue based on the regulon specific score inferred using pySCENIC and by calculating the average expression. |
| Page: 1 |
Top |
Somatic mutation of malignant transformation related genes |
| Annotation of somatic variants for genes involved in malignant transformation |
| Hugo Symbol | Variant Class | Variant Classification | dbSNP RS | HGVSc | HGVSp | HGVSp Short | SWISSPROT | BIOTYPE | SIFT | PolyPhen | Tumor Sample Barcode | Tissue | Histology | Sex | Age | Stage | Therapy Types | Drugs | Outcome |
| RRP8 | insertion | Nonsense_Mutation | novel | c.388_389insGCTGCTCCATATCCCTTTATTTGGATATATTATAATCTAACT | p.Glu130delinsGlyCysSerIleSerLeuTyrLeuAspIleLeuTerSerAsnTer | p.E130delinsGCSISLYLDIL*SN* | O43159 | protein_coding | TCGA-AR-A0TY-01 | Breast | breast invasive carcinoma | Female | <65 | I/II | Unspecific | Paclitaxel | PD | ||
| RRP8 | SNV | Missense_Mutation | rs761872259 | c.1202N>A | p.Arg401Gln | p.R401Q | O43159 | protein_coding | tolerated(0.11) | benign(0.009) | TCGA-2W-A8YY-01 | Cervix | cervical & endocervical cancer | Female | <65 | I/II | Chemotherapy | cisplatin | CR |
| RRP8 | SNV | Missense_Mutation | novel | c.1042N>A | p.Ala348Thr | p.A348T | O43159 | protein_coding | deleterious(0.05) | possibly_damaging(0.506) | TCGA-2W-A8YY-01 | Cervix | cervical & endocervical cancer | Female | <65 | I/II | Chemotherapy | cisplatin | CR |
| RRP8 | SNV | Missense_Mutation | c.703N>A | p.Ala235Thr | p.A235T | O43159 | protein_coding | tolerated(0.06) | benign(0.074) | TCGA-AD-5900-01 | Colorectum | colon adenocarcinoma | Male | >=65 | I/II | Unknown | Unknown | SD | |
| RRP8 | SNV | Missense_Mutation | rs770567575 | c.718G>A | p.Ala240Thr | p.A240T | O43159 | protein_coding | tolerated(0.06) | benign(0.294) | TCGA-AG-A036-01 | Colorectum | rectum adenocarcinoma | Male | >=65 | III/IV | Chemotherapy | 5-fluorouracil | CR |
| RRP8 | SNV | Missense_Mutation | rs763957188 | c.1213C>T | p.Arg405Trp | p.R405W | O43159 | protein_coding | deleterious(0) | possibly_damaging(0.812) | TCGA-CL-5918-01 | Colorectum | rectum adenocarcinoma | Female | >=65 | I/II | Unknown | Unknown | SD |
| RRP8 | SNV | Missense_Mutation | c.791G>A | p.Ser264Asn | p.S264N | O43159 | protein_coding | tolerated(0.06) | benign(0.012) | TCGA-DY-A1DC-01 | Colorectum | rectum adenocarcinoma | Female | >=65 | I/II | Chemotherapy | capecitabine | PR | |
| RRP8 | insertion | Frame_Shift_Ins | novel | c.648dupC | p.Thr217HisfsTer16 | p.T217Hfs*16 | O43159 | protein_coding | TCGA-EI-6507-01 | Colorectum | rectum adenocarcinoma | Male | <65 | I/II | Unknown | Unknown | SD | ||
| RRP8 | SNV | Missense_Mutation | novel | c.889N>A | p.Asp297Asn | p.D297N | O43159 | protein_coding | tolerated(0.15) | possibly_damaging(0.679) | TCGA-A5-A0G2-01 | Endometrium | uterine corpus endometrioid carcinoma | Female | <65 | III/IV | Unknown | Unknown | SD |
| RRP8 | SNV | Missense_Mutation | novel | c.696N>T | p.Glu232Asp | p.E232D | O43159 | protein_coding | tolerated(0.12) | benign(0.037) | TCGA-A5-A1OF-01 | Endometrium | uterine corpus endometrioid carcinoma | Female | <65 | I/II | Unknown | Unknown | SD |
| Page: 1 2 3 4 5 6 |
Top |
Related drugs of malignant transformation related genes |
| Identification of chemicals and drugs interact with genes involved in malignant transfromation |
| (DGIdb 4.0) |
| Entrez ID | Symbol | Category | Interaction Types | Drug Claim Name | Drug Name | PMIDs |
| Page: 1 |

Copyright 2023-Present -The University of Texas Health Science Center at Houston |