Schematic overview of the cellular and molecular mechanisms involved in the cancer progression, including the proposed cellular and molecular mechanisms in cancer cells trajectory. AT1: alveolar type 1 cells; AT2: alveolar type 2 cells; AAH: atypical adenomatous hyperplasia; AIS: adenocarcinoma in situ; MIA: minimally invasive adenocarcinoma; IA: invasive adenocarcinoma; EMT: epithelial-mesenchymal transition

Home

Download

Statistics

Help

Contact

Center for Computational Systems Medicine
leaf

Gene summary

leaf

Malignant transformation analysis

leaf

Malignant transformation related pathway analysis

leaf

Cell-cell communication analysis

leaf

Single-cell gene regulatory network inference analysis

leaf

Somatic mutation of malignant transformation related genes

leaf

Related drugs of malignant transformation related genes

Gene: RRP7A

Gene summary for RRP7A

check button Gene summary.

Gene informationSpeciesHuman
Gene symbol

RRP7A

Gene ID

27341

Gene nameribosomal RNA processing 7 homolog A
Gene AliasBK126B4.3
Cytomap22q13.2
Gene Typeprotein-coding
GO ID

GO:0000028

UniProtAcc

Q9Y3A4


Top

Malignant transformation analysis

check button Identification of the aberrant gene expression in precancerous and cancerous lesions by comparing the gene expression of stem-like cells in diseased tissues with normal stem cells
check button Malignant transformation involving gene list.
Entrez IDSymbolReplicatesSpeciesOrganTissueAdj P-valueLog2FCMalignancy
27341RRP7ALZE4THumanEsophagusESCC2.03e-052.29e-010.0811
27341RRP7ALZE7THumanEsophagusESCC5.37e-095.58e-010.0667
27341RRP7ALZE8THumanEsophagusESCC1.58e-124.19e-010.067
27341RRP7ALZE20THumanEsophagusESCC8.23e-051.93e-010.0662
27341RRP7ALZE22THumanEsophagusESCC1.19e-023.77e-010.068
27341RRP7ALZE24THumanEsophagusESCC1.21e-236.77e-010.0596
27341RRP7ALZE21THumanEsophagusESCC5.18e-064.97e-010.0655
27341RRP7ALZE6THumanEsophagusESCC2.10e-127.06e-010.0845
27341RRP7AP1T-EHumanEsophagusESCC4.39e-107.38e-010.0875
27341RRP7AP2T-EHumanEsophagusESCC2.48e-327.22e-010.1177
27341RRP7AP4T-EHumanEsophagusESCC8.70e-298.50e-010.1323
27341RRP7AP5T-EHumanEsophagusESCC2.66e-409.45e-010.1327
27341RRP7AP8T-EHumanEsophagusESCC2.79e-265.15e-010.0889
27341RRP7AP9T-EHumanEsophagusESCC1.35e-175.43e-010.1131
27341RRP7AP10T-EHumanEsophagusESCC7.69e-203.57e-010.116
27341RRP7AP11T-EHumanEsophagusESCC3.19e-166.59e-010.1426
27341RRP7AP12T-EHumanEsophagusESCC2.85e-265.68e-010.1122
27341RRP7AP15T-EHumanEsophagusESCC2.72e-267.09e-010.1149
27341RRP7AP16T-EHumanEsophagusESCC4.84e-349.48e-010.1153
27341RRP7AP17T-EHumanEsophagusESCC8.25e-179.75e-010.1278
Page: 1 2 3 4 5 6 7 

check button Transcriptomic changes along malignancy continuum.
TissueExpression DynamicsAbbreviation
EsophagusThe image shows the transcriptomic changes along malignancy continuum.log2FC in expression of this searched gene in stem-like cells from each diseased tissue sample relative to stem-like cells in normal samples in each tissue plotted against the malignancy continuum. Samples are colored based on if they are from different disease stage.
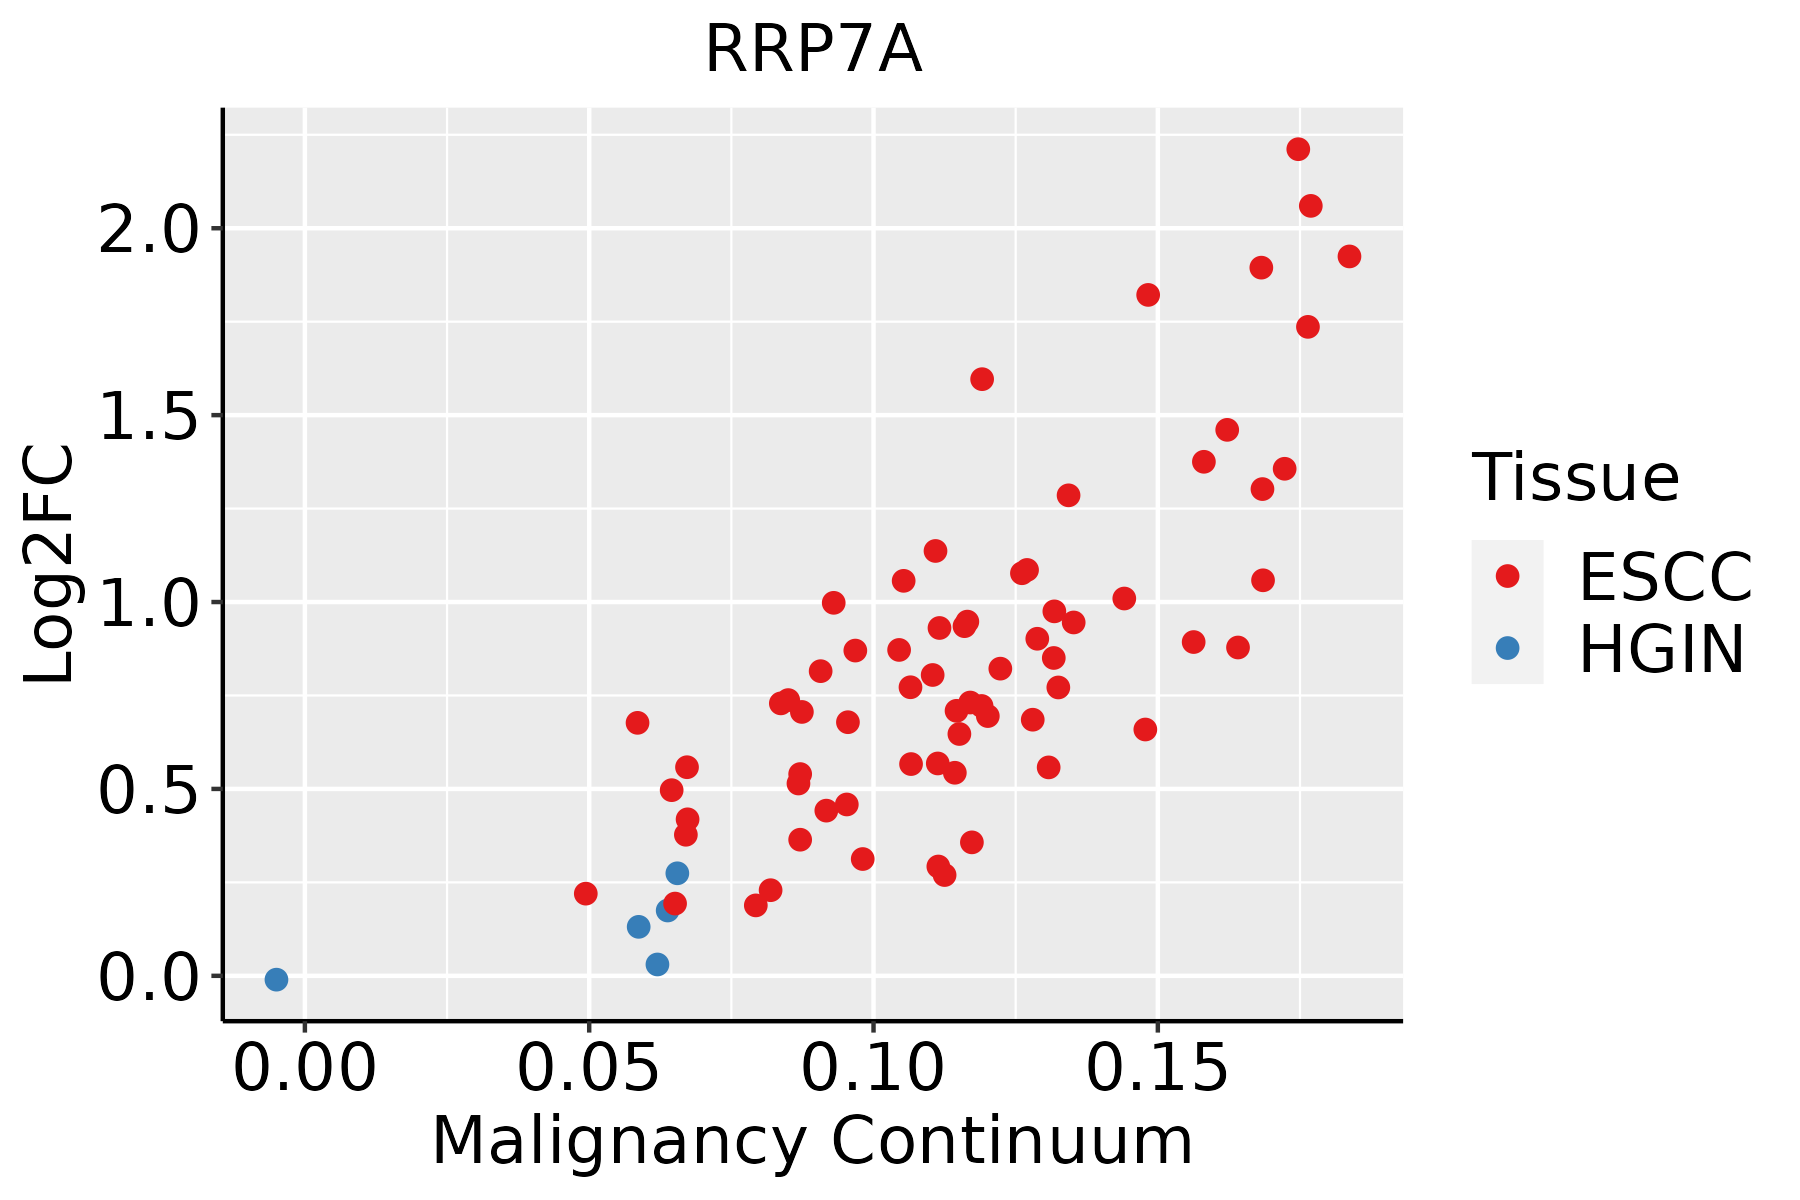
ESCC: Esophageal squamous cell carcinoma
HGIN: High-grade intraepithelial neoplasias
LGIN: Low-grade intraepithelial neoplasias
LiverThe image shows the transcriptomic changes along malignancy continuum.log2FC in expression of this searched gene in stem-like cells from each diseased tissue sample relative to stem-like cells in normal samples in each tissue plotted against the malignancy continuum. Samples are colored based on if they are from different disease stage.
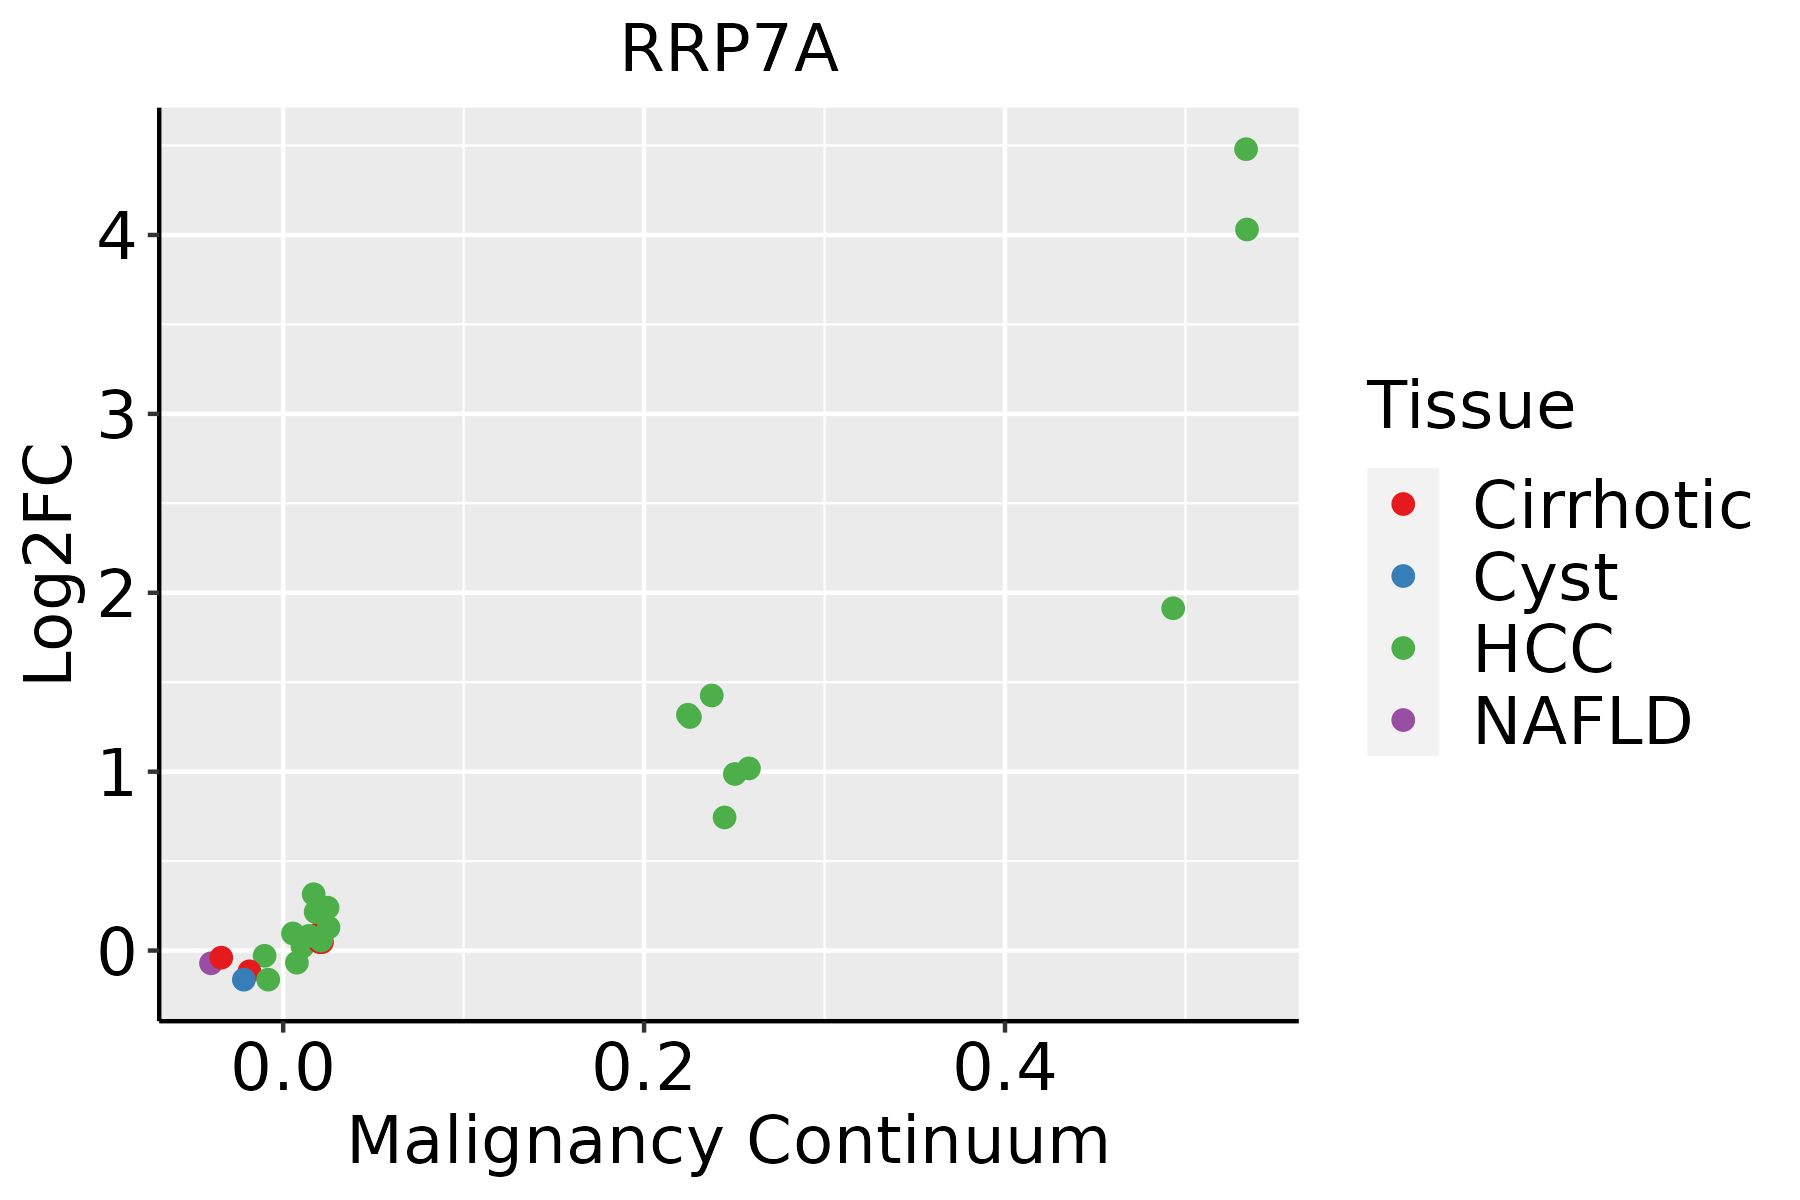
HCC: Hepatocellular carcinoma
NAFLD: Non-alcoholic fatty liver disease
Oral CavityThe image shows the transcriptomic changes along malignancy continuum.log2FC in expression of this searched gene in stem-like cells from each diseased tissue sample relative to stem-like cells in normal samples in each tissue plotted against the malignancy continuum. Samples are colored based on if they are from different disease stage.
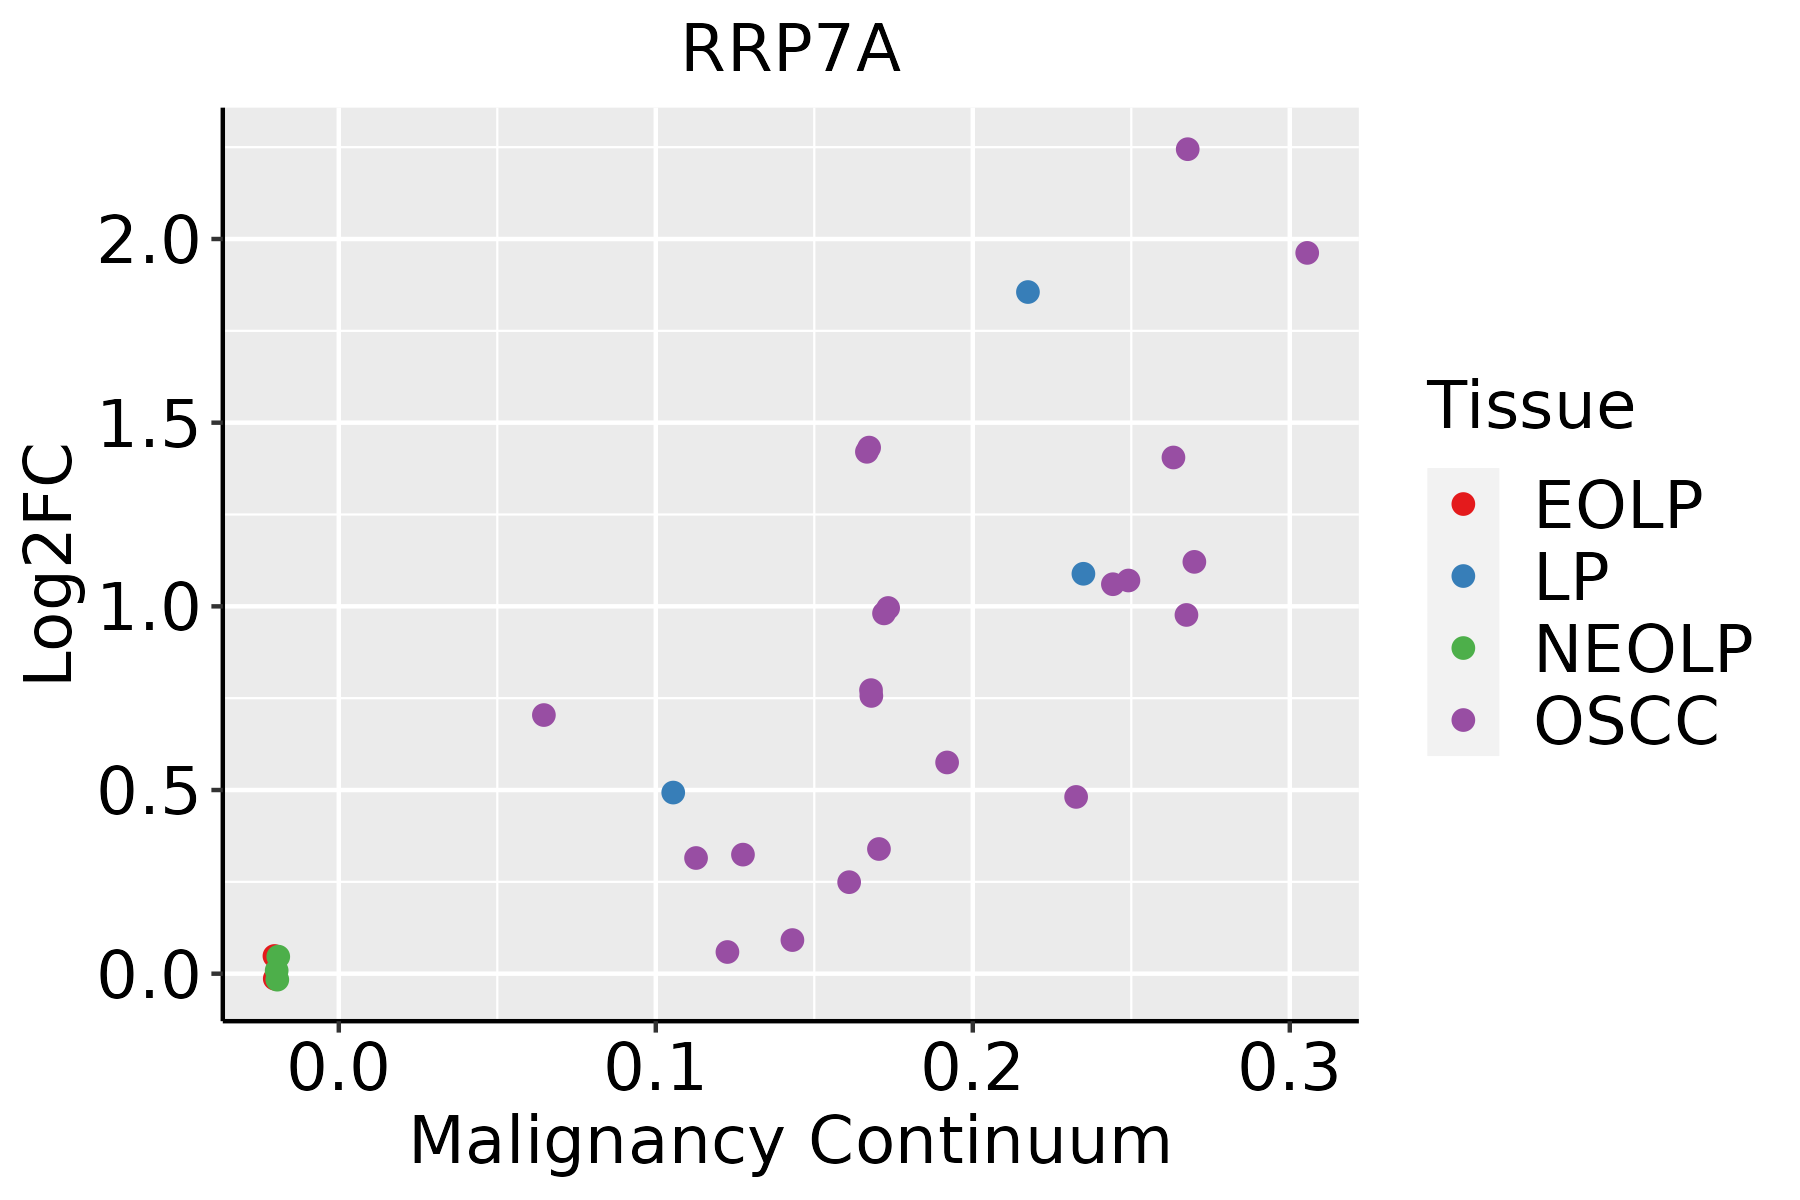
EOLP: Erosive Oral lichen planus
LP: leukoplakia
NEOLP: Non-erosive oral lichen planus
OSCC: Oral squamous cell carcinoma
SkinThe image shows the transcriptomic changes along malignancy continuum.log2FC in expression of this searched gene in stem-like cells from each diseased tissue sample relative to stem-like cells in normal samples in each tissue plotted against the malignancy continuum. Samples are colored based on if they are from different disease stage.AK: Actinic keratosis
cSCC: Cutaneous squamous cell carcinoma
SCCIS:squamous cell carcinoma in situ
ThyroidThe image shows the transcriptomic changes along malignancy continuum.log2FC in expression of this searched gene in stem-like cells from each diseased tissue sample relative to stem-like cells in normal samples in each tissue plotted against the malignancy continuum. Samples are colored based on if they are from different disease stage.
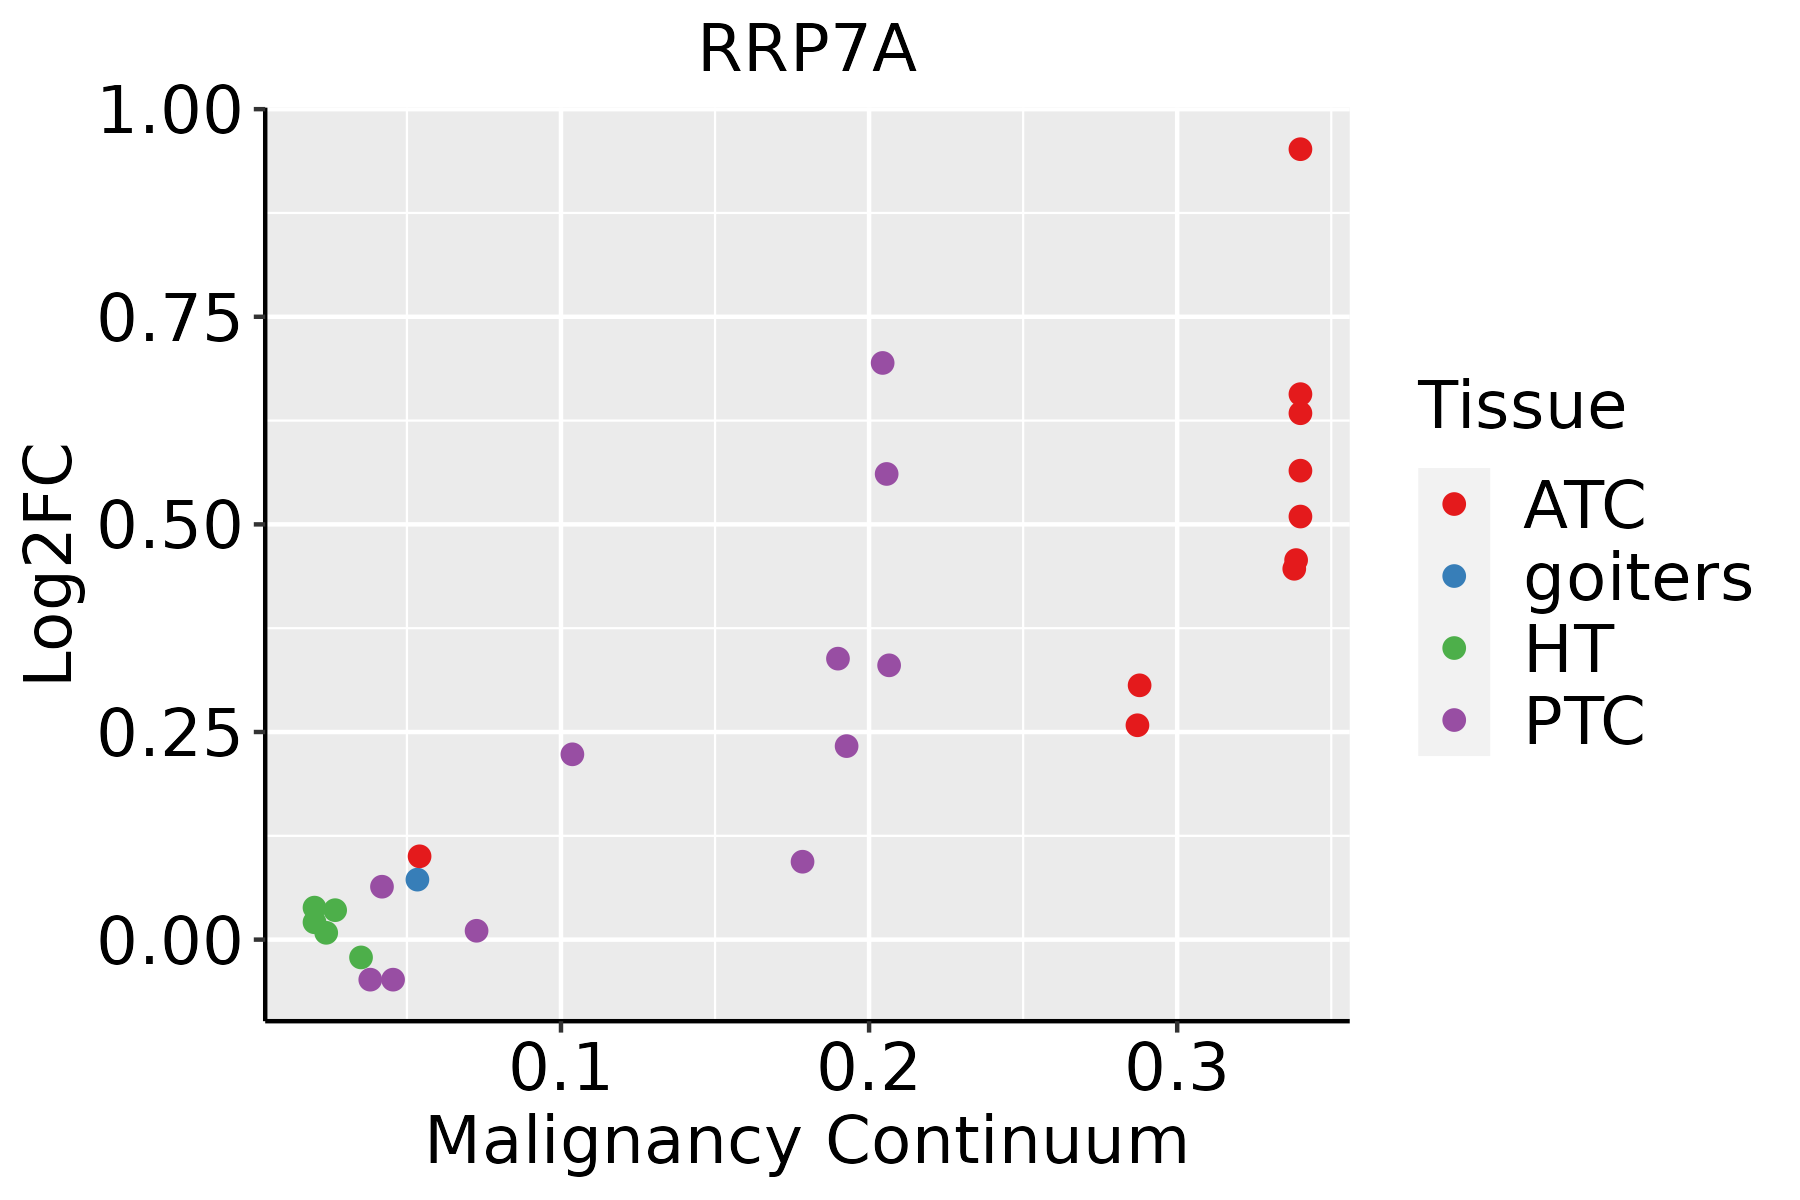
ATC: Anaplastic thyroid cancer
HT: Hashimoto's thyroiditis
PTC: Papillary thyroid cancer
∗log2FC in expression of this searched gene in stem-like cells from each diseased tissue sample relative to stem-like cells in normal samples in each tissue plotted against the malignancy continuum. Samples are colored based on if they are from different disease stage.

Top

Malignant transformation related pathway analysis

check buttonFind out the enriched GO biological processes and KEGG pathways involved in transition from healthy to precancer to cancer
check button Figure of enriched GO biological processes.
TissueDisease StageEnriched GO biological Processes
ColorectumADGO analysis - Figure of enriched GO biological processes: Top 15 enriched GO BP terms are showed in the bar plot of each disease state in each tissue. Each row represents a significant GO biological process which is colored according to the -log10(p.adjust).
ColorectumSERGO analysis - Figure of enriched GO biological processes: Top 15 enriched GO BP terms are showed in the bar plot of each disease state in each tissue. Each row represents a significant GO biological process which is colored according to the -log10(p.adjust).
ColorectumMSSGO analysis - Figure of enriched GO biological processes: Top 15 enriched GO BP terms are showed in the bar plot of each disease state in each tissue. Each row represents a significant GO biological process which is colored according to the -log10(p.adjust).
ColorectumMSI-HGO analysis - Figure of enriched GO biological processes: Top 15 enriched GO BP terms are showed in the bar plot of each disease state in each tissue. Each row represents a significant GO biological process which is colored according to the -log10(p.adjust).
ColorectumFAPGO analysis - Figure of enriched GO biological processes: Top 15 enriched GO BP terms are showed in the bar plot of each disease state in each tissue. Each row represents a significant GO biological process which is colored according to the -log10(p.adjust).
∗Top 15 enriched GO BP terms are showed in the bar plot of each disease state in each tissue. Each row represents a significant GO biological process which is colored according to the -log10(p.adjust).
Page: 1 2 3 4 5 6 7 8 9 

check button Enriched GO biological processes.
GO IDTissueDisease StageDescriptionGene RatioBg Ratiopvaluep.adjustCount
GO:0022613111EsophagusESCCribonucleoprotein complex biogenesis365/8552463/187231.74e-491.11e-45365
GO:0042254111EsophagusESCCribosome biogenesis252/8552299/187233.27e-441.04e-40252
GO:003447015EsophagusESCCncRNA processing300/8552395/187233.09e-353.26e-32300
GO:0016072110EsophagusESCCrRNA metabolic process197/8552236/187231.31e-331.18e-30197
GO:0006364110EsophagusESCCrRNA processing189/8552225/187234.88e-333.87e-30189
GO:003466012EsophagusESCCncRNA metabolic process346/8552485/187234.35e-312.51e-28346
GO:0071826111EsophagusESCCribonucleoprotein complex subunit organization166/8552227/187232.94e-172.42e-15166
GO:0042274111EsophagusESCCribosomal small subunit biogenesis67/855273/187236.62e-175.38e-1567
GO:0022618111EsophagusESCCribonucleoprotein complex assembly159/8552220/187238.19e-165.71e-14159
GO:000170119EsophagusESCCin utero embryonic development243/8552367/187231.00e-156.86e-14243
GO:0042255111EsophagusESCCribosome assembly50/855261/187235.66e-091.17e-0750
GO:000182412EsophagusESCCblastocyst development73/8552106/187231.13e-061.40e-0573
GO:00018253EsophagusESCCblastocyst formation29/855238/187231.18e-048.13e-0429
GO:0000028111EsophagusESCCribosomal small subunit assembly16/855219/187236.45e-043.43e-0316
GO:002261312LiverCirrhoticribonucleoprotein complex biogenesis231/4634463/187233.28e-326.86e-29231
GO:004225412LiverCirrhoticribosome biogenesis154/4634299/187231.18e-236.72e-21154
GO:000636412LiverCirrhoticrRNA processing115/4634225/187231.12e-171.64e-15115
GO:00160724LiverCirrhoticrRNA metabolic process119/4634236/187231.19e-171.70e-15119
GO:007182612LiverCirrhoticribonucleoprotein complex subunit organization115/4634227/187232.67e-173.63e-15115
GO:002261812LiverCirrhoticribonucleoprotein complex assembly112/4634220/187234.35e-175.81e-15112
Page: 1 2 3 4 5 6 

check button Enriched KEGG pathways.
Pathway IDTissueDisease StageDescriptionGene RatioBg Ratiopvaluep.adjustqvalueCount
Page: 1 

Top

Cell-cell communication analysis

check buttonIdentification of potential cell-cell interactions between two cell types and their ligand-receptor pairs for different disease states
LigandReceptorLRpairPathwayTissueDisease Stage
Page: 1 

Top

Single-cell gene regulatory network inference analysis

check buttonFind out the significant the regulons (TFs) and the target genes of each regulon across cell types for different disease states
TFCell TypeTissueDisease StageTarget GeneRSSRegulon Activity
∗The dot plots of a searched regulon are shown for all cell subpopulations in each disease state of each tissue based on the regulon specific score inferred using pySCENIC and by calculating the average expression.
Page: 1 

Top

Somatic mutation of malignant transformation related genes

check buttonAnnotation of somatic variants for genes involved in malignant transformation
Hugo SymbolVariant ClassVariant ClassificationdbSNP RSHGVScHGVSpHGVSp ShortSWISSPROTBIOTYPESIFTPolyPhenTumor Sample BarcodeTissueHistologySexAgeStageTherapy TypesDrugsOutcome
RRP7ASNVMissense_Mutationnovelc.766C>Ap.Gln256Lysp.Q256KQ9Y3A4protein_codingdeleterious(0)benign(0.076)TCGA-A7-A0DB-01Breastbreast invasive carcinomaFemale<65I/IIHormone TherapyarimidexSD
RRP7ASNVMissense_Mutationc.325N>Tp.His109Tyrp.H109YQ9Y3A4protein_codingtolerated(0.07)benign(0.035)TCGA-BH-A0HP-01Breastbreast invasive carcinomaFemale>=65III/IVChemotherapydoxorubicinSD
RRP7AinsertionNonsense_Mutationnovelc.115_116insGAGCCAGGCATGATGGCATGTGTGGGTAGTCCp.Tyr39Terp.Y39*Q9Y3A4protein_codingTCGA-BH-A0H9-01Breastbreast invasive carcinomaFemale>=65I/IIHormone TherapyarimidexSD
RRP7ASNVMissense_Mutationnovelc.773N>Ap.Arg258Hisp.R258HQ9Y3A4protein_codingdeleterious(0.01)possibly_damaging(0.611)TCGA-2W-A8YY-01Cervixcervical & endocervical cancerFemale<65I/IIChemotherapycisplatinCR
RRP7ASNVMissense_Mutationrs141279637c.691N>Tp.Arg231Trpp.R231WQ9Y3A4protein_codingdeleterious(0.01)probably_damaging(0.912)TCGA-AD-6889-01Colorectumcolon adenocarcinomaMale>=65I/IIChemotherapyxelodaPD
RRP7ASNVMissense_Mutationc.649C>Tp.Arg217Trpp.R217WQ9Y3A4protein_codingdeleterious(0.03)probably_damaging(0.991)TCGA-AZ-4308-01Colorectumcolon adenocarcinomaFemale<65III/IVTargeted Molecular therapyavastinCR
RRP7ASNVMissense_Mutationrs761382571c.772N>Tp.Arg258Cysp.R258CQ9Y3A4protein_codingdeleterious(0.01)probably_damaging(0.996)TCGA-AX-A2HA-01Endometriumuterine corpus endometrioid carcinomaFemale<65I/IIUnknownUnknownSD
RRP7ASNVMissense_Mutationrs142219748c.230N>Ap.Arg77Hisp.R77HQ9Y3A4protein_codingdeleterious(0.01)benign(0.391)TCGA-B5-A3FC-01Endometriumuterine corpus endometrioid carcinomaFemale<65I/IIUnknownUnknownSD
RRP7ASNVMissense_Mutationnovelc.321N>Gp.Phe107Leup.F107LQ9Y3A4protein_codingtolerated(0.12)benign(0.005)TCGA-E6-A1LX-01Endometriumuterine corpus endometrioid carcinomaFemale<65I/IIUnknownUnknownSD
RRP7ASNVMissense_Mutationrs187868023c.698N>Ap.Arg233Hisp.R233HQ9Y3A4protein_codingdeleterious(0.01)benign(0.249)TCGA-EO-A22R-01Endometriumuterine corpus endometrioid carcinomaFemale<65I/IIUnknownUnknownSD
Page: 1 2 

Top

Related drugs of malignant transformation related genes

check buttonIdentification of chemicals and drugs interact with genes involved in malignant transfromation
(DGIdb 4.0)
Entrez IDSymbolCategoryInteraction TypesDrug Claim NameDrug NamePMIDs
27341RRP7ANAmethylphenidateMETHYLPHENIDATE29382897
Page: 1