Schematic overview of the cellular and molecular mechanisms involved in the cancer progression, including the proposed cellular and molecular mechanisms in cancer cells trajectory. AT1: alveolar type 1 cells; AT2: alveolar type 2 cells; AAH: atypical adenomatous hyperplasia; AIS: adenocarcinoma in situ; MIA: minimally invasive adenocarcinoma; IA: invasive adenocarcinoma; EMT: epithelial-mesenchymal transition

Home

Download

Statistics

Help

Contact

Center for Computational Systems Medicine
leaf

Gene summary

leaf

Malignant transformation analysis

leaf

Malignant transformation related pathway analysis

leaf

Cell-cell communication analysis

leaf

Single-cell gene regulatory network inference analysis

leaf

Somatic mutation of malignant transformation related genes

leaf

Related drugs of malignant transformation related genes

Gene: RRP1B

Gene summary for RRP1B

check button Gene summary.

Gene informationSpeciesHuman
Gene symbol

RRP1B

Gene ID

23076

Gene nameribosomal RNA processing 1B
Gene AliasKIAA0179
Cytomap21q22.3
Gene Typeprotein-coding
GO ID

GO:0006139

UniProtAcc

Q14684


Top

Malignant transformation analysis

check button Identification of the aberrant gene expression in precancerous and cancerous lesions by comparing the gene expression of stem-like cells in diseased tissues with normal stem cells
check button Malignant transformation involving gene list.
Entrez IDSymbolReplicatesSpeciesOrganTissueAdj P-valueLog2FCMalignancy
23076RRP1BLZE4THumanEsophagusESCC4.60e-097.57e-020.0811
23076RRP1BLZE24THumanEsophagusESCC9.18e-103.96e-010.0596
23076RRP1BLZE21THumanEsophagusESCC7.20e-037.95e-020.0655
23076RRP1BP1T-EHumanEsophagusESCC5.59e-042.04e-010.0875
23076RRP1BP2T-EHumanEsophagusESCC8.32e-326.36e-010.1177
23076RRP1BP4T-EHumanEsophagusESCC4.72e-196.50e-010.1323
23076RRP1BP5T-EHumanEsophagusESCC4.04e-226.24e-010.1327
23076RRP1BP8T-EHumanEsophagusESCC8.38e-091.20e-010.0889
23076RRP1BP9T-EHumanEsophagusESCC1.69e-071.69e-010.1131
23076RRP1BP10T-EHumanEsophagusESCC2.12e-244.83e-010.116
23076RRP1BP11T-EHumanEsophagusESCC1.67e-054.23e-010.1426
23076RRP1BP12T-EHumanEsophagusESCC5.99e-263.35e-010.1122
23076RRP1BP15T-EHumanEsophagusESCC5.53e-092.78e-010.1149
23076RRP1BP16T-EHumanEsophagusESCC3.27e-265.44e-010.1153
23076RRP1BP17T-EHumanEsophagusESCC1.35e-093.43e-010.1278
23076RRP1BP20T-EHumanEsophagusESCC1.11e-154.01e-010.1124
23076RRP1BP21T-EHumanEsophagusESCC5.61e-205.44e-010.1617
23076RRP1BP22T-EHumanEsophagusESCC1.46e-123.64e-010.1236
23076RRP1BP23T-EHumanEsophagusESCC2.20e-155.30e-010.108
23076RRP1BP24T-EHumanEsophagusESCC1.15e-165.15e-010.1287
Page: 1 2 3 4 5 

check button Transcriptomic changes along malignancy continuum.
TissueExpression DynamicsAbbreviation
EsophagusThe image shows the transcriptomic changes along malignancy continuum.log2FC in expression of this searched gene in stem-like cells from each diseased tissue sample relative to stem-like cells in normal samples in each tissue plotted against the malignancy continuum. Samples are colored based on if they are from different disease stage.
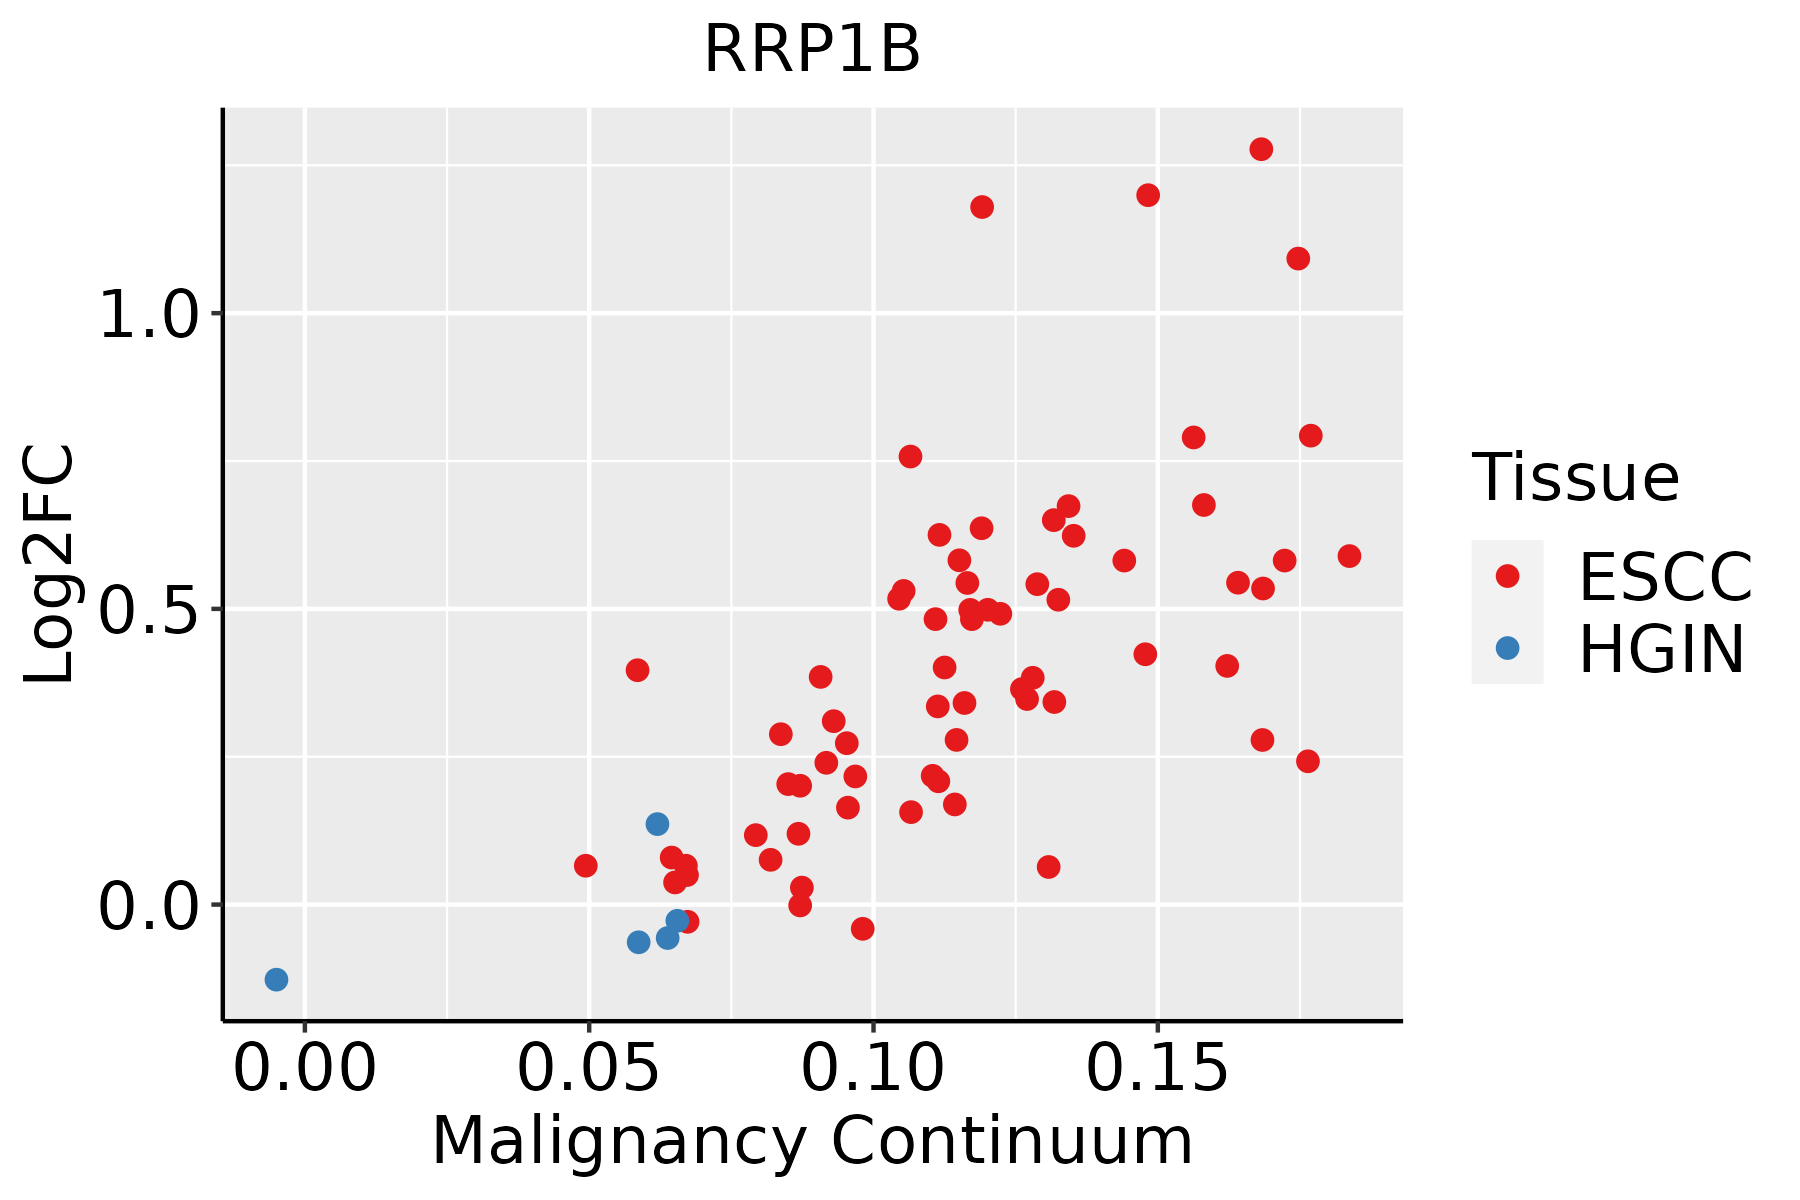
ESCC: Esophageal squamous cell carcinoma
HGIN: High-grade intraepithelial neoplasias
LGIN: Low-grade intraepithelial neoplasias
LiverThe image shows the transcriptomic changes along malignancy continuum.log2FC in expression of this searched gene in stem-like cells from each diseased tissue sample relative to stem-like cells in normal samples in each tissue plotted against the malignancy continuum. Samples are colored based on if they are from different disease stage.
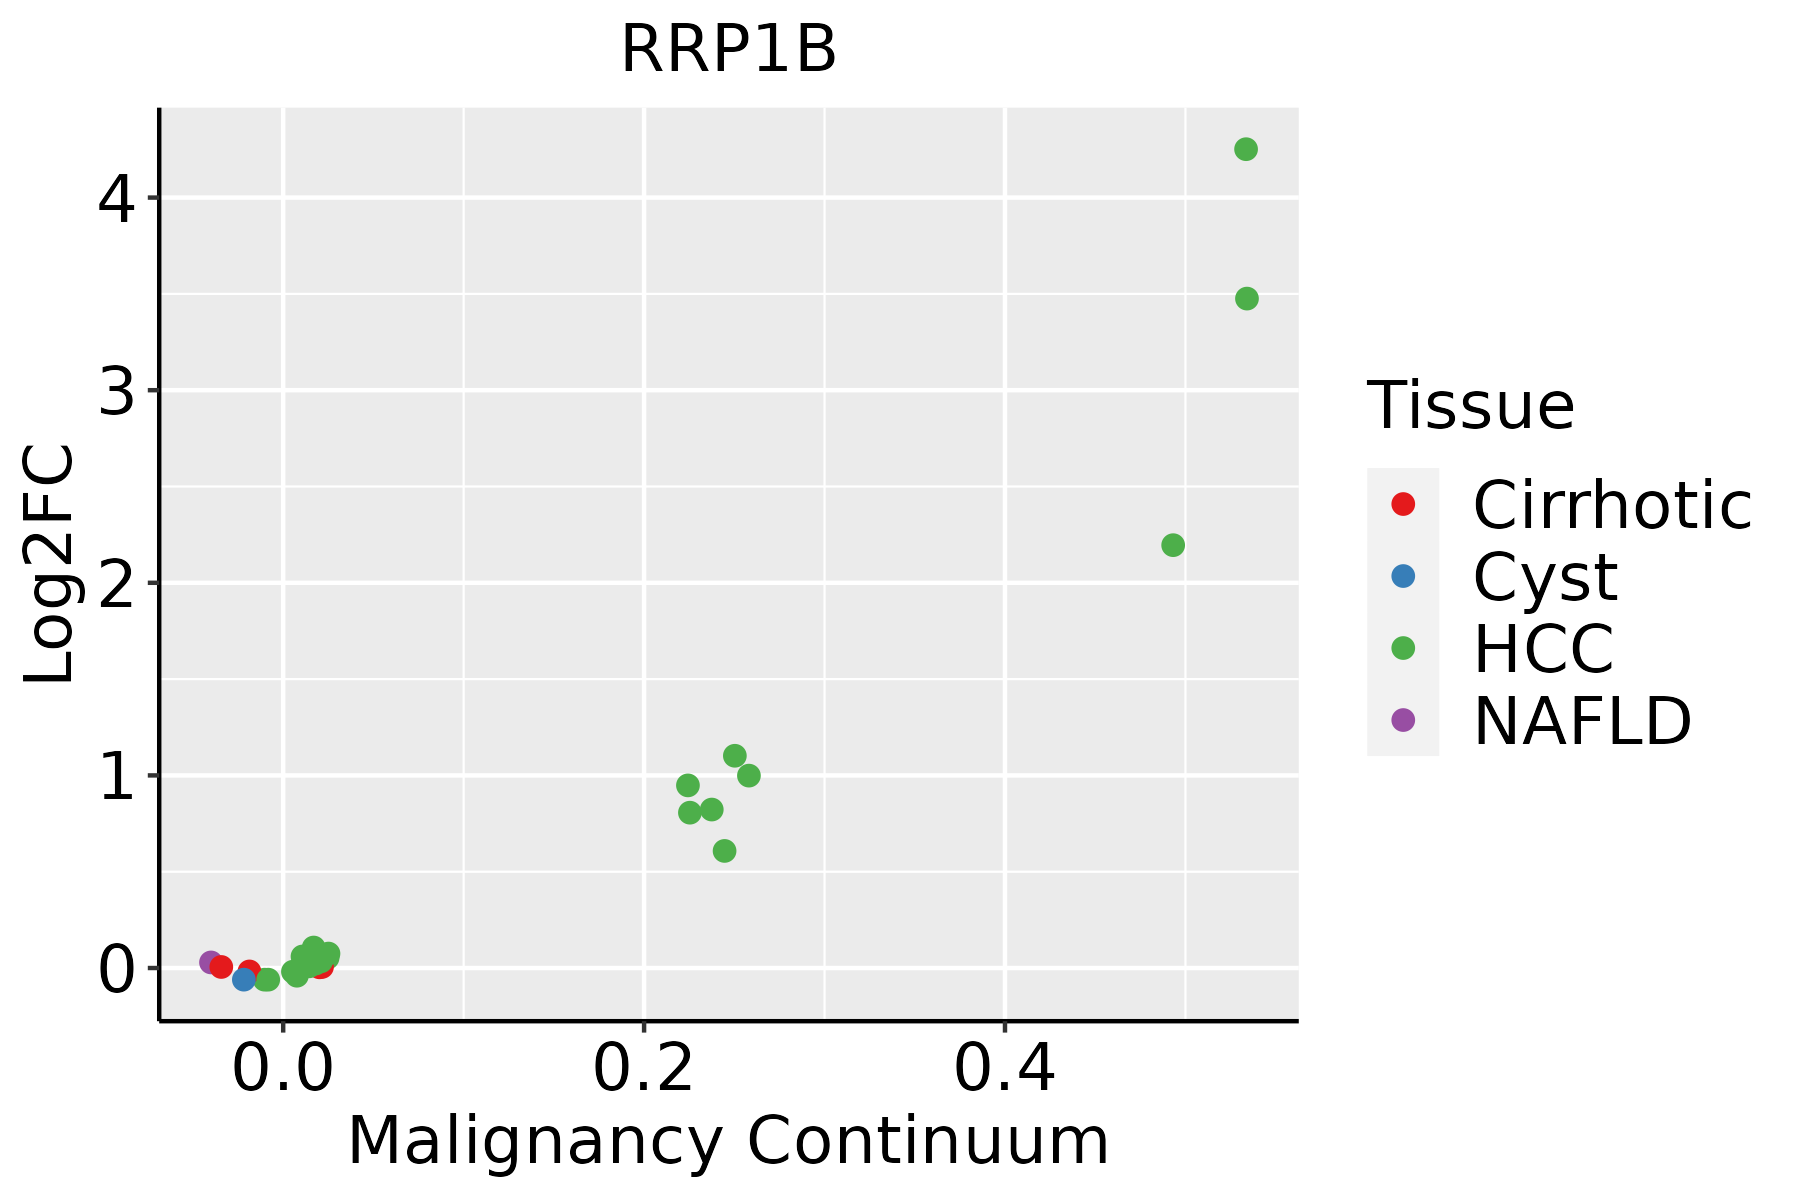
HCC: Hepatocellular carcinoma
NAFLD: Non-alcoholic fatty liver disease
Oral CavityThe image shows the transcriptomic changes along malignancy continuum.log2FC in expression of this searched gene in stem-like cells from each diseased tissue sample relative to stem-like cells in normal samples in each tissue plotted against the malignancy continuum. Samples are colored based on if they are from different disease stage.
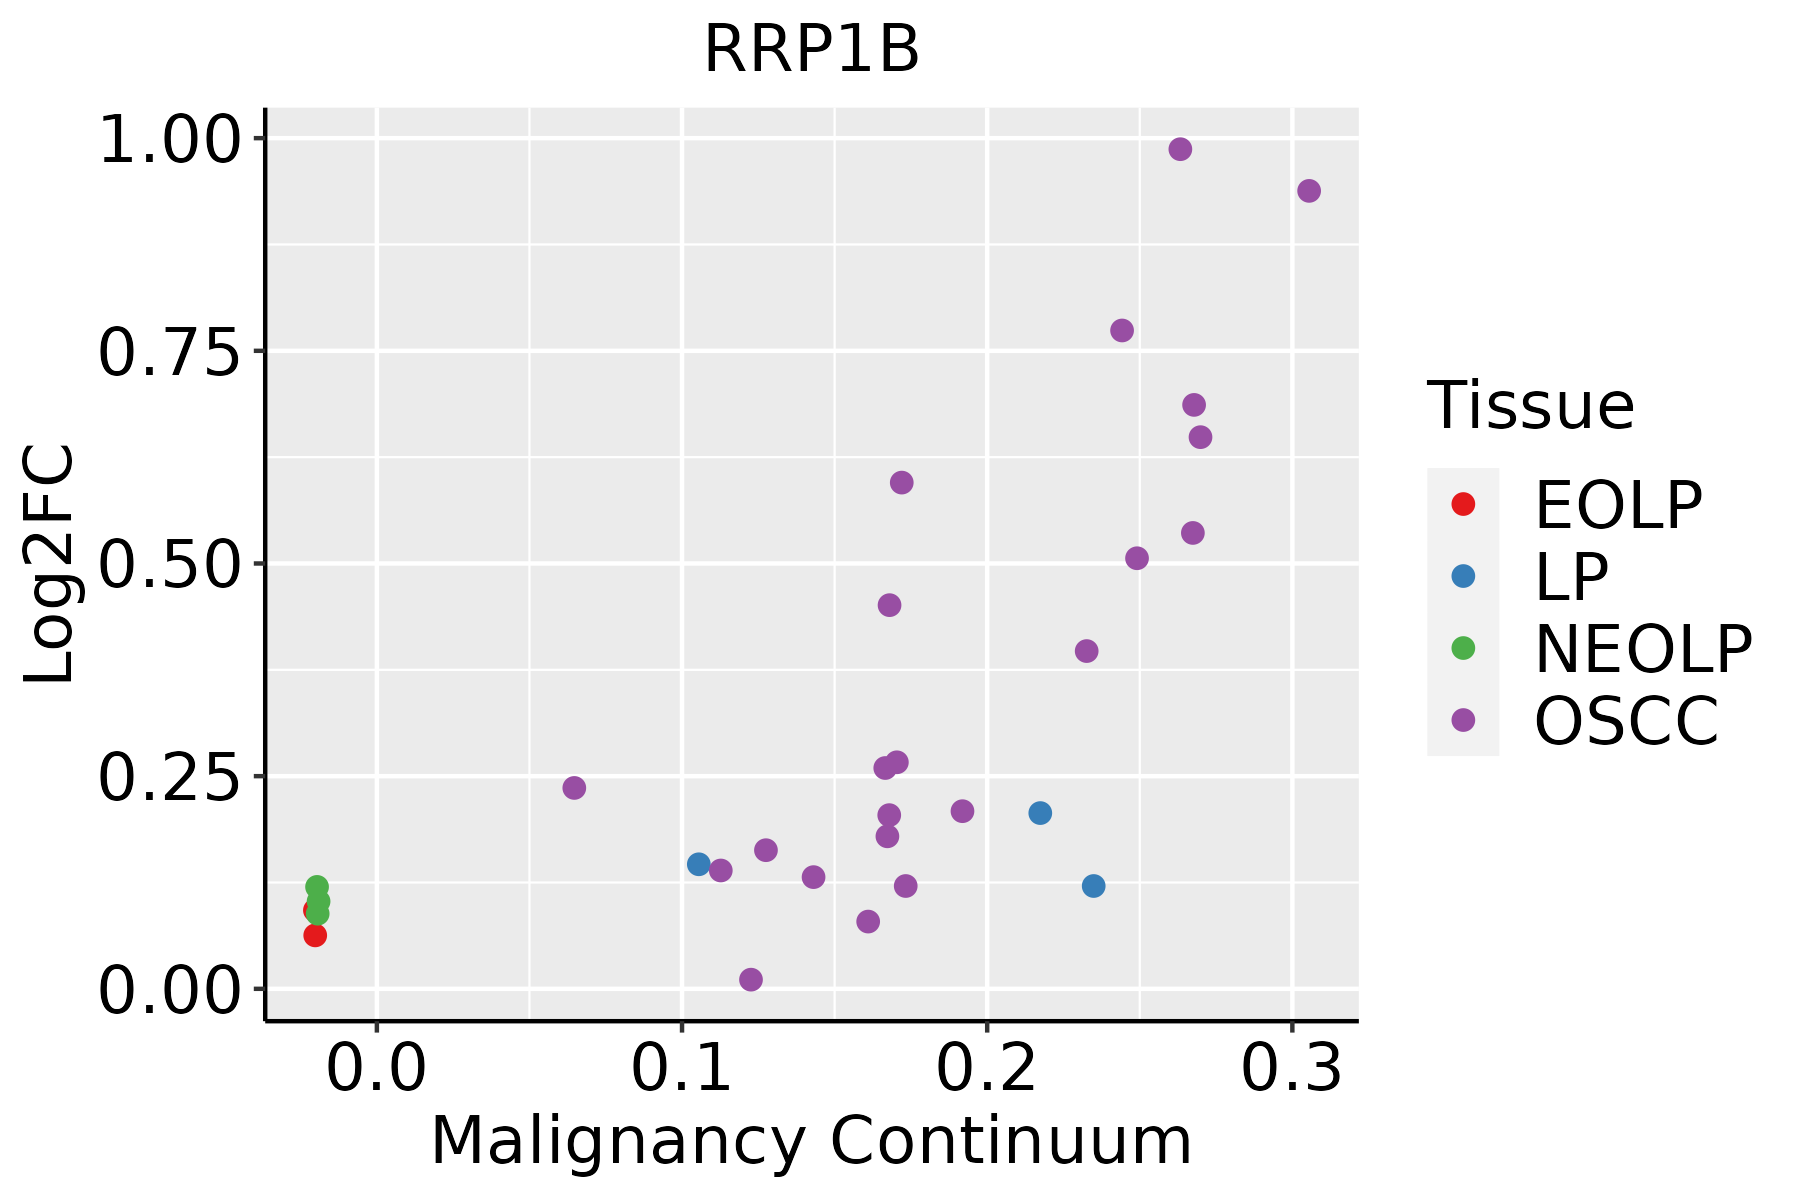
EOLP: Erosive Oral lichen planus
LP: leukoplakia
NEOLP: Non-erosive oral lichen planus
OSCC: Oral squamous cell carcinoma
SkinThe image shows the transcriptomic changes along malignancy continuum.log2FC in expression of this searched gene in stem-like cells from each diseased tissue sample relative to stem-like cells in normal samples in each tissue plotted against the malignancy continuum. Samples are colored based on if they are from different disease stage.
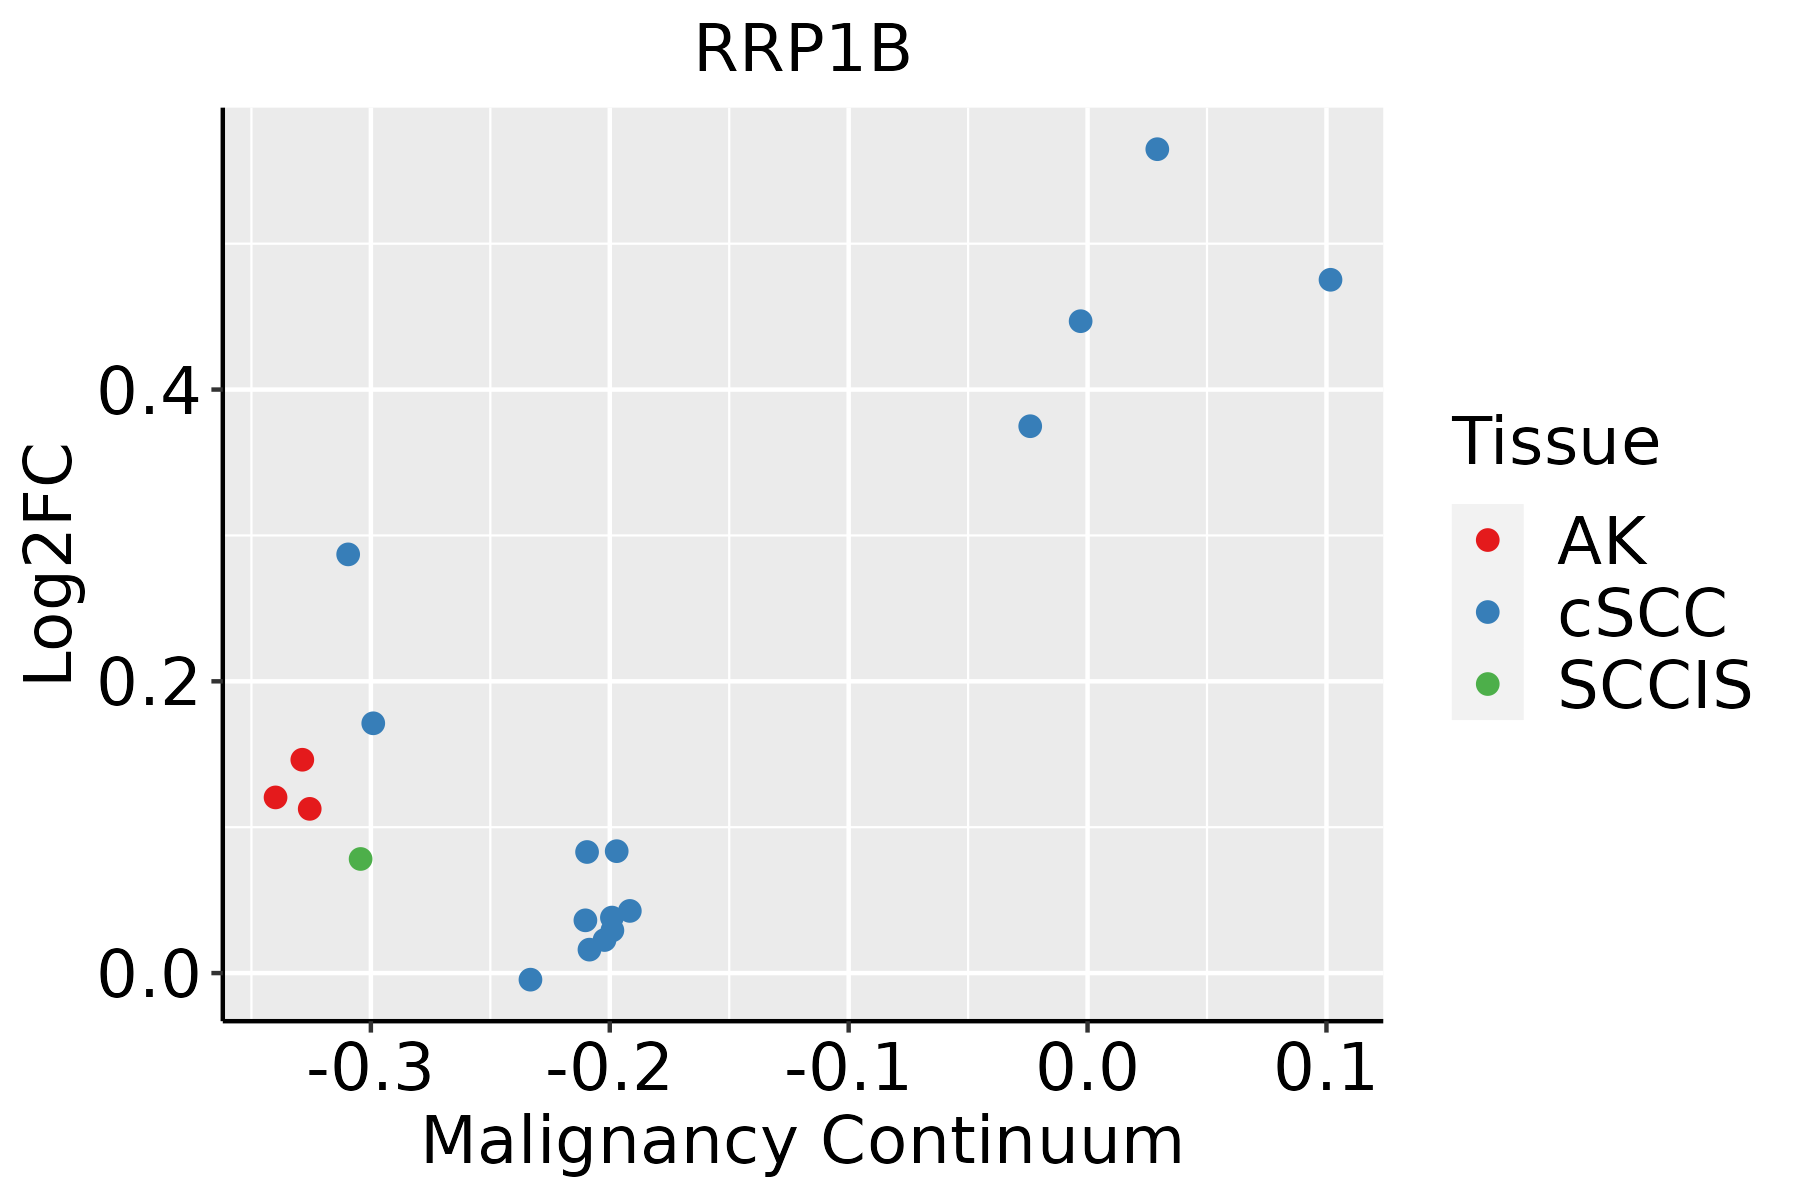
AK: Actinic keratosis
cSCC: Cutaneous squamous cell carcinoma
SCCIS:squamous cell carcinoma in situ
ThyroidThe image shows the transcriptomic changes along malignancy continuum.log2FC in expression of this searched gene in stem-like cells from each diseased tissue sample relative to stem-like cells in normal samples in each tissue plotted against the malignancy continuum. Samples are colored based on if they are from different disease stage.
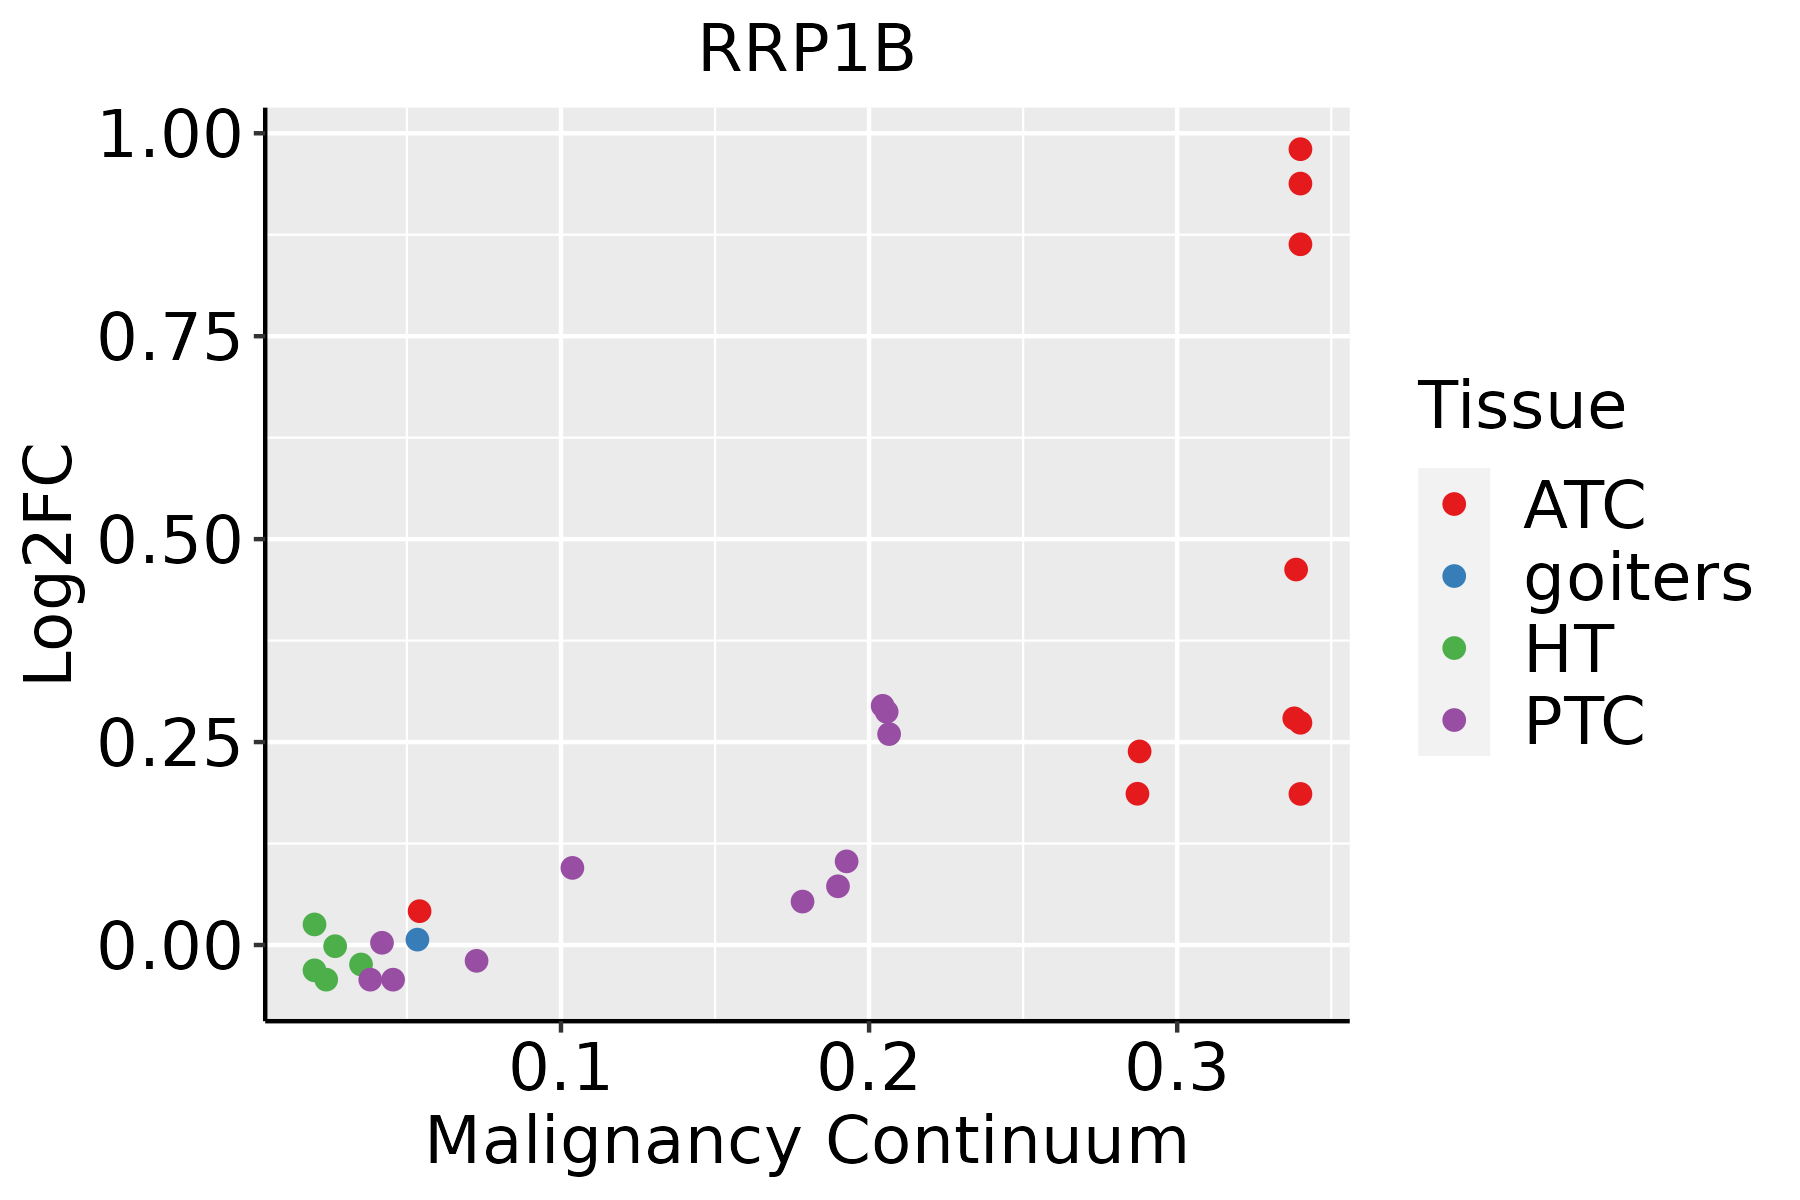
ATC: Anaplastic thyroid cancer
HT: Hashimoto's thyroiditis
PTC: Papillary thyroid cancer
∗log2FC in expression of this searched gene in stem-like cells from each diseased tissue sample relative to stem-like cells in normal samples in each tissue plotted against the malignancy continuum. Samples are colored based on if they are from different disease stage.

Top

Malignant transformation related pathway analysis

check buttonFind out the enriched GO biological processes and KEGG pathways involved in transition from healthy to precancer to cancer
check button Figure of enriched GO biological processes.
TissueDisease StageEnriched GO biological Processes
ColorectumADGO analysis - Figure of enriched GO biological processes: Top 15 enriched GO BP terms are showed in the bar plot of each disease state in each tissue. Each row represents a significant GO biological process which is colored according to the -log10(p.adjust).
ColorectumSERGO analysis - Figure of enriched GO biological processes: Top 15 enriched GO BP terms are showed in the bar plot of each disease state in each tissue. Each row represents a significant GO biological process which is colored according to the -log10(p.adjust).
ColorectumMSSGO analysis - Figure of enriched GO biological processes: Top 15 enriched GO BP terms are showed in the bar plot of each disease state in each tissue. Each row represents a significant GO biological process which is colored according to the -log10(p.adjust).
ColorectumMSI-HGO analysis - Figure of enriched GO biological processes: Top 15 enriched GO BP terms are showed in the bar plot of each disease state in each tissue. Each row represents a significant GO biological process which is colored according to the -log10(p.adjust).
ColorectumFAPGO analysis - Figure of enriched GO biological processes: Top 15 enriched GO BP terms are showed in the bar plot of each disease state in each tissue. Each row represents a significant GO biological process which is colored according to the -log10(p.adjust).
∗Top 15 enriched GO BP terms are showed in the bar plot of each disease state in each tissue. Each row represents a significant GO biological process which is colored according to the -log10(p.adjust).
Page: 1 2 3 4 5 6 7 8 9 

check button Enriched GO biological processes.
GO IDTissueDisease StageDescriptionGene RatioBg Ratiopvaluep.adjustCount
GO:0022613111EsophagusESCCribonucleoprotein complex biogenesis365/8552463/187231.74e-491.11e-45365
GO:0042254111EsophagusESCCribosome biogenesis252/8552299/187233.27e-441.04e-40252
GO:0008380111EsophagusESCCRNA splicing336/8552434/187231.74e-423.67e-39336
GO:003447015EsophagusESCCncRNA processing300/8552395/187233.09e-353.26e-32300
GO:0016072110EsophagusESCCrRNA metabolic process197/8552236/187231.31e-331.18e-30197
GO:0006364110EsophagusESCCrRNA processing189/8552225/187234.88e-333.87e-30189
GO:003466012EsophagusESCCncRNA metabolic process346/8552485/187234.35e-312.51e-28346
GO:0016032111EsophagusESCCviral process301/8552415/187233.34e-291.32e-26301
GO:0043484111EsophagusESCCregulation of RNA splicing116/8552148/187233.18e-162.38e-14116
GO:001908017EsophagusESCCviral gene expression80/855294/187232.04e-151.28e-1380
GO:000961518EsophagusESCCresponse to virus238/8552367/187236.65e-143.32e-12238
GO:0044403111EsophagusESCCbiological process involved in symbiotic interaction186/8552290/187231.43e-104.16e-09186
GO:001908312EsophagusESCCviral transcription41/855250/187231.35e-072.17e-0641
GO:005185115EsophagusESCCmodulation by host of symbiont process43/855260/187234.00e-053.22e-0443
GO:009858613EsophagusESCCcellular response to virus56/855284/187238.20e-056.01e-0456
GO:005181714EsophagusESCCmodulation of process of other organism involved in symbiotic interaction54/855281/187231.09e-047.64e-0454
GO:0051346110EsophagusESCCnegative regulation of hydrolase activity208/8552379/187231.76e-041.14e-03208
GO:00439233EsophagusESCCpositive regulation by host of viral transcription14/855216/187236.78e-043.56e-0314
GO:003582114EsophagusESCCmodulation of process of other organism64/8552106/187231.61e-037.50e-0364
GO:005170214EsophagusESCCbiological process involved in interaction with symbiont57/855294/187232.46e-031.07e-0257
Page: 1 2 3 4 5 6 7 

check button Enriched KEGG pathways.
Pathway IDTissueDisease StageDescriptionGene RatioBg Ratiopvaluep.adjustqvalueCount
Page: 1 

Top

Cell-cell communication analysis

check buttonIdentification of potential cell-cell interactions between two cell types and their ligand-receptor pairs for different disease states
LigandReceptorLRpairPathwayTissueDisease Stage
Page: 1 

Top

Single-cell gene regulatory network inference analysis

check buttonFind out the significant the regulons (TFs) and the target genes of each regulon across cell types for different disease states
TFCell TypeTissueDisease StageTarget GeneRSSRegulon Activity
∗The dot plots of a searched regulon are shown for all cell subpopulations in each disease state of each tissue based on the regulon specific score inferred using pySCENIC and by calculating the average expression.
Page: 1 

Top

Somatic mutation of malignant transformation related genes

check buttonAnnotation of somatic variants for genes involved in malignant transformation
Hugo SymbolVariant ClassVariant ClassificationdbSNP RSHGVScHGVSpHGVSp ShortSWISSPROTBIOTYPESIFTPolyPhenTumor Sample BarcodeTissueHistologySexAgeStageTherapy TypesDrugsOutcome
RRP1BSNVMissense_Mutationc.257A>Gp.Asn86Serp.N86SQ14684protein_codingtolerated(0.09)possibly_damaging(0.752)TCGA-A1-A0SP-01Breastbreast invasive carcinomaFemale<65I/IIChemotherapySD
RRP1BSNVMissense_Mutationc.542N>Ap.Gly181Glup.G181EQ14684protein_codingdeleterious(0)probably_damaging(0.973)TCGA-A7-A6VV-01Breastbreast invasive carcinomaFemale<65I/IIChemotherapycyclophosphamideCR
RRP1BinsertionFrame_Shift_Insnovelc.1501_1502insAAGGCGGTTTTCCAAGTGTTGTGCTGTTTTTGGTGGAp.Gly501GlufsTer23p.G501Efs*23Q14684protein_codingTCGA-A2-A0EX-01Breastbreast invasive carcinomaFemale<65I/IIHormone TherapytamoxiphenSD
RRP1BinsertionNonsense_Mutationnovelc.1647_1648insGTCATAAAGCATTAGCAGAGp.Pro550ValfsTer5p.P550Vfs*5Q14684protein_codingTCGA-A8-A09E-01Breastbreast invasive carcinomaFemale>=65III/IVHormone TherapyanastrozoleSD
RRP1BinsertionFrame_Shift_Insnovelc.1649_1650insCAAAGCTTCAGTCTp.Pro551LysfsTer48p.P551Kfs*48Q14684protein_codingTCGA-A8-A09E-01Breastbreast invasive carcinomaFemale>=65III/IVHormone TherapyanastrozoleSD
RRP1BinsertionFrame_Shift_Insnovelc.2258_2259insCCTGGGACCTGTTAAGAGAAGCTACCTGGTGAGACGTGATCCAAAAAp.Arg753SerfsTer30p.R753Sfs*30Q14684protein_codingTCGA-AN-A0FF-01Breastbreast invasive carcinomaFemale<65I/IIUnknownUnknownSD
RRP1BinsertionIn_Frame_Insnovelc.1529_1530insGTGTCAGCAGCGCTCAGGTTTGGGTGGGAGAAACGGp.Pro510_Arg511insCysGlnGlnArgSerGlyLeuGlyGlyArgAsnGlyp.P510_R511insCQQRSGLGGRNGQ14684protein_codingTCGA-AO-A0JJ-01Breastbreast invasive carcinomaFemale<65I/IIChemotherapycyclophospamideSD
RRP1BSNVMissense_Mutationnovelc.1348N>Ap.Ala450Thrp.A450TQ14684protein_codingtolerated(0.25)possibly_damaging(0.511)TCGA-2W-A8YY-01Cervixcervical & endocervical cancerFemale<65I/IIChemotherapycisplatinCR
RRP1BSNVMissense_Mutationc.860G>Tp.Gly287Valp.G287VQ14684protein_codingtolerated(0.06)benign(0.255)TCGA-IR-A3LK-01Cervixcervical & endocervical cancerFemale>=65I/IIChemotherapycisplatinPD
RRP1BSNVMissense_Mutationc.450N>Cp.Met150Ilep.M150IQ14684protein_codingdeleterious(0.03)possibly_damaging(0.542)TCGA-Q1-A73O-01Cervixcervical & endocervical cancerFemale<65I/IIChemotherapycisplatinCR
Page: 1 2 3 4 5 6 7 

Top

Related drugs of malignant transformation related genes

check buttonIdentification of chemicals and drugs interact with genes involved in malignant transfromation
(DGIdb 4.0)
Entrez IDSymbolCategoryInteraction TypesDrug Claim NameDrug NamePMIDs
23076RRP1BNAatenololATENOLOL31327267
Page: 1