
|
|||||
|
 | |
| |
| |
| |
| |
| |
|
Gene: RRN3 |
Gene summary for RRN3 |
| Gene information | Species | Human | Gene symbol | RRN3 | Gene ID | 54700 |
| Gene name | RRN3 homolog, RNA polymerase I transcription factor | |
| Gene Alias | A-270G1.2 | |
| Cytomap | 16p13.11 | |
| Gene Type | protein-coding | GO ID | GO:0001188 | UniProtAcc | B7ZB55 |
Top |
Malignant transformation analysis |
| Identification of the aberrant gene expression in precancerous and cancerous lesions by comparing the gene expression of stem-like cells in diseased tissues with normal stem cells |
| Entrez ID | Symbol | Replicates | Species | Organ | Tissue | Adj P-value | Log2FC | Malignancy |
| 54700 | RRN3 | LZE4T | Human | Esophagus | ESCC | 2.72e-10 | 3.39e-01 | 0.0811 |
| 54700 | RRN3 | LZE7T | Human | Esophagus | ESCC | 1.13e-08 | 4.60e-01 | 0.0667 |
| 54700 | RRN3 | LZE20T | Human | Esophagus | ESCC | 2.25e-04 | 7.92e-02 | 0.0662 |
| 54700 | RRN3 | LZE24T | Human | Esophagus | ESCC | 7.28e-05 | 1.67e-01 | 0.0596 |
| 54700 | RRN3 | LZE21T | Human | Esophagus | ESCC | 1.84e-05 | 1.36e-01 | 0.0655 |
| 54700 | RRN3 | LZE6T | Human | Esophagus | ESCC | 4.22e-02 | 2.11e-02 | 0.0845 |
| 54700 | RRN3 | P1T-E | Human | Esophagus | ESCC | 1.67e-04 | 1.23e-01 | 0.0875 |
| 54700 | RRN3 | P2T-E | Human | Esophagus | ESCC | 1.82e-23 | 4.59e-01 | 0.1177 |
| 54700 | RRN3 | P4T-E | Human | Esophagus | ESCC | 6.72e-21 | 3.36e-01 | 0.1323 |
| 54700 | RRN3 | P5T-E | Human | Esophagus | ESCC | 3.80e-10 | 2.33e-01 | 0.1327 |
| 54700 | RRN3 | P8T-E | Human | Esophagus | ESCC | 9.89e-23 | 3.07e-01 | 0.0889 |
| 54700 | RRN3 | P9T-E | Human | Esophagus | ESCC | 6.71e-07 | 1.10e-01 | 0.1131 |
| 54700 | RRN3 | P10T-E | Human | Esophagus | ESCC | 5.08e-16 | 2.20e-01 | 0.116 |
| 54700 | RRN3 | P11T-E | Human | Esophagus | ESCC | 2.45e-19 | 4.32e-01 | 0.1426 |
| 54700 | RRN3 | P12T-E | Human | Esophagus | ESCC | 7.67e-34 | 6.58e-01 | 0.1122 |
| 54700 | RRN3 | P15T-E | Human | Esophagus | ESCC | 1.37e-15 | 3.49e-01 | 0.1149 |
| 54700 | RRN3 | P16T-E | Human | Esophagus | ESCC | 1.76e-34 | 6.34e-01 | 0.1153 |
| 54700 | RRN3 | P17T-E | Human | Esophagus | ESCC | 7.62e-04 | 1.20e-01 | 0.1278 |
| 54700 | RRN3 | P20T-E | Human | Esophagus | ESCC | 7.25e-20 | 4.48e-01 | 0.1124 |
| 54700 | RRN3 | P21T-E | Human | Esophagus | ESCC | 5.71e-20 | 2.36e-01 | 0.1617 |
| Page: 1 2 3 4 |
| Tissue | Expression Dynamics | Abbreviation |
| Esophagus | 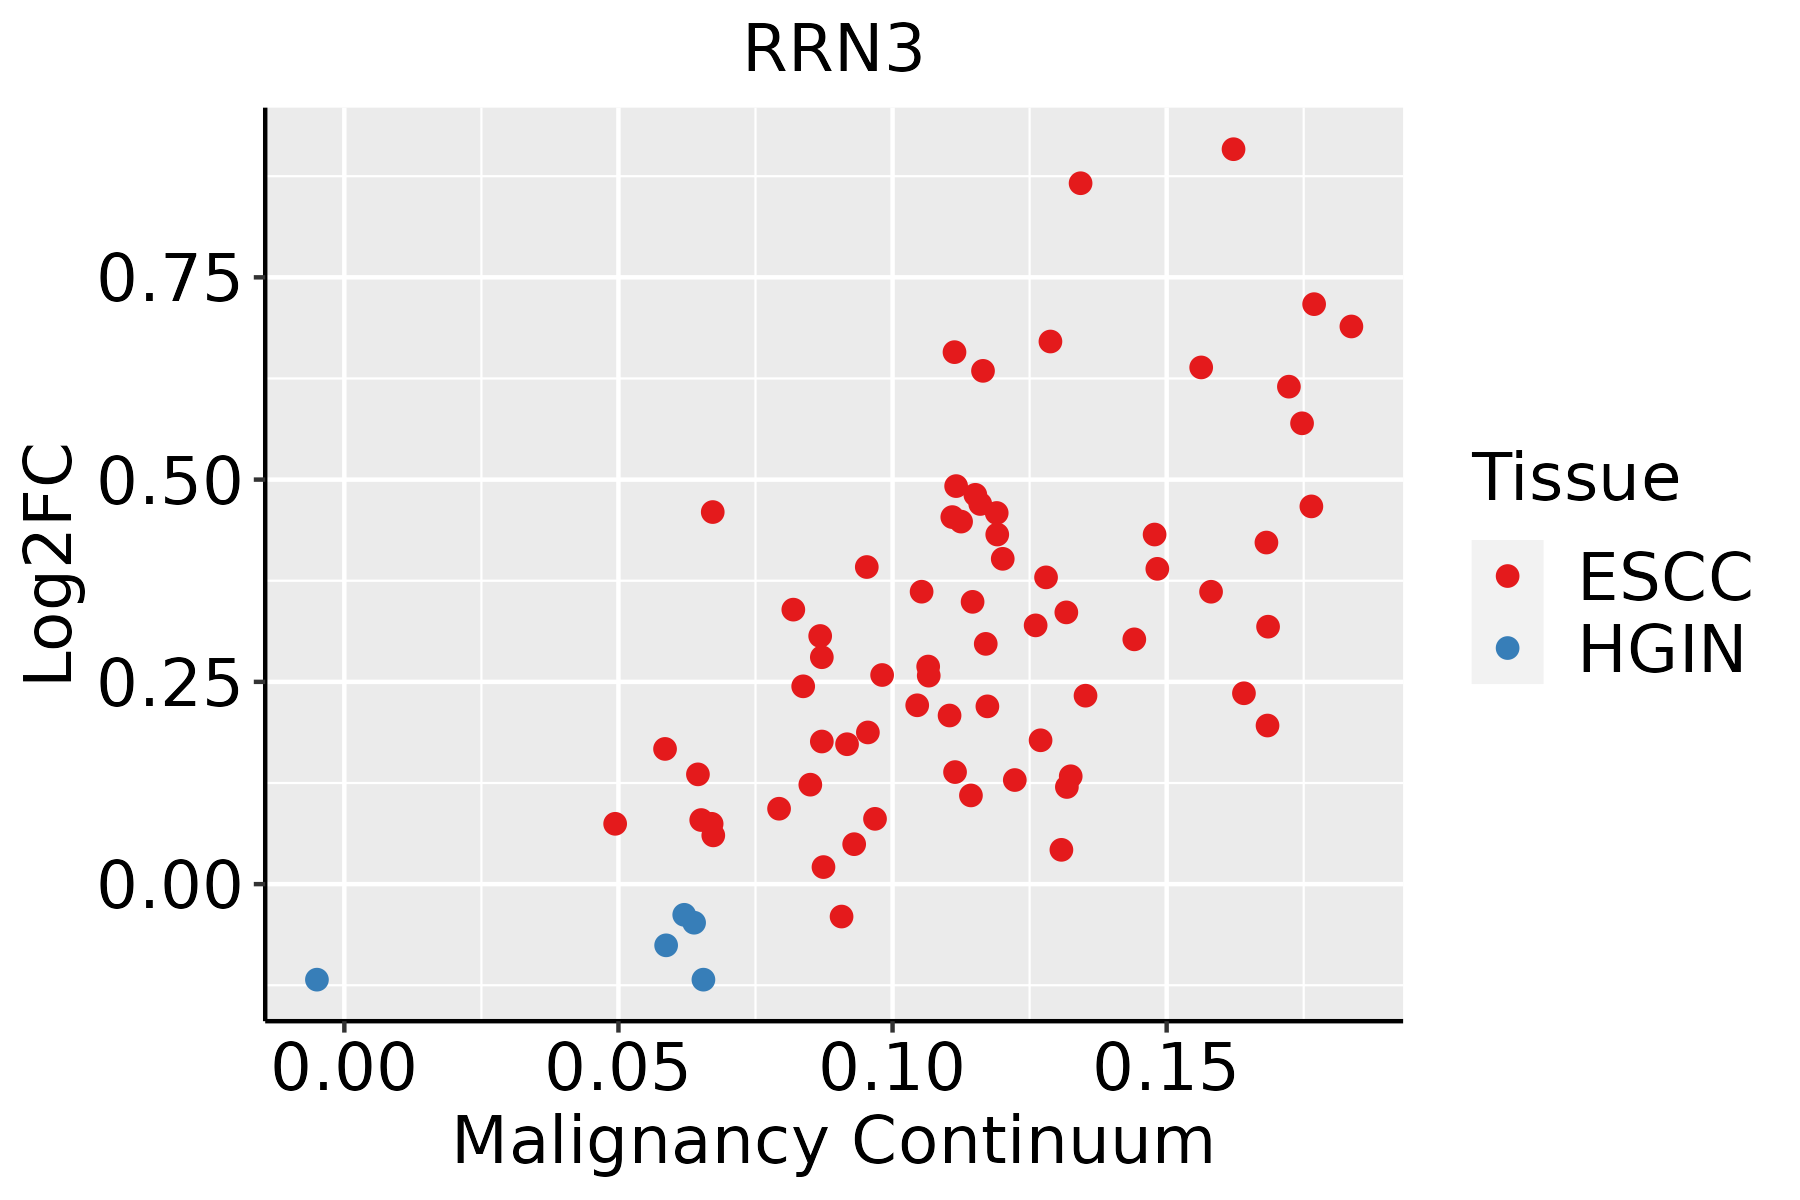 | ESCC: Esophageal squamous cell carcinoma |
| HGIN: High-grade intraepithelial neoplasias | ||
| LGIN: Low-grade intraepithelial neoplasias | ||
| Liver |  | HCC: Hepatocellular carcinoma |
| NAFLD: Non-alcoholic fatty liver disease | ||
| Oral Cavity |  | EOLP: Erosive Oral lichen planus |
| LP: leukoplakia | ||
| NEOLP: Non-erosive oral lichen planus | ||
| OSCC: Oral squamous cell carcinoma |
| ∗log2FC in expression of this searched gene in stem-like cells from each diseased tissue sample relative to stem-like cells in normal samples in each tissue plotted against the malignancy continuum. Samples are colored based on if they are from different disease stage. |
Top |
Malignant transformation related pathway analysis |
| Find out the enriched GO biological processes and KEGG pathways involved in transition from healthy to precancer to cancer |
| Tissue | Disease Stage | Enriched GO biological Processes |
| Colorectum | AD |  |
| Colorectum | SER |  |
| Colorectum | MSS |  |
| Colorectum | MSI-H |  |
| Colorectum | FAP |  |
| ∗Top 15 enriched GO BP terms are showed in the bar plot of each disease state in each tissue. Each row represents a significant GO biological process which is colored according to the -log10(p.adjust). |
| Page: 1 2 3 4 5 6 7 8 9 |
| GO ID | Tissue | Disease Stage | Description | Gene Ratio | Bg Ratio | pvalue | p.adjust | Count |
| GO:000635211 | Esophagus | ESCC | DNA-templated transcription, initiation | 86/8552 | 130/18723 | 1.88e-06 | 2.19e-05 | 86 |
| GO:00063602 | Esophagus | ESCC | transcription by RNA polymerase I | 42/8552 | 55/18723 | 3.41e-06 | 3.78e-05 | 42 |
| GO:00708973 | Esophagus | ESCC | transcription preinitiation complex assembly | 30/8552 | 36/18723 | 3.60e-06 | 3.95e-05 | 30 |
| GO:003134616 | Esophagus | ESCC | positive regulation of cell projection organization | 201/8552 | 353/18723 | 1.19e-05 | 1.11e-04 | 201 |
| GO:001097516 | Esophagus | ESCC | regulation of neuron projection development | 240/8552 | 445/18723 | 2.48e-04 | 1.53e-03 | 240 |
| GO:00063611 | Esophagus | ESCC | transcription initiation from RNA polymerase I promoter | 11/8552 | 13/18723 | 4.76e-03 | 1.85e-02 | 11 |
| GO:00109764 | Esophagus | ESCC | positive regulation of neuron projection development | 91/8552 | 163/18723 | 5.72e-03 | 2.13e-02 | 91 |
| GO:00313465 | Liver | NAFLD | positive regulation of cell projection organization | 57/1882 | 353/18723 | 2.19e-04 | 3.73e-03 | 57 |
| GO:00109755 | Liver | NAFLD | regulation of neuron projection development | 64/1882 | 445/18723 | 2.12e-03 | 2.08e-02 | 64 |
| GO:003134611 | Liver | HCC | positive regulation of cell projection organization | 193/7958 | 353/18723 | 2.28e-06 | 3.08e-05 | 193 |
| GO:0006352 | Liver | HCC | DNA-templated transcription, initiation | 78/7958 | 130/18723 | 4.19e-05 | 4.11e-04 | 78 |
| GO:0006360 | Liver | HCC | transcription by RNA polymerase I | 36/7958 | 55/18723 | 4.94e-04 | 3.23e-03 | 36 |
| GO:00708971 | Liver | HCC | transcription preinitiation complex assembly | 25/7958 | 36/18723 | 9.87e-04 | 5.71e-03 | 25 |
| GO:001097511 | Liver | HCC | regulation of neuron projection development | 220/7958 | 445/18723 | 1.68e-03 | 8.78e-03 | 220 |
| GO:0010976 | Liver | HCC | positive regulation of neuron projection development | 88/7958 | 163/18723 | 1.98e-03 | 1.00e-02 | 88 |
| GO:003134610 | Oral cavity | OSCC | positive regulation of cell projection organization | 176/7305 | 353/18723 | 1.94e-05 | 1.87e-04 | 176 |
| GO:00063522 | Oral cavity | OSCC | DNA-templated transcription, initiation | 74/7305 | 130/18723 | 2.56e-05 | 2.39e-04 | 74 |
| GO:00063601 | Oral cavity | OSCC | transcription by RNA polymerase I | 36/7305 | 55/18723 | 6.42e-05 | 5.22e-04 | 36 |
| GO:001097510 | Oral cavity | OSCC | regulation of neuron projection development | 210/7305 | 445/18723 | 2.35e-04 | 1.52e-03 | 210 |
| GO:00708972 | Oral cavity | OSCC | transcription preinitiation complex assembly | 24/7305 | 36/18723 | 7.18e-04 | 3.95e-03 | 24 |
| Page: 1 2 |
| Pathway ID | Tissue | Disease Stage | Description | Gene Ratio | Bg Ratio | pvalue | p.adjust | qvalue | Count |
| Page: 1 |
Top |
Cell-cell communication analysis |
| Identification of potential cell-cell interactions between two cell types and their ligand-receptor pairs for different disease states |
| Ligand | Receptor | LRpair | Pathway | Tissue | Disease Stage |
| Page: 1 |
Top |
Single-cell gene regulatory network inference analysis |
| Find out the significant the regulons (TFs) and the target genes of each regulon across cell types for different disease states |
| TF | Cell Type | Tissue | Disease Stage | Target Gene | RSS | Regulon Activity |
| ∗The dot plots of a searched regulon are shown for all cell subpopulations in each disease state of each tissue based on the regulon specific score inferred using pySCENIC and by calculating the average expression. |
| Page: 1 |
Top |
Somatic mutation of malignant transformation related genes |
| Annotation of somatic variants for genes involved in malignant transformation |
| Hugo Symbol | Variant Class | Variant Classification | dbSNP RS | HGVSc | HGVSp | HGVSp Short | SWISSPROT | BIOTYPE | SIFT | PolyPhen | Tumor Sample Barcode | Tissue | Histology | Sex | Age | Stage | Therapy Types | Drugs | Outcome |
| RRN3 | SNV | Missense_Mutation | c.1623N>C | p.Arg541Ser | p.R541S | Q9NYV6 | protein_coding | tolerated(0.27) | probably_damaging(0.999) | TCGA-AC-A23H-01 | Breast | breast invasive carcinoma | Female | >=65 | I/II | Unknown | Unknown | PD | |
| RRN3 | SNV | Missense_Mutation | c.667N>C | p.Glu223Gln | p.E223Q | Q9NYV6 | protein_coding | tolerated(0.07) | benign(0.146) | TCGA-AN-A0FL-01 | Breast | breast invasive carcinoma | Female | <65 | I/II | Unknown | Unknown | SD | |
| RRN3 | SNV | Missense_Mutation | novel | c.376G>C | p.Val126Leu | p.V126L | Q9NYV6 | protein_coding | tolerated(0.09) | benign(0.149) | TCGA-AR-A1AO-01 | Breast | breast invasive carcinoma | Female | <65 | I/II | Chemotherapy | doxorubicin | SD |
| RRN3 | SNV | Missense_Mutation | c.1176N>A | p.Asp392Glu | p.D392E | Q9NYV6 | protein_coding | deleterious(0.01) | benign(0.197) | TCGA-E2-A1L7-01 | Breast | breast invasive carcinoma | Female | <65 | III/IV | Chemotherapy | cyclophosphamide | PD | |
| RRN3 | insertion | In_Frame_Ins | novel | c.1889_1890insGGTTCTGTATAATGTTCATCATTC | p.His630delinsGlnValLeuTyrAsnValHisHisSer | p.H630delinsQVLYNVHHS | Q9NYV6 | protein_coding | TCGA-AN-A0FN-01 | Breast | breast invasive carcinoma | Female | <65 | I/II | Unknown | Unknown | SD | ||
| RRN3 | SNV | Missense_Mutation | rs757080127 | c.1664C>T | p.Pro555Leu | p.P555L | Q9NYV6 | protein_coding | deleterious(0.01) | probably_damaging(1) | TCGA-2W-A8YY-01 | Cervix | cervical & endocervical cancer | Female | <65 | I/II | Chemotherapy | cisplatin | CR |
| RRN3 | SNV | Missense_Mutation | novel | c.871N>C | p.Glu291Gln | p.E291Q | Q9NYV6 | protein_coding | tolerated(0.31) | benign(0.031) | TCGA-R2-A69V-01 | Cervix | cervical & endocervical cancer | Female | <65 | I/II | Chemotherapy | cisplatin | SD |
| RRN3 | SNV | Missense_Mutation | novel | c.636N>A | p.Phe212Leu | p.F212L | Q9NYV6 | protein_coding | deleterious(0.01) | probably_damaging(0.997) | TCGA-AA-A00N-01 | Colorectum | colon adenocarcinoma | Male | >=65 | I/II | Unknown | Unknown | PD |
| RRN3 | SNV | Missense_Mutation | c.316N>G | p.Phe106Val | p.F106V | Q9NYV6 | protein_coding | tolerated(0.25) | benign(0.248) | TCGA-AA-A010-01 | Colorectum | colon adenocarcinoma | Female | <65 | I/II | Chemotherapy | folinic | CR | |
| RRN3 | SNV | Missense_Mutation | novel | c.377N>G | p.Val126Gly | p.V126G | Q9NYV6 | protein_coding | deleterious(0) | probably_damaging(0.97) | TCGA-AM-5820-01 | Colorectum | colon adenocarcinoma | Female | <65 | I/II | Unknown | Unknown | SD |
| Page: 1 2 3 4 5 |
Top |
Related drugs of malignant transformation related genes |
| Identification of chemicals and drugs interact with genes involved in malignant transfromation |
| (DGIdb 4.0) |
| Entrez ID | Symbol | Category | Interaction Types | Drug Claim Name | Drug Name | PMIDs |
| Page: 1 |

Copyright 2023-Present -The University of Texas Health Science Center at Houston |