
|
|||||
|
 | |
| |
| |
| |
| |
| |
|
Gene: RRM2 |
Gene summary for RRM2 |
| Gene information | Species | Human | Gene symbol | RRM2 | Gene ID | 6241 |
| Gene name | ribonucleotide reductase regulatory subunit M2 | |
| Gene Alias | C2orf48 | |
| Cytomap | 2p25.1 | |
| Gene Type | protein-coding | GO ID | GO:0001701 | UniProtAcc | P31350 |
Top |
Malignant transformation analysis |
| Identification of the aberrant gene expression in precancerous and cancerous lesions by comparing the gene expression of stem-like cells in diseased tissues with normal stem cells |
| Entrez ID | Symbol | Replicates | Species | Organ | Tissue | Adj P-value | Log2FC | Malignancy |
| 6241 | RRM2 | LZE21T | Human | Esophagus | ESCC | 1.12e-03 | 1.03e+00 | 0.0655 |
| 6241 | RRM2 | LZE6T | Human | Esophagus | ESCC | 3.72e-13 | 7.89e-01 | 0.0845 |
| 6241 | RRM2 | P2T-E | Human | Esophagus | ESCC | 3.06e-06 | 9.11e-01 | 0.1177 |
| 6241 | RRM2 | P4T-E | Human | Esophagus | ESCC | 5.55e-13 | 5.54e-01 | 0.1323 |
| 6241 | RRM2 | P5T-E | Human | Esophagus | ESCC | 2.15e-23 | 8.75e-01 | 0.1327 |
| 6241 | RRM2 | P10T-E | Human | Esophagus | ESCC | 2.39e-03 | 5.61e-01 | 0.116 |
| 6241 | RRM2 | P17T-E | Human | Esophagus | ESCC | 6.68e-05 | 4.06e-01 | 0.1278 |
| 6241 | RRM2 | P19T-E | Human | Esophagus | ESCC | 4.41e-04 | 7.54e-01 | 0.1662 |
| 6241 | RRM2 | P20T-E | Human | Esophagus | ESCC | 2.53e-03 | 4.52e-01 | 0.1124 |
| 6241 | RRM2 | P21T-E | Human | Esophagus | ESCC | 9.69e-08 | 5.80e-01 | 0.1617 |
| 6241 | RRM2 | P24T-E | Human | Esophagus | ESCC | 1.13e-18 | 8.73e-01 | 0.1287 |
| 6241 | RRM2 | P28T-E | Human | Esophagus | ESCC | 1.85e-11 | 5.91e-01 | 0.1149 |
| 6241 | RRM2 | P30T-E | Human | Esophagus | ESCC | 2.17e-05 | 1.41e+00 | 0.137 |
| 6241 | RRM2 | P31T-E | Human | Esophagus | ESCC | 1.01e-07 | 6.69e-01 | 0.1251 |
| 6241 | RRM2 | P32T-E | Human | Esophagus | ESCC | 2.96e-24 | 1.16e+00 | 0.1666 |
| 6241 | RRM2 | P36T-E | Human | Esophagus | ESCC | 1.26e-04 | 6.94e-01 | 0.1187 |
| 6241 | RRM2 | P37T-E | Human | Esophagus | ESCC | 3.76e-17 | 6.45e-01 | 0.1371 |
| 6241 | RRM2 | P38T-E | Human | Esophagus | ESCC | 2.95e-07 | 5.99e-01 | 0.127 |
| 6241 | RRM2 | P40T-E | Human | Esophagus | ESCC | 4.84e-02 | 3.17e-01 | 0.109 |
| 6241 | RRM2 | P42T-E | Human | Esophagus | ESCC | 1.19e-03 | 3.93e-01 | 0.1175 |
| Page: 1 2 3 |
| Tissue | Expression Dynamics | Abbreviation |
| Esophagus | 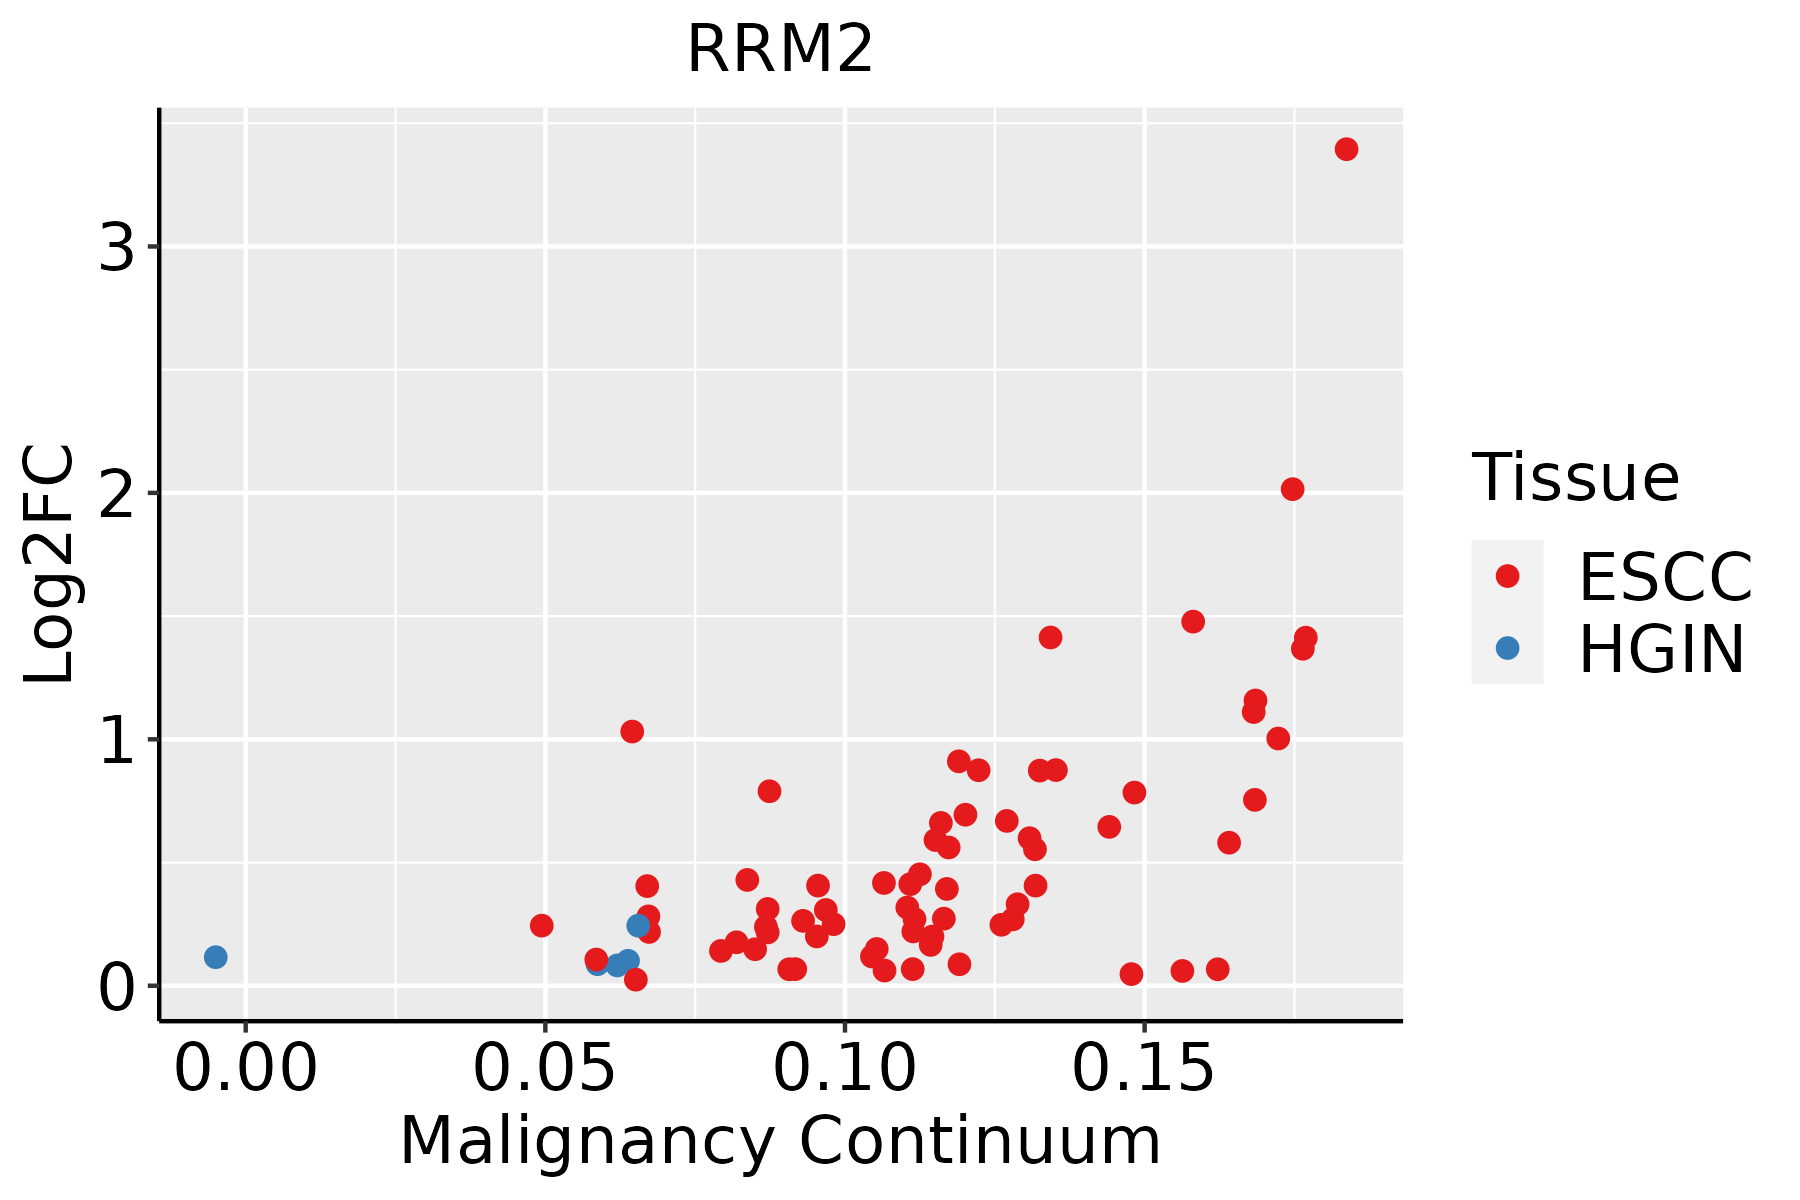 | ESCC: Esophageal squamous cell carcinoma |
| HGIN: High-grade intraepithelial neoplasias | ||
| LGIN: Low-grade intraepithelial neoplasias | ||
| Oral Cavity |  | EOLP: Erosive Oral lichen planus |
| LP: leukoplakia | ||
| NEOLP: Non-erosive oral lichen planus | ||
| OSCC: Oral squamous cell carcinoma | ||
| Skin | 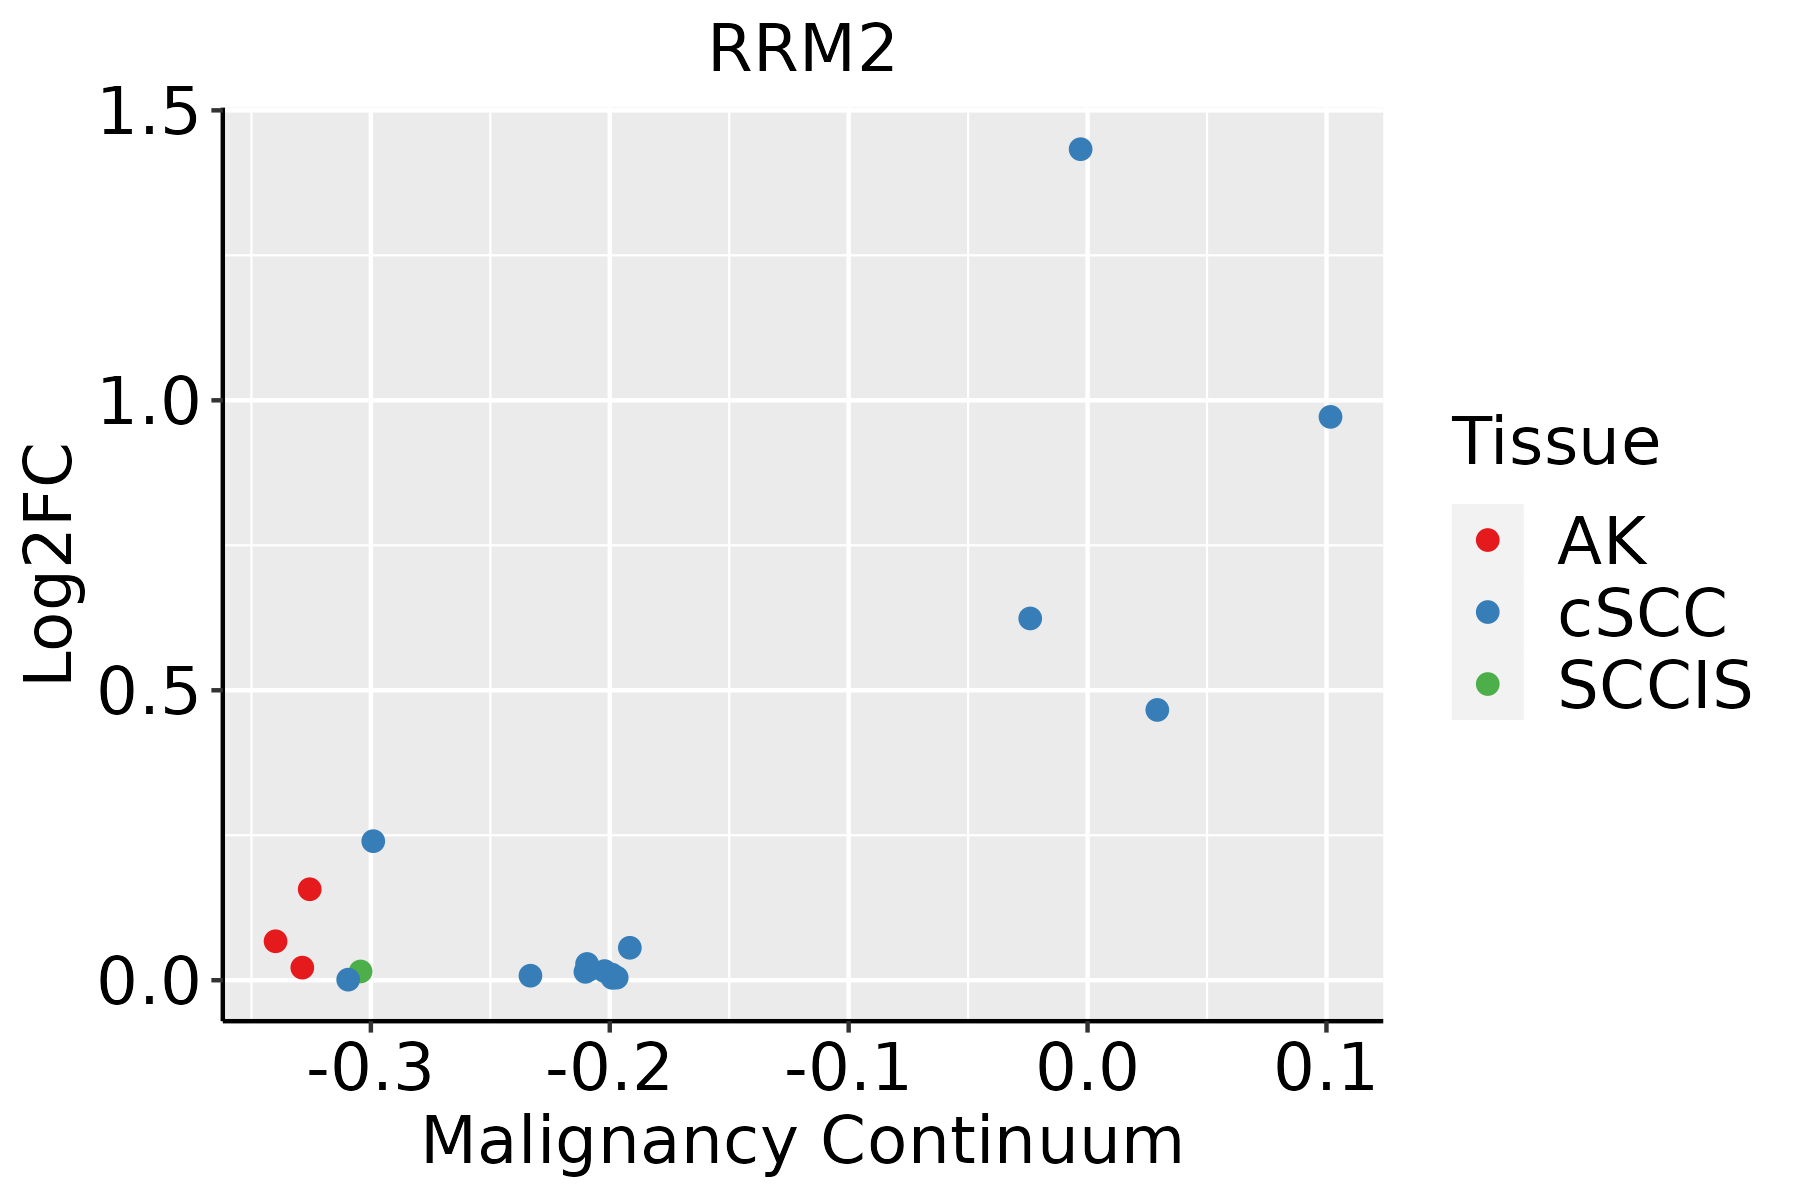 | AK: Actinic keratosis |
| cSCC: Cutaneous squamous cell carcinoma | ||
| SCCIS:squamous cell carcinoma in situ | ||
| Thyroid |  | ATC: Anaplastic thyroid cancer |
| HT: Hashimoto's thyroiditis | ||
| PTC: Papillary thyroid cancer |
| ∗log2FC in expression of this searched gene in stem-like cells from each diseased tissue sample relative to stem-like cells in normal samples in each tissue plotted against the malignancy continuum. Samples are colored based on if they are from different disease stage. |
Top |
Malignant transformation related pathway analysis |
| Find out the enriched GO biological processes and KEGG pathways involved in transition from healthy to precancer to cancer |
| Tissue | Disease Stage | Enriched GO biological Processes |
| Colorectum | AD |  |
| Colorectum | SER |  |
| Colorectum | MSS |  |
| Colorectum | MSI-H |  |
| Colorectum | FAP |  |
| ∗Top 15 enriched GO BP terms are showed in the bar plot of each disease state in each tissue. Each row represents a significant GO biological process which is colored according to the -log10(p.adjust). |
| Page: 1 2 3 4 5 6 7 8 9 |
| GO ID | Tissue | Disease Stage | Description | Gene Ratio | Bg Ratio | pvalue | p.adjust | Count |
| GO:0008380 | Colorectum | AD | RNA splicing | 169/3918 | 434/18723 | 3.59e-18 | 2.04e-15 | 169 |
| GO:0000377 | Colorectum | AD | RNA splicing, via transesterification reactions with bulged adenosine as nucleophile | 130/3918 | 320/18723 | 5.88e-16 | 2.16e-13 | 130 |
| GO:0000398 | Colorectum | AD | mRNA splicing, via spliceosome | 130/3918 | 320/18723 | 5.88e-16 | 2.16e-13 | 130 |
| GO:0000375 | Colorectum | AD | RNA splicing, via transesterification reactions | 131/3918 | 324/18723 | 7.11e-16 | 2.22e-13 | 131 |
| GO:00083802 | Colorectum | MSS | RNA splicing | 159/3467 | 434/18723 | 1.75e-19 | 1.22e-16 | 159 |
| GO:00003772 | Colorectum | MSS | RNA splicing, via transesterification reactions with bulged adenosine as nucleophile | 121/3467 | 320/18723 | 2.52e-16 | 8.27e-14 | 121 |
| GO:00003982 | Colorectum | MSS | mRNA splicing, via spliceosome | 121/3467 | 320/18723 | 2.52e-16 | 8.27e-14 | 121 |
| GO:00003752 | Colorectum | MSS | RNA splicing, via transesterification reactions | 122/3467 | 324/18723 | 2.75e-16 | 8.58e-14 | 122 |
| GO:00083804 | Colorectum | FAP | RNA splicing | 108/2622 | 434/18723 | 7.90e-10 | 1.86e-07 | 108 |
| GO:00003754 | Colorectum | FAP | RNA splicing, via transesterification reactions | 84/2622 | 324/18723 | 8.06e-09 | 1.10e-06 | 84 |
| GO:00003774 | Colorectum | FAP | RNA splicing, via transesterification reactions with bulged adenosine as nucleophile | 83/2622 | 320/18723 | 9.66e-09 | 1.23e-06 | 83 |
| GO:00003984 | Colorectum | FAP | mRNA splicing, via spliceosome | 83/2622 | 320/18723 | 9.66e-09 | 1.23e-06 | 83 |
| GO:00083805 | Colorectum | CRC | RNA splicing | 90/2078 | 434/18723 | 2.80e-09 | 7.97e-07 | 90 |
| GO:00003775 | Colorectum | CRC | RNA splicing, via transesterification reactions with bulged adenosine as nucleophile | 66/2078 | 320/18723 | 4.39e-07 | 3.37e-05 | 66 |
| GO:00003985 | Colorectum | CRC | mRNA splicing, via spliceosome | 66/2078 | 320/18723 | 4.39e-07 | 3.37e-05 | 66 |
| GO:00003755 | Colorectum | CRC | RNA splicing, via transesterification reactions | 66/2078 | 324/18723 | 7.00e-07 | 4.61e-05 | 66 |
| GO:000838016 | Endometrium | AEH | RNA splicing | 111/2100 | 434/18723 | 2.42e-17 | 1.12e-14 | 111 |
| GO:000037515 | Endometrium | AEH | RNA splicing, via transesterification reactions | 88/2100 | 324/18723 | 1.11e-15 | 3.91e-13 | 88 |
| GO:000037715 | Endometrium | AEH | RNA splicing, via transesterification reactions with bulged adenosine as nucleophile | 87/2100 | 320/18723 | 1.51e-15 | 4.78e-13 | 87 |
| GO:000039815 | Endometrium | AEH | mRNA splicing, via spliceosome | 87/2100 | 320/18723 | 1.51e-15 | 4.78e-13 | 87 |
| Page: 1 2 3 4 5 6 7 8 9 10 11 |
| Pathway ID | Tissue | Disease Stage | Description | Gene Ratio | Bg Ratio | pvalue | p.adjust | qvalue | Count |
| hsa0048018 | Esophagus | ESCC | Glutathione metabolism | 44/4205 | 57/8465 | 1.81e-05 | 9.03e-05 | 4.63e-05 | 44 |
| hsa012325 | Esophagus | ESCC | Nucleotide metabolism | 59/4205 | 85/8465 | 1.67e-04 | 6.58e-04 | 3.37e-04 | 59 |
| hsa002405 | Esophagus | ESCC | Pyrimidine metabolism | 41/4205 | 58/8465 | 9.14e-04 | 2.92e-03 | 1.49e-03 | 41 |
| hsa0048019 | Esophagus | ESCC | Glutathione metabolism | 44/4205 | 57/8465 | 1.81e-05 | 9.03e-05 | 4.63e-05 | 44 |
| hsa0123212 | Esophagus | ESCC | Nucleotide metabolism | 59/4205 | 85/8465 | 1.67e-04 | 6.58e-04 | 3.37e-04 | 59 |
| hsa0024012 | Esophagus | ESCC | Pyrimidine metabolism | 41/4205 | 58/8465 | 9.14e-04 | 2.92e-03 | 1.49e-03 | 41 |
| hsa041159 | Oral cavity | OSCC | p53 signaling pathway | 57/3704 | 74/8465 | 4.99e-09 | 5.07e-08 | 2.58e-08 | 57 |
| hsa012324 | Oral cavity | OSCC | Nucleotide metabolism | 54/3704 | 85/8465 | 1.78e-04 | 5.95e-04 | 3.03e-04 | 54 |
| hsa002404 | Oral cavity | OSCC | Pyrimidine metabolism | 37/3704 | 58/8465 | 1.62e-03 | 4.45e-03 | 2.26e-03 | 37 |
| hsa0048016 | Oral cavity | OSCC | Glutathione metabolism | 36/3704 | 57/8465 | 2.41e-03 | 6.41e-03 | 3.26e-03 | 36 |
| hsa0411514 | Oral cavity | OSCC | p53 signaling pathway | 57/3704 | 74/8465 | 4.99e-09 | 5.07e-08 | 2.58e-08 | 57 |
| hsa0123211 | Oral cavity | OSCC | Nucleotide metabolism | 54/3704 | 85/8465 | 1.78e-04 | 5.95e-04 | 3.03e-04 | 54 |
| hsa0024011 | Oral cavity | OSCC | Pyrimidine metabolism | 37/3704 | 58/8465 | 1.62e-03 | 4.45e-03 | 2.26e-03 | 37 |
| hsa0048017 | Oral cavity | OSCC | Glutathione metabolism | 36/3704 | 57/8465 | 2.41e-03 | 6.41e-03 | 3.26e-03 | 36 |
| Page: 1 |
Top |
Cell-cell communication analysis |
| Identification of potential cell-cell interactions between two cell types and their ligand-receptor pairs for different disease states |
| Ligand | Receptor | LRpair | Pathway | Tissue | Disease Stage |
| Page: 1 |
Top |
Single-cell gene regulatory network inference analysis |
| Find out the significant the regulons (TFs) and the target genes of each regulon across cell types for different disease states |
| TF | Cell Type | Tissue | Disease Stage | Target Gene | RSS | Regulon Activity |
| ∗The dot plots of a searched regulon are shown for all cell subpopulations in each disease state of each tissue based on the regulon specific score inferred using pySCENIC and by calculating the average expression. |
| Page: 1 |
Top |
Somatic mutation of malignant transformation related genes |
| Annotation of somatic variants for genes involved in malignant transformation |
| Hugo Symbol | Variant Class | Variant Classification | dbSNP RS | HGVSc | HGVSp | HGVSp Short | SWISSPROT | BIOTYPE | SIFT | PolyPhen | Tumor Sample Barcode | Tissue | Histology | Sex | Age | Stage | Therapy Types | Drugs | Outcome |
| RRM2 | SNV | Missense_Mutation | c.1125N>A | p.Met375Ile | p.M375I | P31350 | protein_coding | deleterious_low_confidence(0.03) | benign(0.04) | TCGA-A2-A25A-01 | Breast | breast invasive carcinoma | Female | <65 | I/II | Unspecific | Cytoxan | SD | |
| RRM2 | SNV | Missense_Mutation | c.527N>T | p.Trp176Leu | p.W176L | P31350 | protein_coding | deleterious_low_confidence(0) | probably_damaging(0.942) | TCGA-AN-A0AK-01 | Breast | breast invasive carcinoma | Female | >=65 | I/II | Unknown | Unknown | SD | |
| RRM2 | SNV | Missense_Mutation | novel | c.757N>T | p.Leu253Phe | p.L253F | P31350 | protein_coding | deleterious_low_confidence(0) | probably_damaging(0.981) | TCGA-VS-A8EL-01 | Cervix | cervical & endocervical cancer | Female | <65 | I/II | Chemotherapy | cisplatin | CR |
| RRM2 | SNV | Missense_Mutation | c.166N>T | p.Arg56Cys | p.R56C | P31350 | protein_coding | tolerated_low_confidence(0.12) | benign(0.262) | TCGA-VS-A958-01 | Cervix | cervical & endocervical cancer | Female | <65 | I/II | Chemotherapy | cisplatin | CR | |
| RRM2 | SNV | Missense_Mutation | c.500N>C | p.Val167Ala | p.V167A | P31350 | protein_coding | deleterious_low_confidence(0) | probably_damaging(0.948) | TCGA-A6-5665-01 | Colorectum | colon adenocarcinoma | Female | >=65 | I/II | Unknown | Unknown | PD | |
| RRM2 | SNV | Missense_Mutation | c.682N>G | p.Met228Val | p.M228V | P31350 | protein_coding | deleterious_low_confidence(0.05) | benign(0.046) | TCGA-AA-3715-01 | Colorectum | colon adenocarcinoma | Male | >=65 | I/II | Unknown | Unknown | PD | |
| RRM2 | SNV | Missense_Mutation | novel | c.993T>G | p.Asp331Glu | p.D331E | P31350 | protein_coding | deleterious_low_confidence(0.04) | probably_damaging(0.99) | TCGA-AA-A00N-01 | Colorectum | colon adenocarcinoma | Male | >=65 | I/II | Unknown | Unknown | PD |
| RRM2 | SNV | Missense_Mutation | c.1288C>A | p.Gln430Lys | p.Q430K | P31350 | protein_coding | deleterious_low_confidence(0.02) | probably_damaging(0.992) | TCGA-AA-A00O-01 | Colorectum | colon adenocarcinoma | Female | >=65 | III/IV | Unknown | Unknown | SD | |
| RRM2 | deletion | Frame_Shift_Del | c.371delN | p.Gly126AlafsTer8 | p.G126Afs*8 | P31350 | protein_coding | TCGA-AA-3811-01 | Colorectum | colon adenocarcinoma | Female | >=65 | III/IV | Unknown | Unknown | PD | |||
| RRM2 | SNV | Missense_Mutation | novel | c.547N>A | p.Glu183Lys | p.E183K | P31350 | protein_coding | deleterious_low_confidence(0) | probably_damaging(0.989) | TCGA-A5-A0G2-01 | Endometrium | uterine corpus endometrioid carcinoma | Female | <65 | III/IV | Unknown | Unknown | SD |
| Page: 1 2 3 4 |
Top |
Related drugs of malignant transformation related genes |
| Identification of chemicals and drugs interact with genes involved in malignant transfromation |
| (DGIdb 4.0) |
| Entrez ID | Symbol | Category | Interaction Types | Drug Claim Name | Drug Name | PMIDs |
| 6241 | RRM2 | DRUGGABLE GENOME, ENZYME | inhibitor | CHEMBL467 | HYDROXYUREA | |
| 6241 | RRM2 | DRUGGABLE GENOME, ENZYME | inhibitor | CHEMBL1096882 | FLUDARABINE PHOSPHATE | |
| 6241 | RRM2 | DRUGGABLE GENOME, ENZYME | Hydroxyurea | HYDROXYUREA | ||
| 6241 | RRM2 | DRUGGABLE GENOME, ENZYME | cytarabine | CYTARABINE | 24024897 | |
| 6241 | RRM2 | DRUGGABLE GENOME, ENZYME | inhibitor | CHEMBL1200983 | GALLIUM NITRATE | |
| 6241 | RRM2 | DRUGGABLE GENOME, ENZYME | GEMCITABINE | GEMCITABINE | ||
| 6241 | RRM2 | DRUGGABLE GENOME, ENZYME | CALAA-01 | |||
| 6241 | RRM2 | DRUGGABLE GENOME, ENZYME | LY-2334737 | LY-2334737 | ||
| 6241 | RRM2 | DRUGGABLE GENOME, ENZYME | inhibitor | CHEMBL1750 | CLOFARABINE | |
| 6241 | RRM2 | DRUGGABLE GENOME, ENZYME | inhibitor | 178103428 | HYDROXYUREA |
| Page: 1 2 3 |

Copyright 2023-Present -The University of Texas Health Science Center at Houston |