
|
|||||
|
 | |
| |
| |
| |
| |
| |
|
Gene: RRBP1 |
Gene summary for RRBP1 |
| Gene information | Species | Human | Gene symbol | RRBP1 | Gene ID | 6238 |
| Gene name | ribosome binding protein 1 | |
| Gene Alias | ES/130 | |
| Cytomap | 20p12.1 | |
| Gene Type | protein-coding | GO ID | GO:0001503 | UniProtAcc | Q9P2E9 |
Top |
Malignant transformation analysis |
| Identification of the aberrant gene expression in precancerous and cancerous lesions by comparing the gene expression of stem-like cells in diseased tissues with normal stem cells |
| Entrez ID | Symbol | Replicates | Species | Organ | Tissue | Adj P-value | Log2FC | Malignancy |
| 6238 | RRBP1 | GSM4909294 | Human | Breast | IDC | 8.73e-07 | -2.85e-01 | 0.2022 |
| 6238 | RRBP1 | GSM4909296 | Human | Breast | IDC | 2.70e-12 | -3.52e-02 | 0.1524 |
| 6238 | RRBP1 | GSM4909297 | Human | Breast | IDC | 2.41e-14 | -3.15e-01 | 0.1517 |
| 6238 | RRBP1 | GSM4909298 | Human | Breast | IDC | 1.50e-04 | 3.77e-01 | 0.1551 |
| 6238 | RRBP1 | GSM4909304 | Human | Breast | IDC | 1.66e-10 | -3.58e-01 | 0.1636 |
| 6238 | RRBP1 | GSM4909311 | Human | Breast | IDC | 1.55e-32 | -1.41e-01 | 0.1534 |
| 6238 | RRBP1 | GSM4909312 | Human | Breast | IDC | 1.68e-10 | -1.82e-01 | 0.1552 |
| 6238 | RRBP1 | GSM4909317 | Human | Breast | IDC | 1.78e-41 | 8.68e-01 | 0.1355 |
| 6238 | RRBP1 | GSM4909319 | Human | Breast | IDC | 2.11e-39 | -2.17e-01 | 0.1563 |
| 6238 | RRBP1 | GSM4909320 | Human | Breast | IDC | 2.54e-06 | -7.92e-02 | 0.1575 |
| 6238 | RRBP1 | GSM4909321 | Human | Breast | IDC | 2.76e-21 | -3.45e-01 | 0.1559 |
| 6238 | RRBP1 | M2 | Human | Breast | IDC | 1.28e-03 | 1.28e-01 | 0.21 |
| 6238 | RRBP1 | NCCBC11 | Human | Breast | DCIS | 4.47e-04 | -2.18e-01 | 0.1232 |
| 6238 | RRBP1 | NCCBC14 | Human | Breast | DCIS | 4.07e-13 | -4.98e-02 | 0.2021 |
| 6238 | RRBP1 | NCCBC3 | Human | Breast | DCIS | 6.06e-04 | 9.12e-02 | 0.1198 |
| 6238 | RRBP1 | NCCBC5 | Human | Breast | DCIS | 2.30e-13 | -2.47e-01 | 0.2046 |
| 6238 | RRBP1 | P1 | Human | Breast | IDC | 7.46e-15 | -1.11e-01 | 0.1527 |
| 6238 | RRBP1 | P2 | Human | Breast | IDC | 8.76e-08 | -1.08e-01 | 0.21 |
| 6238 | RRBP1 | DCIS2 | Human | Breast | DCIS | 1.25e-58 | 5.11e-01 | 0.0085 |
| 6238 | RRBP1 | HTA11_3410_2000001011 | Human | Colorectum | AD | 2.39e-17 | -5.46e-01 | 0.0155 |
| Page: 1 2 3 4 5 6 7 8 9 10 11 12 13 14 |
| Tissue | Expression Dynamics | Abbreviation |
| Breast |  | IDC: Invasive ductal carcinoma |
| DCIS: Ductal carcinoma in situ | ||
| Precancer(BRCA1-mut): Precancerous lesion from BRCA1 mutation carriers | ||
| Colorectum (GSE201348) | 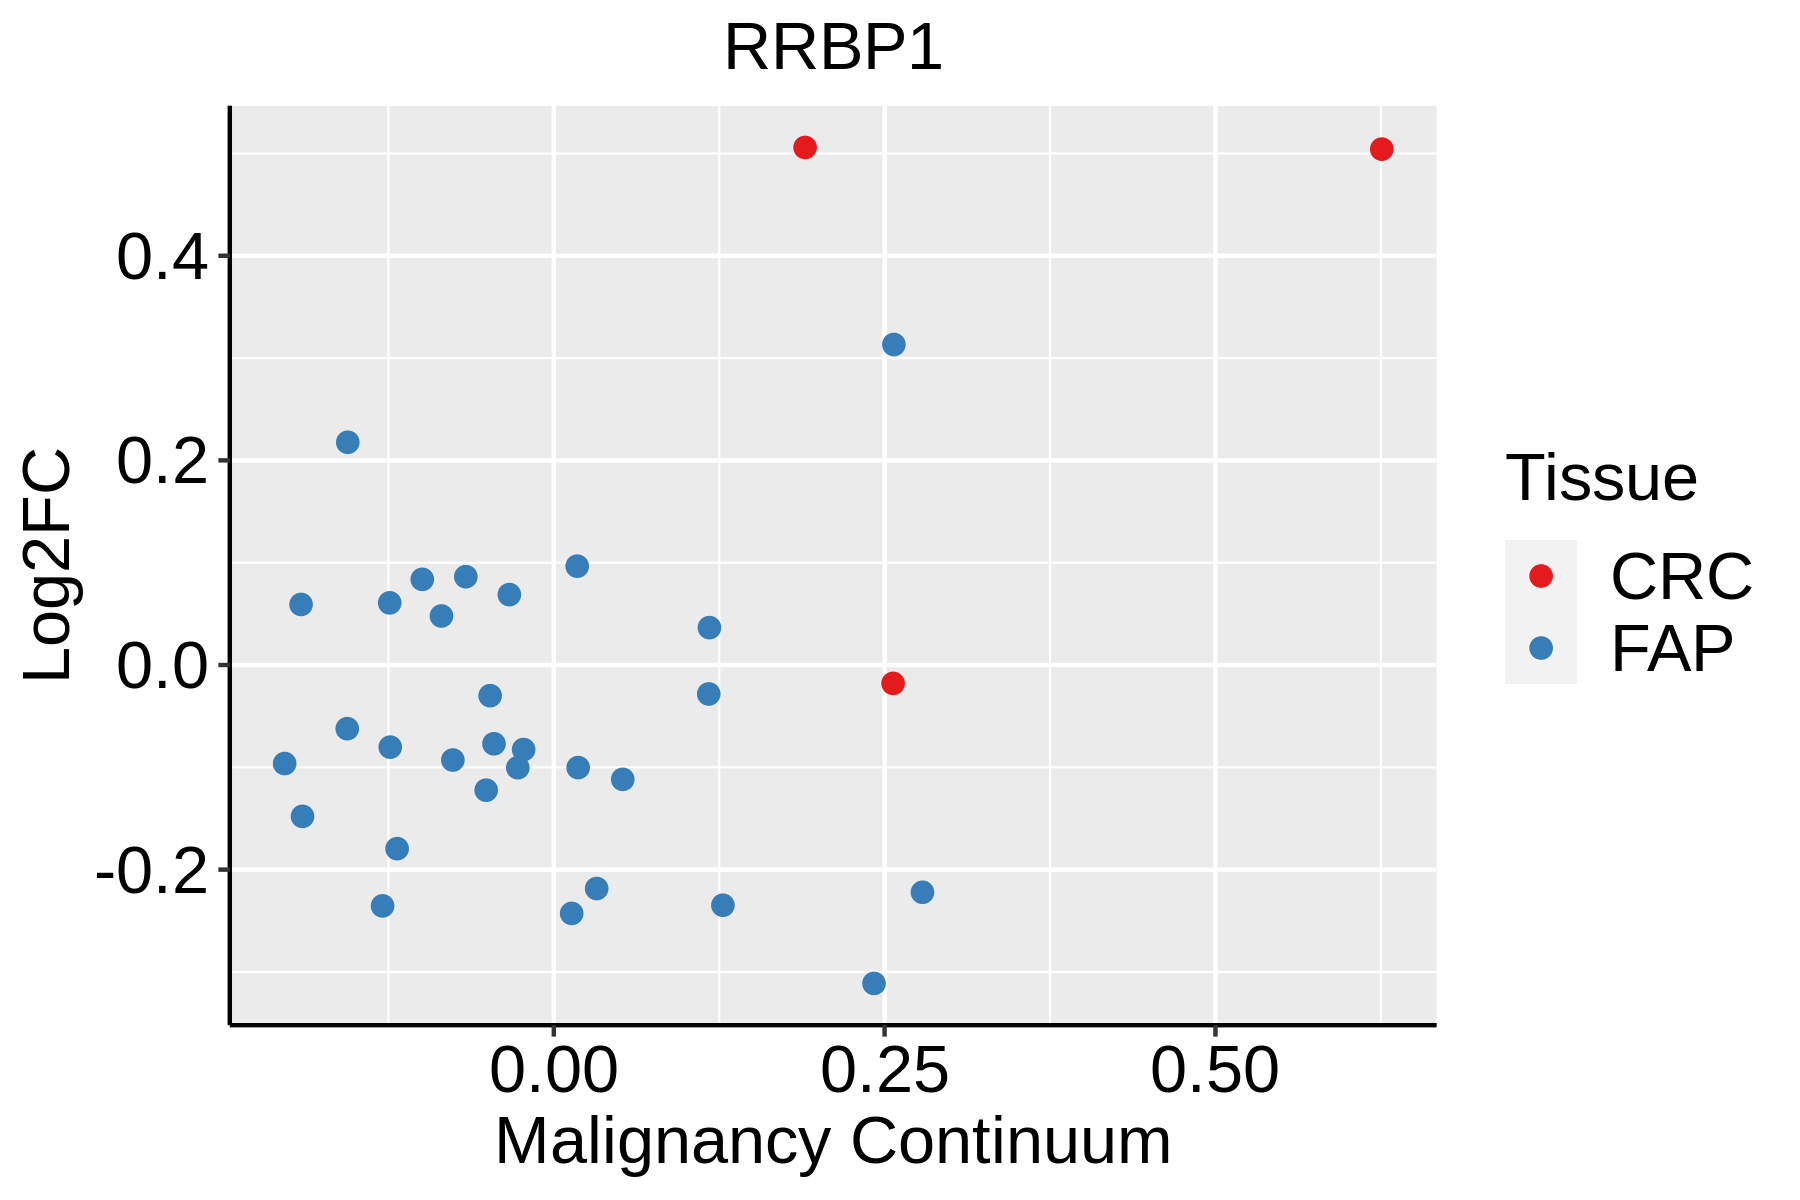 | FAP: Familial adenomatous polyposis |
| CRC: Colorectal cancer | ||
| Colorectum (HTA11) |  | AD: Adenomas |
| SER: Sessile serrated lesions | ||
| MSI-H: Microsatellite-high colorectal cancer | ||
| MSS: Microsatellite stable colorectal cancer | ||
| Endometrium |  | AEH: Atypical endometrial hyperplasia |
| EEC: Endometrioid Cancer | ||
| Esophagus | 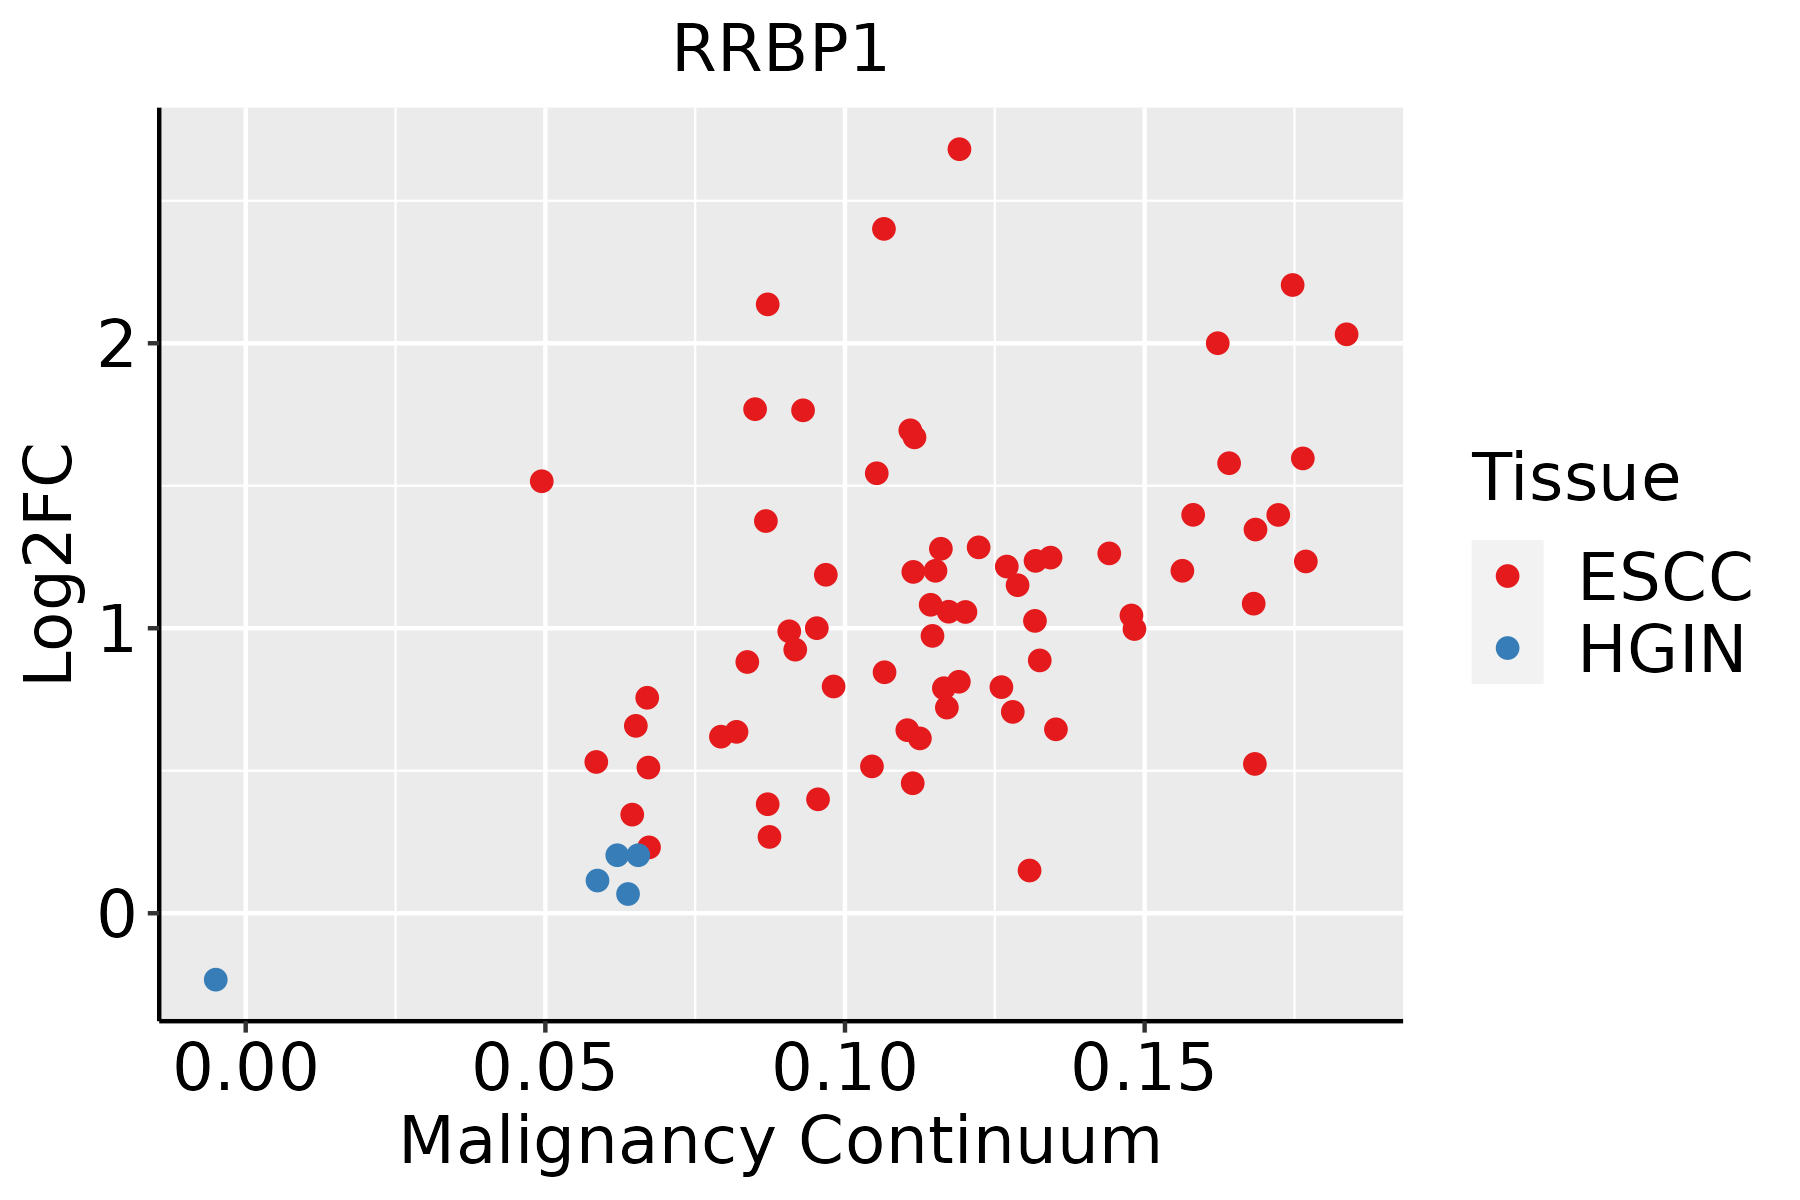 | ESCC: Esophageal squamous cell carcinoma |
| HGIN: High-grade intraepithelial neoplasias | ||
| LGIN: Low-grade intraepithelial neoplasias | ||
| GC |  | CAG: Chronic atrophic gastritis |
| CAG with IM: Chronic atrophic gastritis with intestinal metaplasia | ||
| CSG: Chronic superficial gastritis | ||
| GC: Gastric cancer | ||
| SIM: Severe intestinal metaplasia | ||
| WIM: Wild intestinal metaplasia | ||
| Liver | 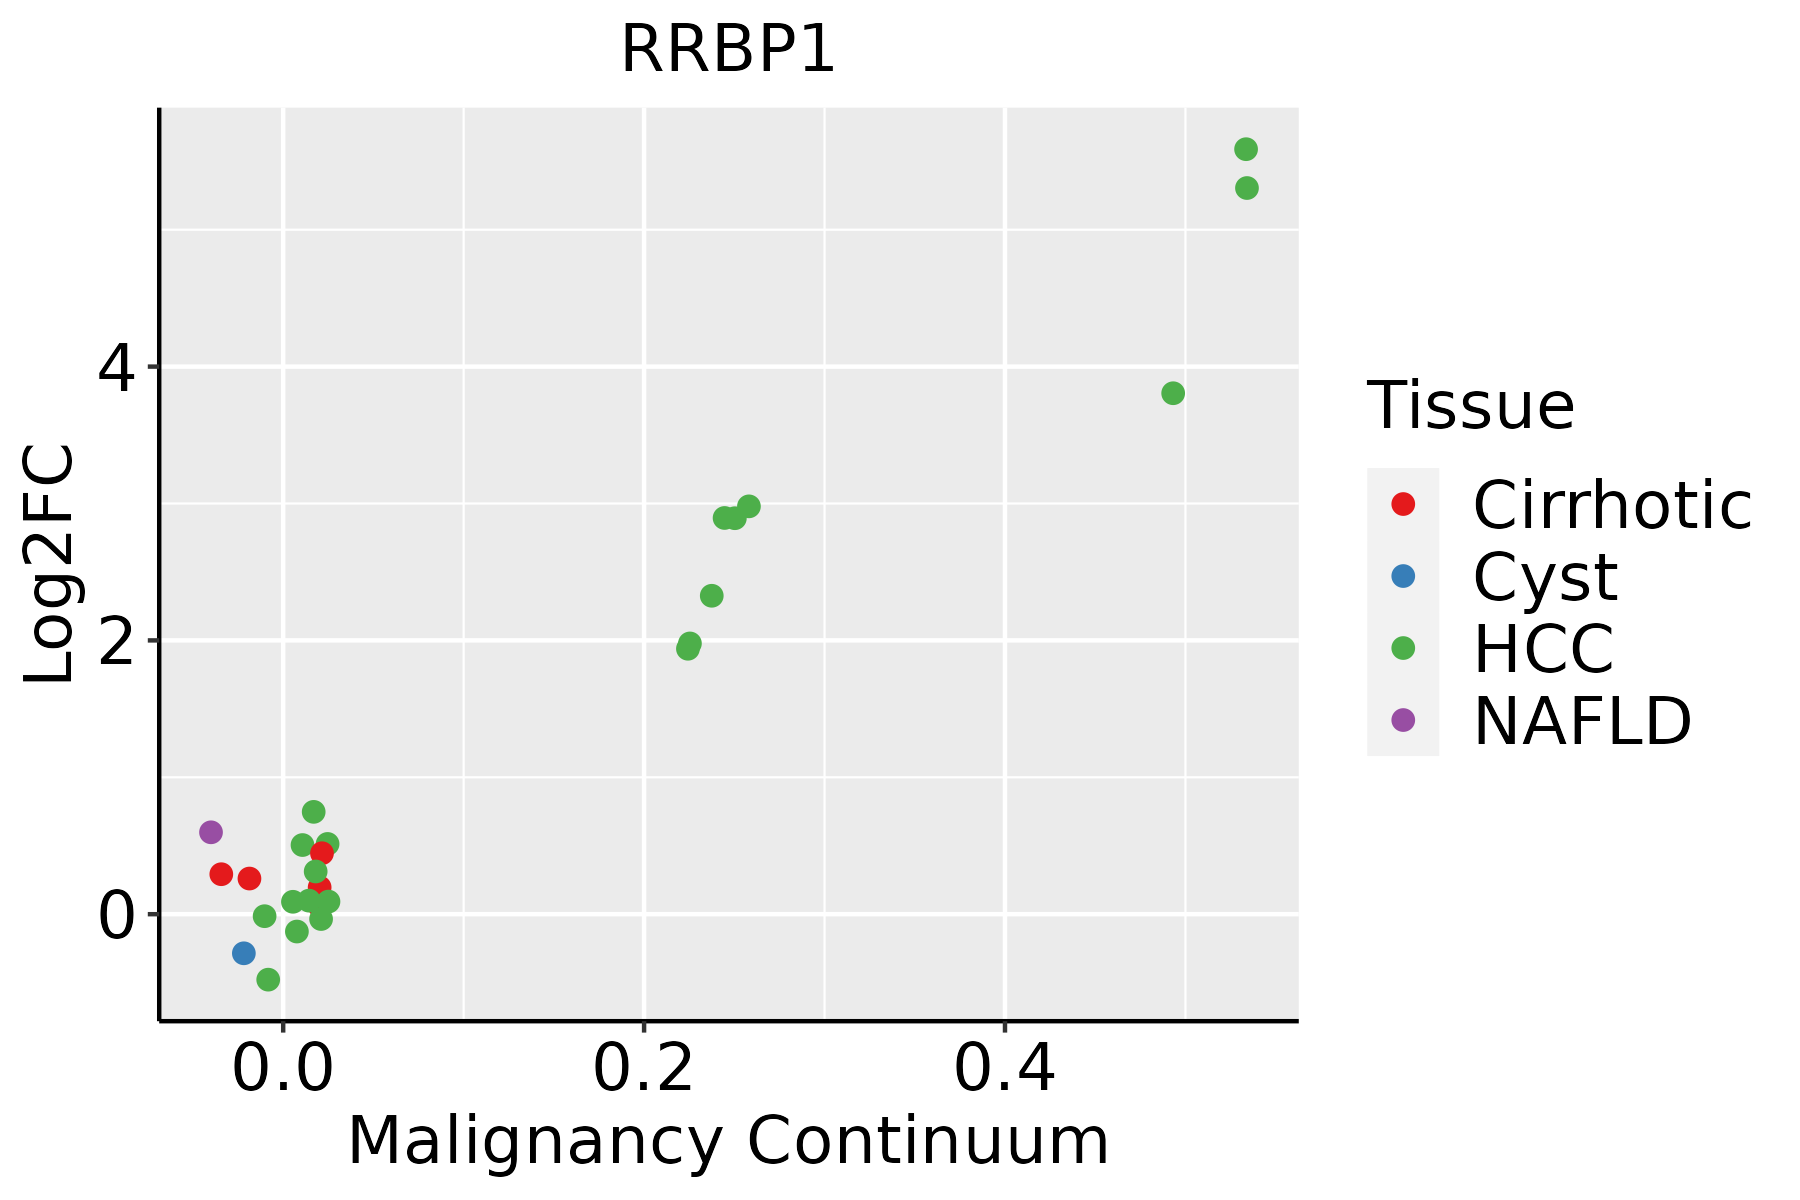 | HCC: Hepatocellular carcinoma |
| NAFLD: Non-alcoholic fatty liver disease | ||
| Oral Cavity |  | EOLP: Erosive Oral lichen planus |
| LP: leukoplakia | ||
| NEOLP: Non-erosive oral lichen planus | ||
| OSCC: Oral squamous cell carcinoma | ||
| Prostate | 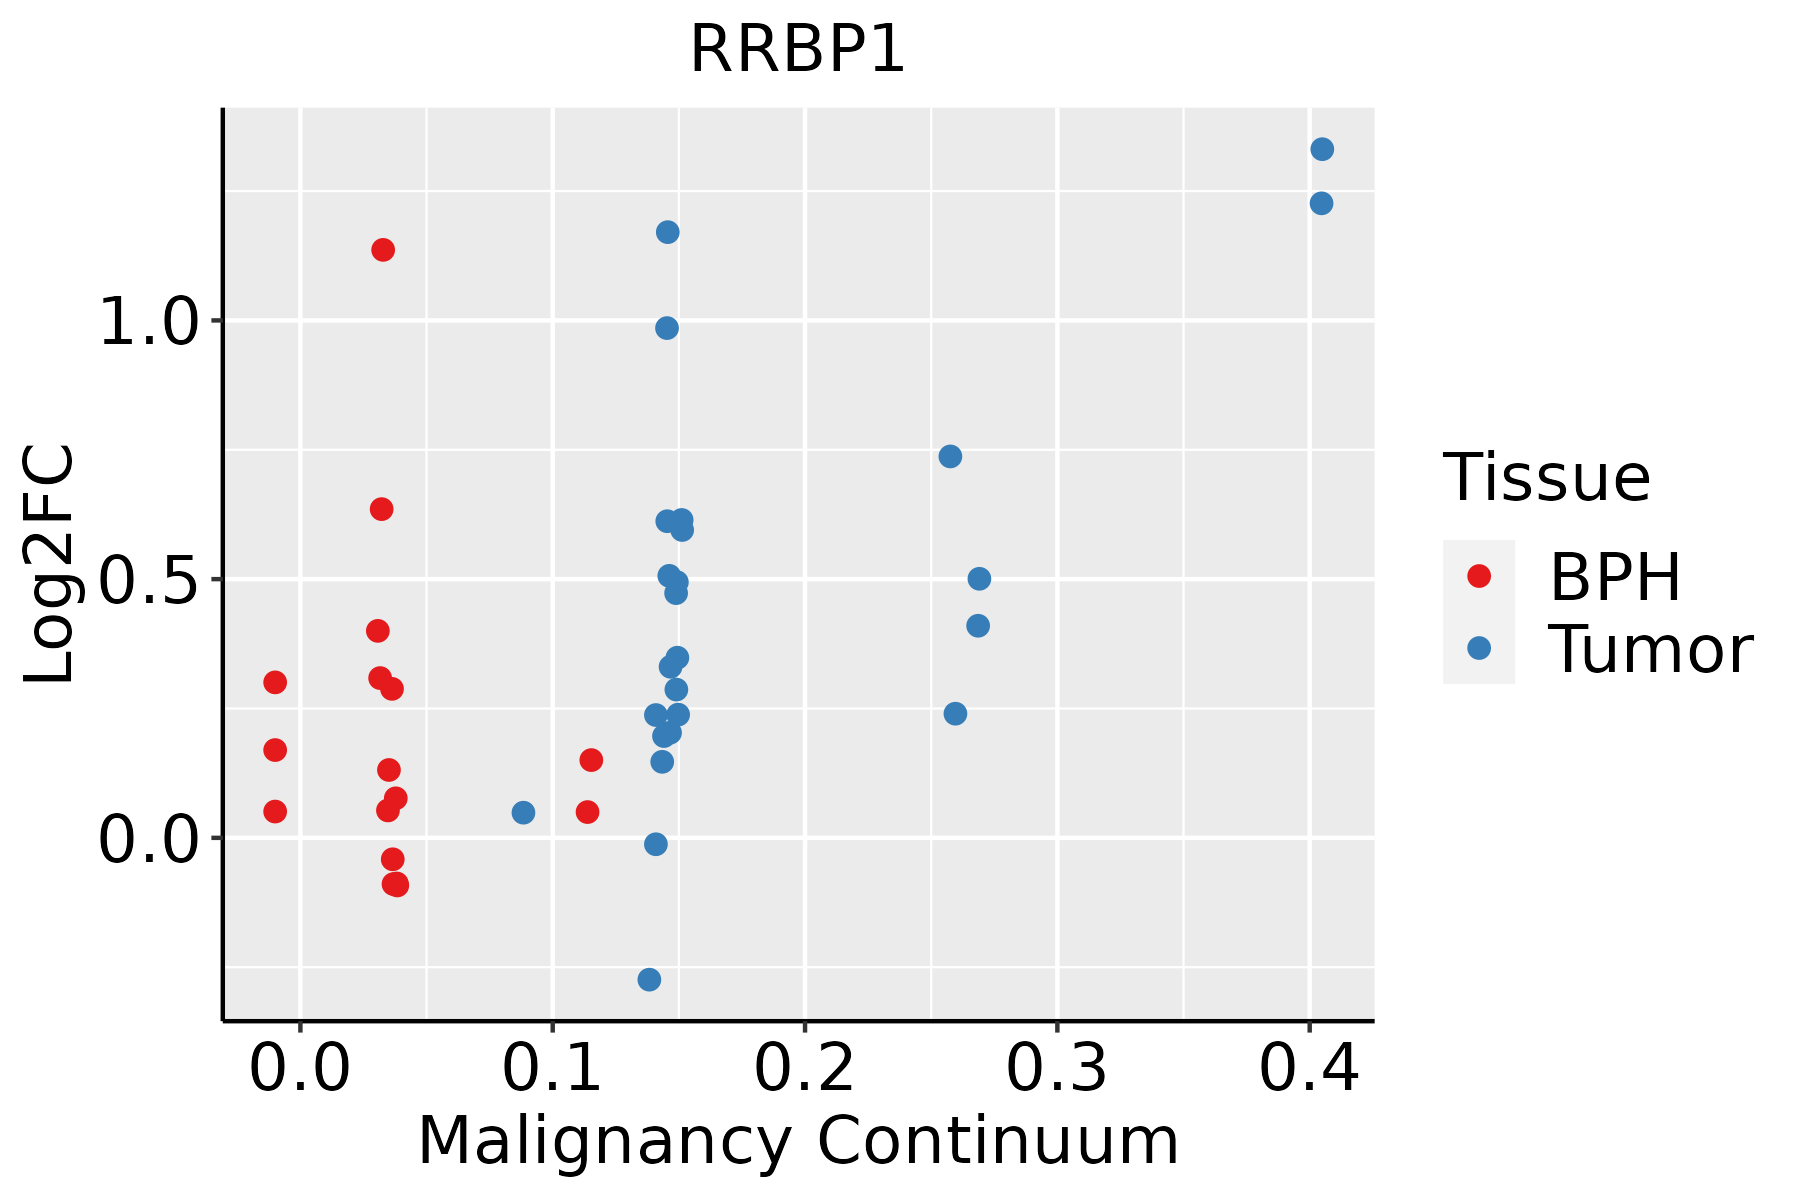 | BPH: Benign Prostatic Hyperplasia |
| Skin |  | AK: Actinic keratosis |
| cSCC: Cutaneous squamous cell carcinoma | ||
| SCCIS:squamous cell carcinoma in situ | ||
| Thyroid |  | ATC: Anaplastic thyroid cancer |
| HT: Hashimoto's thyroiditis | ||
| PTC: Papillary thyroid cancer |
| ∗log2FC in expression of this searched gene in stem-like cells from each diseased tissue sample relative to stem-like cells in normal samples in each tissue plotted against the malignancy continuum. Samples are colored based on if they are from different disease stage. |
Top |
Malignant transformation related pathway analysis |
| Find out the enriched GO biological processes and KEGG pathways involved in transition from healthy to precancer to cancer |
| Tissue | Disease Stage | Enriched GO biological Processes |
| Colorectum | AD |  |
| Colorectum | SER |  |
| Colorectum | MSS |  |
| Colorectum | MSI-H |  |
| Colorectum | FAP |  |
| ∗Top 15 enriched GO BP terms are showed in the bar plot of each disease state in each tissue. Each row represents a significant GO biological process which is colored according to the -log10(p.adjust). |
| Page: 1 2 3 4 5 6 7 8 9 |
| GO ID | Tissue | Disease Stage | Description | Gene Ratio | Bg Ratio | pvalue | p.adjust | Count |
| GO:000164912 | Breast | IDC | osteoblast differentiation | 35/1434 | 229/18723 | 6.64e-05 | 1.35e-03 | 35 |
| GO:000150311 | Breast | IDC | ossification | 50/1434 | 408/18723 | 6.51e-04 | 8.04e-03 | 50 |
| GO:000164921 | Breast | DCIS | osteoblast differentiation | 32/1390 | 229/18723 | 4.00e-04 | 5.48e-03 | 32 |
| GO:000150321 | Breast | DCIS | ossification | 45/1390 | 408/18723 | 4.98e-03 | 3.72e-02 | 45 |
| GO:0001649 | Colorectum | AD | osteoblast differentiation | 70/3918 | 229/18723 | 3.59e-04 | 4.18e-03 | 70 |
| GO:0001503 | Colorectum | AD | ossification | 106/3918 | 408/18723 | 7.68e-03 | 4.64e-02 | 106 |
| GO:00016491 | Colorectum | SER | osteoblast differentiation | 56/2897 | 229/18723 | 2.49e-04 | 4.21e-03 | 56 |
| GO:00015031 | Colorectum | SER | ossification | 82/2897 | 408/18723 | 6.76e-03 | 4.78e-02 | 82 |
| GO:00016492 | Colorectum | MSS | osteoblast differentiation | 64/3467 | 229/18723 | 2.91e-04 | 3.83e-03 | 64 |
| GO:00015032 | Colorectum | MSS | ossification | 96/3467 | 408/18723 | 6.09e-03 | 4.07e-02 | 96 |
| GO:00016493 | Colorectum | FAP | osteoblast differentiation | 51/2622 | 229/18723 | 4.40e-04 | 5.22e-03 | 51 |
| GO:00015033 | Colorectum | FAP | ossification | 79/2622 | 408/18723 | 1.53e-03 | 1.37e-02 | 79 |
| GO:00016494 | Colorectum | CRC | osteoblast differentiation | 41/2078 | 229/18723 | 1.36e-03 | 1.50e-02 | 41 |
| GO:00015034 | Colorectum | CRC | ossification | 64/2078 | 408/18723 | 2.73e-03 | 2.49e-02 | 64 |
| GO:00016498 | Endometrium | AEH | osteoblast differentiation | 52/2100 | 229/18723 | 4.74e-07 | 1.92e-05 | 52 |
| GO:00015038 | Endometrium | AEH | ossification | 78/2100 | 408/18723 | 1.54e-06 | 4.85e-05 | 78 |
| GO:000164914 | Endometrium | EEC | osteoblast differentiation | 53/2168 | 229/18723 | 5.32e-07 | 2.02e-05 | 53 |
| GO:000150313 | Endometrium | EEC | ossification | 79/2168 | 408/18723 | 2.72e-06 | 7.67e-05 | 79 |
| GO:000164917 | Esophagus | HGIN | osteoblast differentiation | 50/2587 | 229/18723 | 5.88e-04 | 8.30e-03 | 50 |
| GO:000150316 | Esophagus | HGIN | ossification | 75/2587 | 408/18723 | 5.49e-03 | 4.49e-02 | 75 |
| Page: 1 2 3 |
| Pathway ID | Tissue | Disease Stage | Description | Gene Ratio | Bg Ratio | pvalue | p.adjust | qvalue | Count |
| hsa0414143 | Breast | DCIS | Protein processing in endoplasmic reticulum | 36/846 | 174/8465 | 1.60e-05 | 1.91e-04 | 1.41e-04 | 36 |
| hsa0414153 | Breast | DCIS | Protein processing in endoplasmic reticulum | 36/846 | 174/8465 | 1.60e-05 | 1.91e-04 | 1.41e-04 | 36 |
| hsa04141 | Colorectum | AD | Protein processing in endoplasmic reticulum | 80/2092 | 174/8465 | 5.96e-10 | 1.25e-08 | 7.96e-09 | 80 |
| hsa041411 | Colorectum | AD | Protein processing in endoplasmic reticulum | 80/2092 | 174/8465 | 5.96e-10 | 1.25e-08 | 7.96e-09 | 80 |
| hsa041412 | Colorectum | SER | Protein processing in endoplasmic reticulum | 60/1580 | 174/8465 | 4.20e-07 | 7.33e-06 | 5.32e-06 | 60 |
| hsa041413 | Colorectum | SER | Protein processing in endoplasmic reticulum | 60/1580 | 174/8465 | 4.20e-07 | 7.33e-06 | 5.32e-06 | 60 |
| hsa041414 | Colorectum | MSS | Protein processing in endoplasmic reticulum | 75/1875 | 174/8465 | 3.78e-10 | 8.44e-09 | 5.17e-09 | 75 |
| hsa041415 | Colorectum | MSS | Protein processing in endoplasmic reticulum | 75/1875 | 174/8465 | 3.78e-10 | 8.44e-09 | 5.17e-09 | 75 |
| hsa041418 | Colorectum | FAP | Protein processing in endoplasmic reticulum | 50/1404 | 174/8465 | 3.64e-05 | 3.68e-04 | 2.24e-04 | 50 |
| hsa041419 | Colorectum | FAP | Protein processing in endoplasmic reticulum | 50/1404 | 174/8465 | 3.64e-05 | 3.68e-04 | 2.24e-04 | 50 |
| hsa0414126 | Endometrium | AEH | Protein processing in endoplasmic reticulum | 62/1197 | 174/8465 | 5.97e-13 | 1.39e-11 | 1.01e-11 | 62 |
| hsa04141111 | Endometrium | AEH | Protein processing in endoplasmic reticulum | 62/1197 | 174/8465 | 5.97e-13 | 1.39e-11 | 1.01e-11 | 62 |
| hsa0414127 | Endometrium | EEC | Protein processing in endoplasmic reticulum | 64/1237 | 174/8465 | 2.17e-13 | 5.09e-12 | 3.80e-12 | 64 |
| hsa0414136 | Endometrium | EEC | Protein processing in endoplasmic reticulum | 64/1237 | 174/8465 | 2.17e-13 | 5.09e-12 | 3.80e-12 | 64 |
| hsa0414139 | Esophagus | HGIN | Protein processing in endoplasmic reticulum | 67/1383 | 174/8465 | 1.06e-12 | 2.16e-11 | 1.72e-11 | 67 |
| hsa04141114 | Esophagus | HGIN | Protein processing in endoplasmic reticulum | 67/1383 | 174/8465 | 1.06e-12 | 2.16e-11 | 1.72e-11 | 67 |
| hsa04141211 | Esophagus | ESCC | Protein processing in endoplasmic reticulum | 147/4205 | 174/8465 | 3.29e-22 | 1.10e-19 | 5.64e-20 | 147 |
| hsa04141310 | Esophagus | ESCC | Protein processing in endoplasmic reticulum | 147/4205 | 174/8465 | 3.29e-22 | 1.10e-19 | 5.64e-20 | 147 |
| hsa0414114 | Liver | Cirrhotic | Protein processing in endoplasmic reticulum | 114/2530 | 174/8465 | 1.16e-22 | 9.67e-21 | 5.96e-21 | 114 |
| hsa0414115 | Liver | Cirrhotic | Protein processing in endoplasmic reticulum | 114/2530 | 174/8465 | 1.16e-22 | 9.67e-21 | 5.96e-21 | 114 |
| Page: 1 2 3 |
Top |
Cell-cell communication analysis |
| Identification of potential cell-cell interactions between two cell types and their ligand-receptor pairs for different disease states |
| Ligand | Receptor | LRpair | Pathway | Tissue | Disease Stage |
| Page: 1 |
Top |
Single-cell gene regulatory network inference analysis |
| Find out the significant the regulons (TFs) and the target genes of each regulon across cell types for different disease states |
| TF | Cell Type | Tissue | Disease Stage | Target Gene | RSS | Regulon Activity |
| ∗The dot plots of a searched regulon are shown for all cell subpopulations in each disease state of each tissue based on the regulon specific score inferred using pySCENIC and by calculating the average expression. |
| Page: 1 |
Top |
Somatic mutation of malignant transformation related genes |
| Annotation of somatic variants for genes involved in malignant transformation |
| Hugo Symbol | Variant Class | Variant Classification | dbSNP RS | HGVSc | HGVSp | HGVSp Short | SWISSPROT | BIOTYPE | SIFT | PolyPhen | Tumor Sample Barcode | Tissue | Histology | Sex | Age | Stage | Therapy Types | Drugs | Outcome |
| RRBP1 | SNV | Missense_Mutation | rs537199653 | c.598G>A | p.Gly200Ser | p.G200S | Q9P2E9 | protein_coding | tolerated(0.08) | possibly_damaging(0.578) | TCGA-AO-A0JC-01 | Breast | breast invasive carcinoma | Female | <65 | I/II | Chemotherapy | fluorouracil | SD |
| RRBP1 | SNV | Missense_Mutation | c.147N>A | p.Met49Ile | p.M49I | Q9P2E9 | protein_coding | deleterious(0.01) | benign(0.097) | TCGA-AR-A24K-01 | Breast | breast invasive carcinoma | Female | <65 | I/II | Unspecific | Paclitaxel | SD | |
| RRBP1 | SNV | Missense_Mutation | c.503N>A | p.Ala168Asp | p.A168D | Q9P2E9 | protein_coding | tolerated(0.06) | possibly_damaging(0.814) | TCGA-BH-A1FN-01 | Breast | breast invasive carcinoma | Female | <65 | I/II | Unknown | Unknown | PD | |
| RRBP1 | insertion | Nonsense_Mutation | novel | c.164_165insATGAATTTTCGATGATTTCCATTTATTT | p.Lys56Ter | p.K56* | Q9P2E9 | protein_coding | TCGA-C8-A1HN-01 | Breast | breast invasive carcinoma | Female | <65 | I/II | Unknown | Unknown | SD | ||
| RRBP1 | SNV | Missense_Mutation | c.2647N>C | p.Glu883Gln | p.E883Q | Q9P2E9 | protein_coding | tolerated(0.21) | benign(0.009) | TCGA-EK-A2PG-01 | Cervix | cervical & endocervical cancer | Female | >=65 | I/II | Unknown | Unknown | SD | |
| RRBP1 | SNV | Missense_Mutation | c.835N>A | p.Glu279Lys | p.E279K | Q9P2E9 | protein_coding | deleterious(0.01) | possibly_damaging(0.904) | TCGA-FU-A2QG-01 | Cervix | cervical & endocervical cancer | Female | <65 | I/II | Unknown | Unknown | SD | |
| RRBP1 | SNV | Missense_Mutation | rs112642316 | c.641A>G | p.Tyr214Cys | p.Y214C | Q9P2E9 | protein_coding | tolerated(0.12) | benign(0.077) | TCGA-A6-6650-01 | Colorectum | colon adenocarcinoma | Female | >=65 | I/II | Unknown | Unknown | SD |
| RRBP1 | SNV | Missense_Mutation | rs773714203 | c.2294C>T | p.Thr765Met | p.T765M | Q9P2E9 | protein_coding | tolerated(0.23) | possibly_damaging(0.506) | TCGA-AA-3710-01 | Colorectum | colon adenocarcinoma | Female | >=65 | I/II | Unknown | Unknown | SD |
| RRBP1 | SNV | Missense_Mutation | rs761671499 | c.2800N>A | p.Ala934Thr | p.A934T | Q9P2E9 | protein_coding | deleterious(0.02) | possibly_damaging(0.902) | TCGA-AA-3715-01 | Colorectum | colon adenocarcinoma | Male | >=65 | I/II | Unknown | Unknown | PD |
| RRBP1 | SNV | Missense_Mutation | novel | c.937A>C | p.Lys313Gln | p.K313Q | Q9P2E9 | protein_coding | deleterious(0.04) | possibly_damaging(0.676) | TCGA-AA-3984-01 | Colorectum | colon adenocarcinoma | Female | <65 | I/II | Unknown | Unknown | SD |
| Page: 1 2 3 4 5 6 7 8 9 10 |
Top |
Related drugs of malignant transformation related genes |
| Identification of chemicals and drugs interact with genes involved in malignant transfromation |
| (DGIdb 4.0) |
| Entrez ID | Symbol | Category | Interaction Types | Drug Claim Name | Drug Name | PMIDs |
| Page: 1 |

Copyright 2023-Present -The University of Texas Health Science Center at Houston |