
|
|||||
|
 | |
| |
| |
| |
| |
| |
|
Gene: RRAS2 |
Gene summary for RRAS2 |
| Gene information | Species | Human | Gene symbol | RRAS2 | Gene ID | 22800 |
| Gene name | RAS related 2 | |
| Gene Alias | NS12 | |
| Cytomap | 11p15.2 | |
| Gene Type | protein-coding | GO ID | GO:0001503 | UniProtAcc | P62070 |
Top |
Malignant transformation analysis |
| Identification of the aberrant gene expression in precancerous and cancerous lesions by comparing the gene expression of stem-like cells in diseased tissues with normal stem cells |
| Entrez ID | Symbol | Replicates | Species | Organ | Tissue | Adj P-value | Log2FC | Malignancy |
| 22800 | RRAS2 | LZE4T | Human | Esophagus | ESCC | 4.29e-04 | 3.85e-03 | 0.0811 |
| 22800 | RRAS2 | LZE20T | Human | Esophagus | ESCC | 1.79e-09 | 1.64e-01 | 0.0662 |
| 22800 | RRAS2 | LZE24T | Human | Esophagus | ESCC | 1.26e-20 | 4.60e-01 | 0.0596 |
| 22800 | RRAS2 | LZE21T | Human | Esophagus | ESCC | 2.85e-05 | 1.39e-01 | 0.0655 |
| 22800 | RRAS2 | P1T-E | Human | Esophagus | ESCC | 6.76e-03 | 1.22e-01 | 0.0875 |
| 22800 | RRAS2 | P2T-E | Human | Esophagus | ESCC | 4.59e-24 | 4.71e-01 | 0.1177 |
| 22800 | RRAS2 | P4T-E | Human | Esophagus | ESCC | 3.15e-27 | 5.39e-01 | 0.1323 |
| 22800 | RRAS2 | P5T-E | Human | Esophagus | ESCC | 2.31e-19 | 2.57e-01 | 0.1327 |
| 22800 | RRAS2 | P8T-E | Human | Esophagus | ESCC | 3.54e-13 | 3.92e-01 | 0.0889 |
| 22800 | RRAS2 | P9T-E | Human | Esophagus | ESCC | 2.54e-17 | 3.52e-01 | 0.1131 |
| 22800 | RRAS2 | P10T-E | Human | Esophagus | ESCC | 2.51e-24 | 3.98e-01 | 0.116 |
| 22800 | RRAS2 | P11T-E | Human | Esophagus | ESCC | 3.30e-13 | 6.60e-01 | 0.1426 |
| 22800 | RRAS2 | P12T-E | Human | Esophagus | ESCC | 1.52e-28 | 7.07e-01 | 0.1122 |
| 22800 | RRAS2 | P15T-E | Human | Esophagus | ESCC | 2.47e-24 | 5.64e-01 | 0.1149 |
| 22800 | RRAS2 | P16T-E | Human | Esophagus | ESCC | 1.53e-22 | 1.83e-01 | 0.1153 |
| 22800 | RRAS2 | P17T-E | Human | Esophagus | ESCC | 2.03e-11 | 7.96e-01 | 0.1278 |
| 22800 | RRAS2 | P19T-E | Human | Esophagus | ESCC | 5.49e-06 | 5.83e-01 | 0.1662 |
| 22800 | RRAS2 | P20T-E | Human | Esophagus | ESCC | 5.35e-18 | 4.19e-01 | 0.1124 |
| 22800 | RRAS2 | P21T-E | Human | Esophagus | ESCC | 2.22e-40 | 9.50e-01 | 0.1617 |
| 22800 | RRAS2 | P22T-E | Human | Esophagus | ESCC | 4.27e-25 | 3.83e-01 | 0.1236 |
| Page: 1 2 3 4 5 6 |
| Tissue | Expression Dynamics | Abbreviation |
| Esophagus | 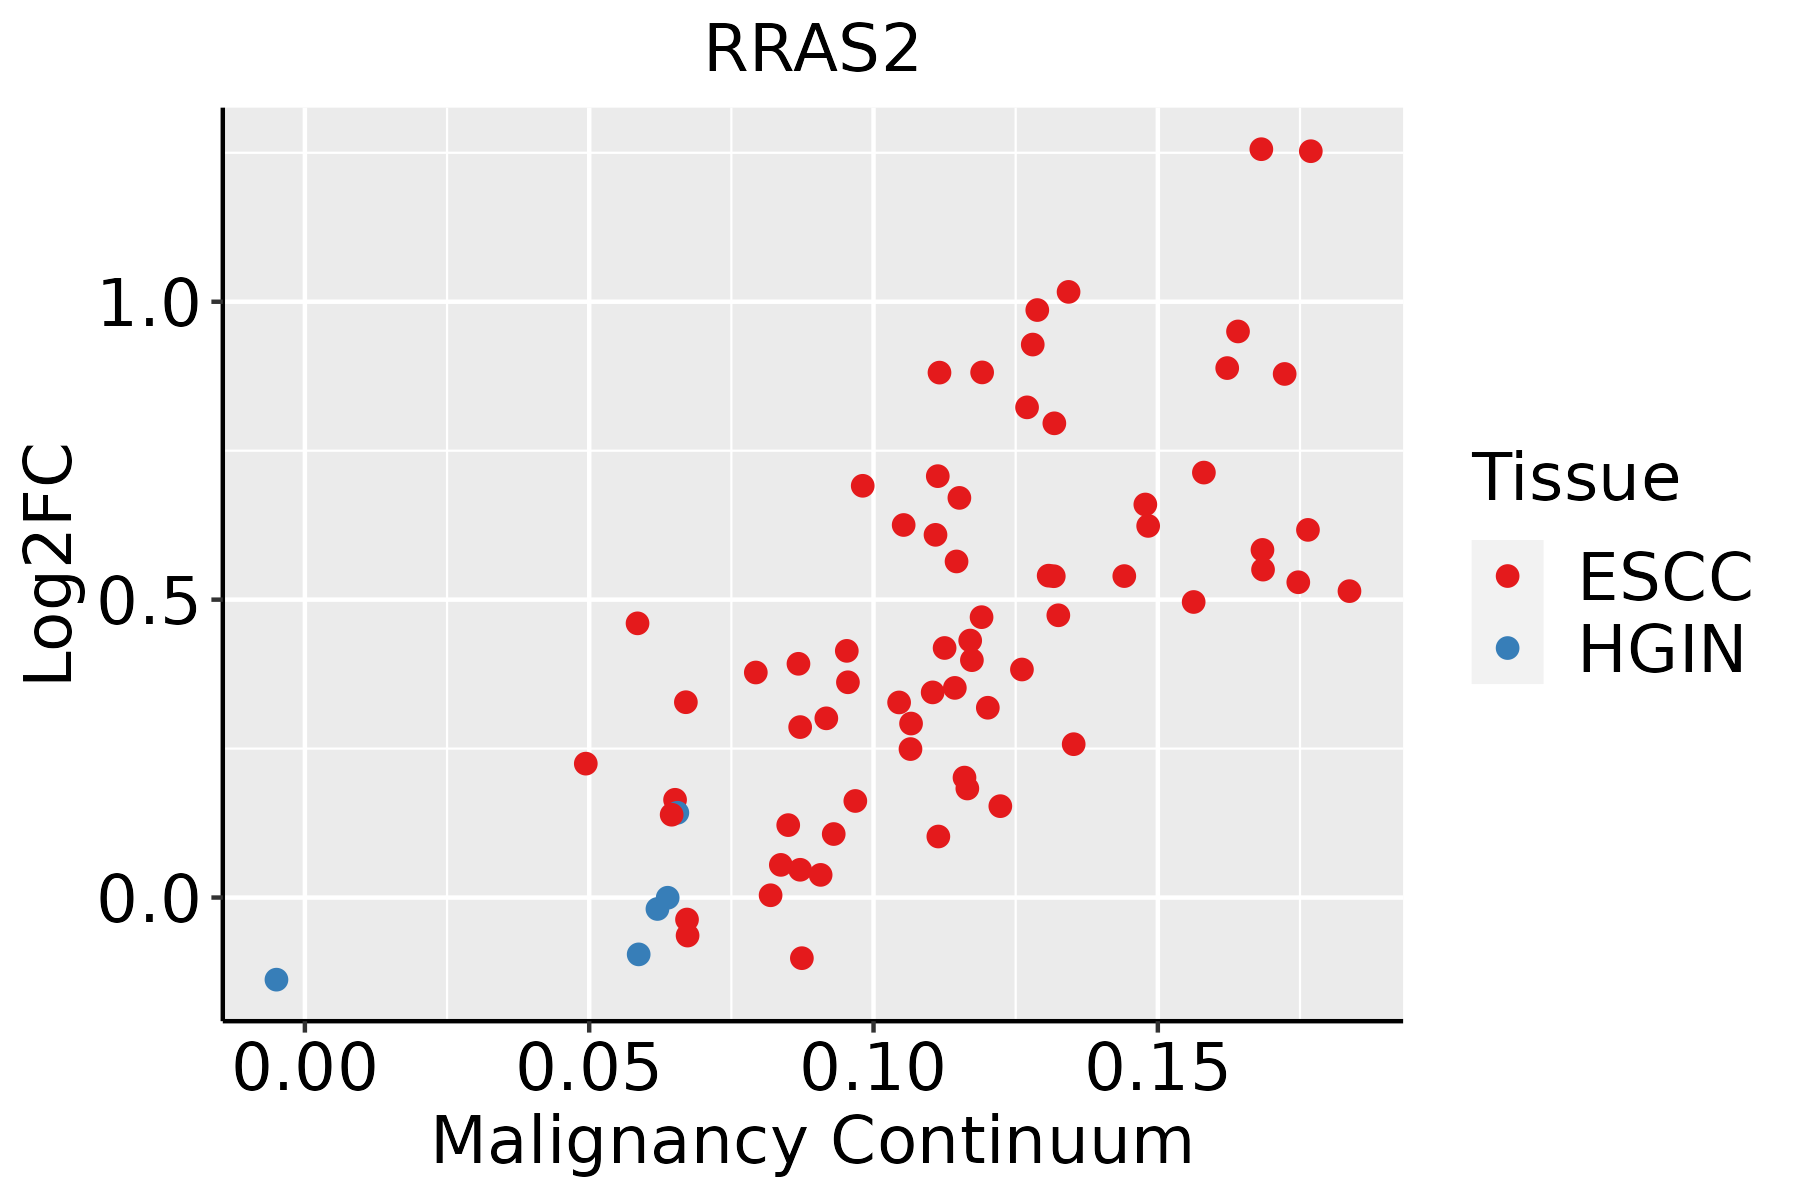 | ESCC: Esophageal squamous cell carcinoma |
| HGIN: High-grade intraepithelial neoplasias | ||
| LGIN: Low-grade intraepithelial neoplasias | ||
| Liver | 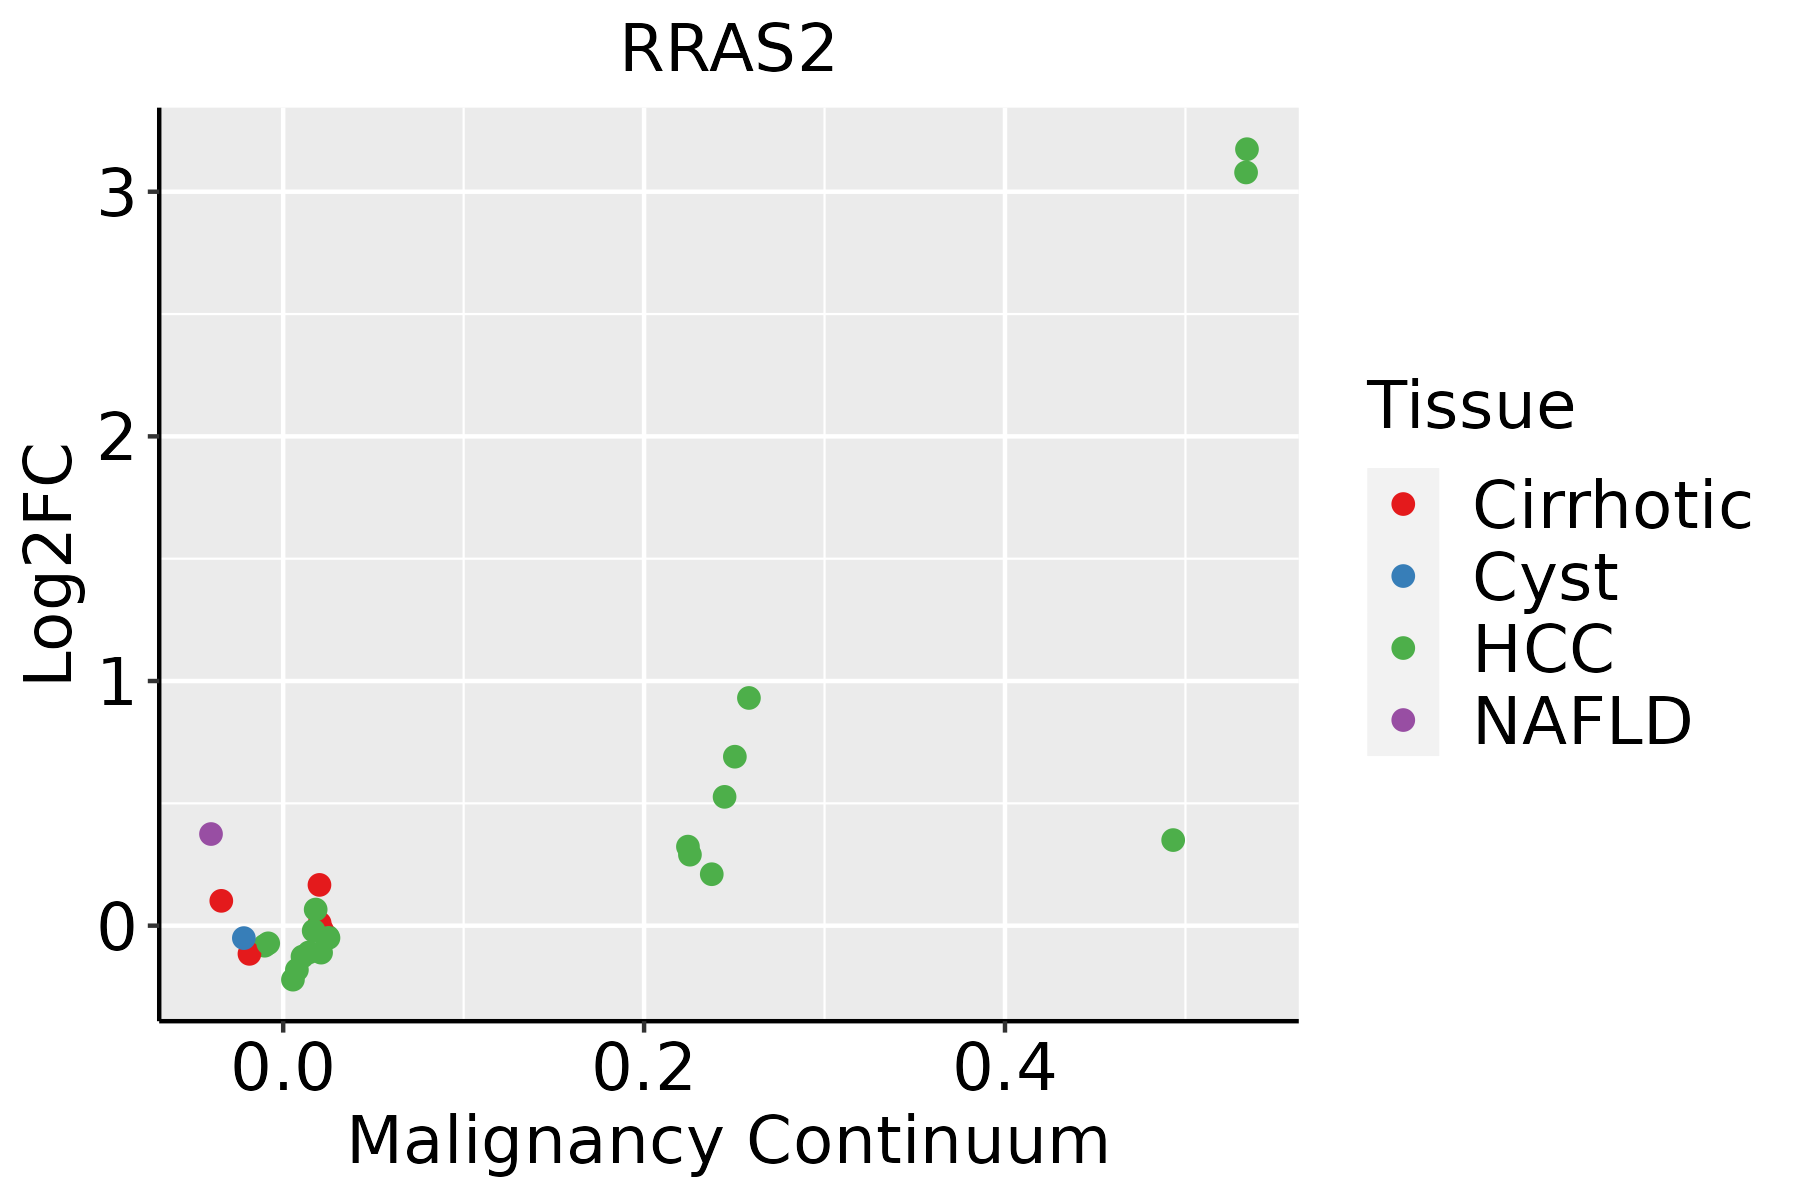 | HCC: Hepatocellular carcinoma |
| NAFLD: Non-alcoholic fatty liver disease | ||
| Lung |  | AAH: Atypical adenomatous hyperplasia |
| AIS: Adenocarcinoma in situ | ||
| IAC: Invasive lung adenocarcinoma | ||
| MIA: Minimally invasive adenocarcinoma | ||
| Oral Cavity | 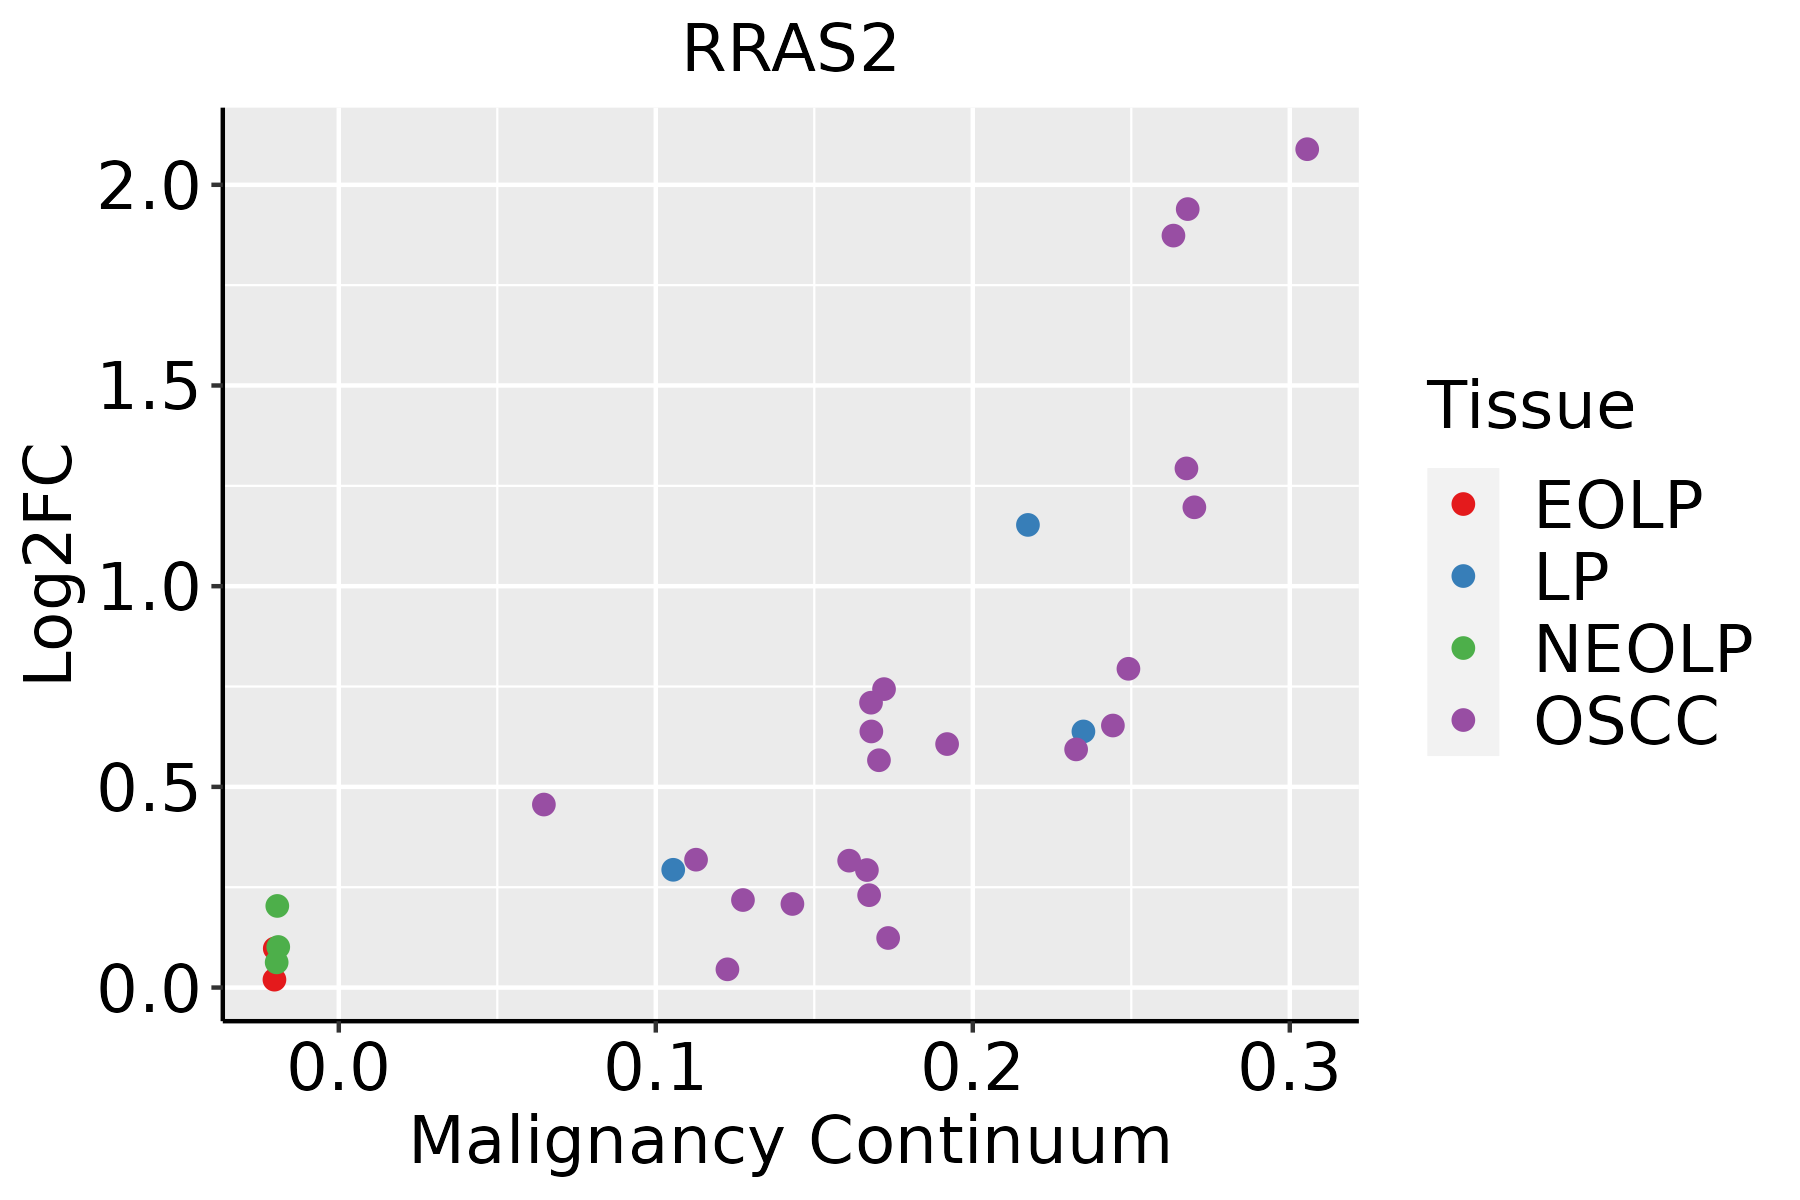 | EOLP: Erosive Oral lichen planus |
| LP: leukoplakia | ||
| NEOLP: Non-erosive oral lichen planus | ||
| OSCC: Oral squamous cell carcinoma | ||
| Skin | 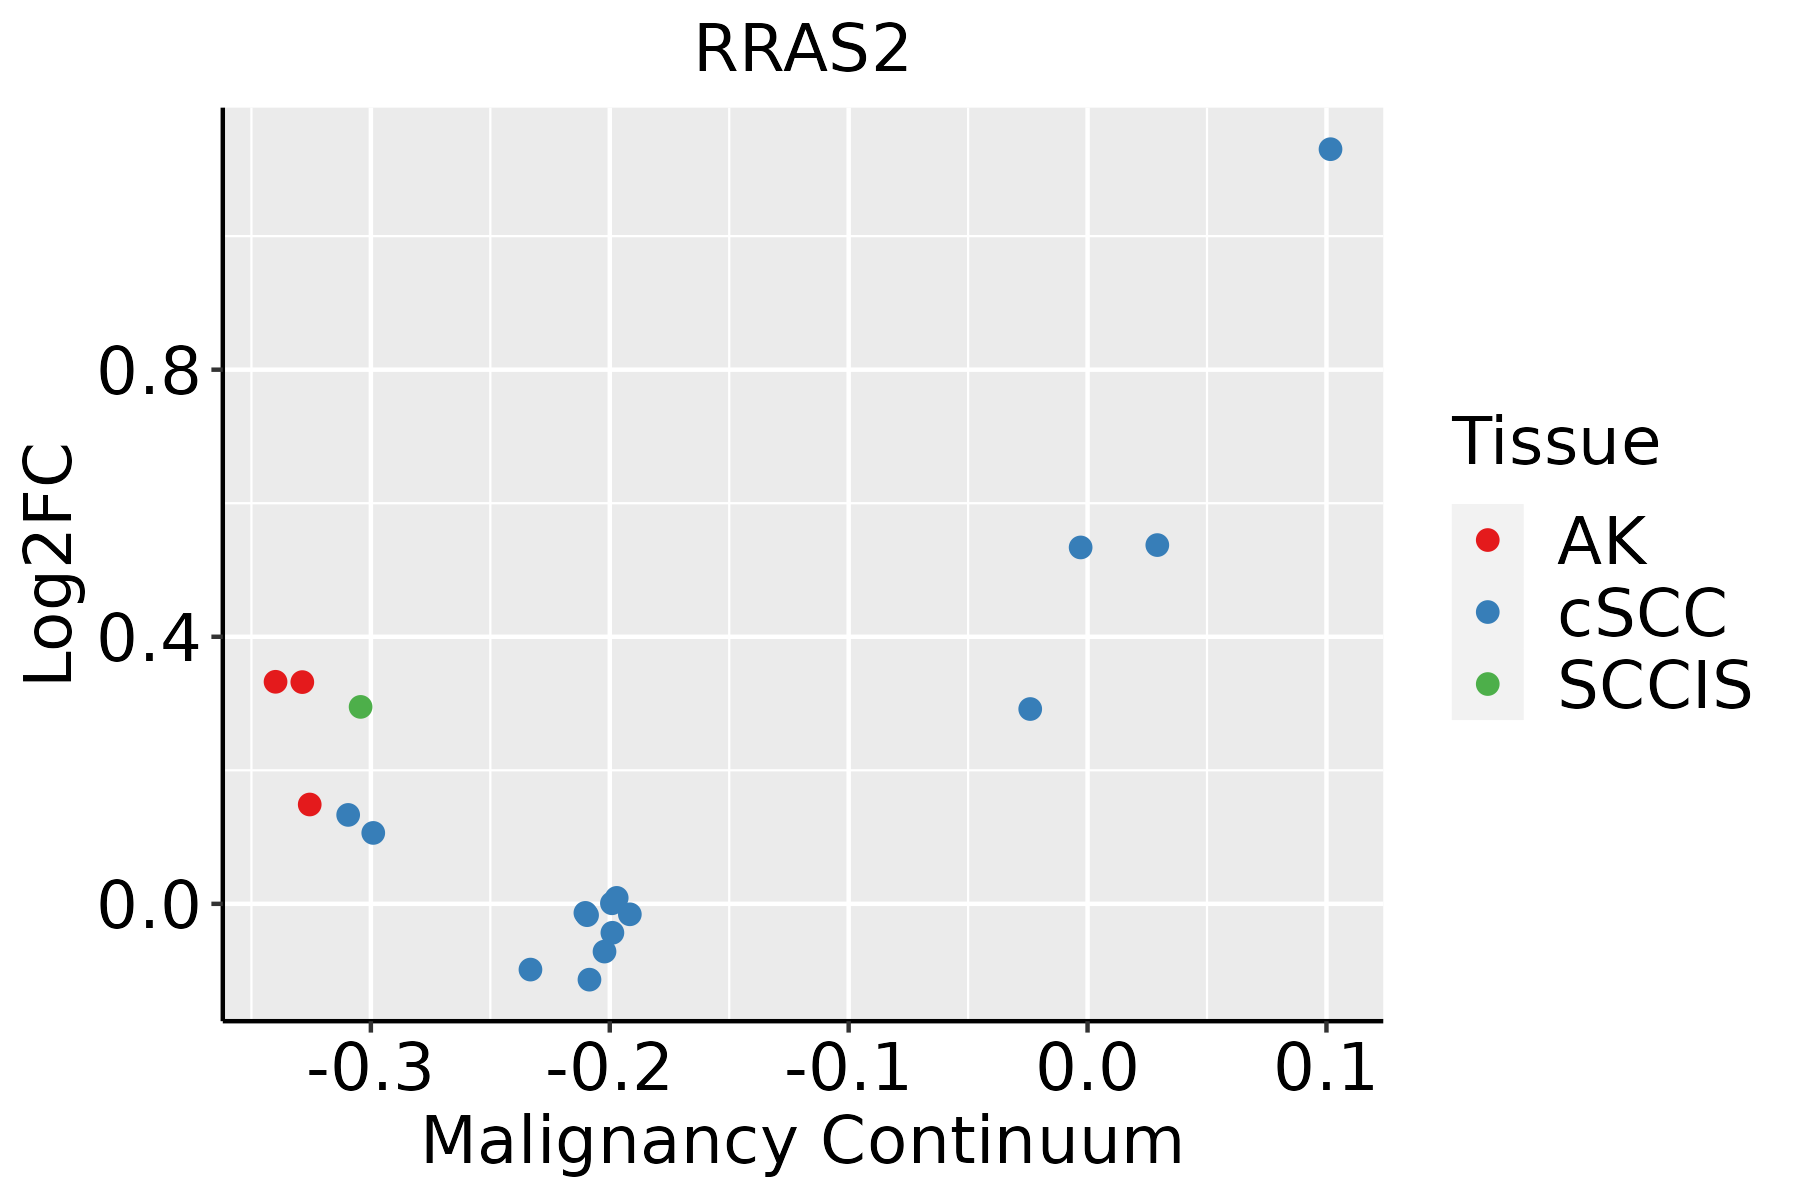 | AK: Actinic keratosis |
| cSCC: Cutaneous squamous cell carcinoma | ||
| SCCIS:squamous cell carcinoma in situ |
| ∗log2FC in expression of this searched gene in stem-like cells from each diseased tissue sample relative to stem-like cells in normal samples in each tissue plotted against the malignancy continuum. Samples are colored based on if they are from different disease stage. |
Top |
Malignant transformation related pathway analysis |
| Find out the enriched GO biological processes and KEGG pathways involved in transition from healthy to precancer to cancer |
| Tissue | Disease Stage | Enriched GO biological Processes |
| Colorectum | AD |  |
| Colorectum | SER |  |
| Colorectum | MSS |  |
| Colorectum | MSI-H |  |
| Colorectum | FAP |  |
| ∗Top 15 enriched GO BP terms are showed in the bar plot of each disease state in each tissue. Each row represents a significant GO biological process which is colored according to the -log10(p.adjust). |
| Page: 1 2 3 4 5 6 7 8 9 |
| GO ID | Tissue | Disease Stage | Description | Gene Ratio | Bg Ratio | pvalue | p.adjust | Count |
| GO:0070997111 | Esophagus | ESCC | neuron death | 216/8552 | 361/18723 | 3.49e-08 | 6.45e-07 | 216 |
| GO:000726510 | Esophagus | ESCC | Ras protein signal transduction | 201/8552 | 337/18723 | 1.44e-07 | 2.30e-06 | 201 |
| GO:000164918 | Esophagus | ESCC | osteoblast differentiation | 140/8552 | 229/18723 | 1.63e-06 | 1.95e-05 | 140 |
| GO:000150317 | Esophagus | ESCC | ossification | 232/8552 | 408/18723 | 3.00e-06 | 3.40e-05 | 232 |
| GO:1901214111 | Esophagus | ESCC | regulation of neuron death | 186/8552 | 319/18723 | 3.35e-06 | 3.73e-05 | 186 |
| GO:007099712 | Liver | Cirrhotic | neuron death | 141/4634 | 361/18723 | 9.56e-10 | 4.38e-08 | 141 |
| GO:19012147 | Liver | Cirrhotic | regulation of neuron death | 122/4634 | 319/18723 | 5.17e-08 | 1.62e-06 | 122 |
| GO:000726511 | Liver | Cirrhotic | Ras protein signal transduction | 119/4634 | 337/18723 | 8.16e-06 | 1.22e-04 | 119 |
| GO:00016495 | Liver | Cirrhotic | osteoblast differentiation | 80/4634 | 229/18723 | 3.39e-04 | 2.91e-03 | 80 |
| GO:00015035 | Liver | Cirrhotic | ossification | 127/4634 | 408/18723 | 1.89e-03 | 1.19e-02 | 127 |
| GO:007099722 | Liver | HCC | neuron death | 202/7958 | 361/18723 | 1.44e-07 | 2.70e-06 | 202 |
| GO:190121412 | Liver | HCC | regulation of neuron death | 179/7958 | 319/18723 | 5.65e-07 | 9.01e-06 | 179 |
| GO:000726521 | Liver | HCC | Ras protein signal transduction | 187/7958 | 337/18723 | 8.89e-07 | 1.35e-05 | 187 |
| GO:000164911 | Liver | HCC | osteoblast differentiation | 115/7958 | 229/18723 | 1.08e-02 | 3.99e-02 | 115 |
| GO:00072655 | Lung | IAC | Ras protein signal transduction | 65/2061 | 337/18723 | 4.48e-06 | 1.81e-04 | 65 |
| GO:00709978 | Lung | IAC | neuron death | 68/2061 | 361/18723 | 6.32e-06 | 2.32e-04 | 68 |
| GO:19012148 | Lung | IAC | regulation of neuron death | 58/2061 | 319/18723 | 8.28e-05 | 1.69e-03 | 58 |
| GO:000726512 | Lung | AIS | Ras protein signal transduction | 60/1849 | 337/18723 | 4.68e-06 | 2.31e-04 | 60 |
| GO:007099713 | Lung | AIS | neuron death | 58/1849 | 361/18723 | 1.39e-04 | 3.05e-03 | 58 |
| GO:190121413 | Lung | AIS | regulation of neuron death | 50/1849 | 319/18723 | 6.90e-04 | 1.02e-02 | 50 |
| Page: 1 2 3 |
| Pathway ID | Tissue | Disease Stage | Description | Gene Ratio | Bg Ratio | pvalue | p.adjust | qvalue | Count |
| hsa0421829 | Esophagus | ESCC | Cellular senescence | 119/4205 | 156/8465 | 5.89e-12 | 9.40e-11 | 4.81e-11 | 119 |
| hsa0414010 | Esophagus | ESCC | Autophagy - animal | 101/4205 | 141/8465 | 7.60e-08 | 6.21e-07 | 3.18e-07 | 101 |
| hsa0520529 | Esophagus | ESCC | Proteoglycans in cancer | 138/4205 | 205/8465 | 1.79e-07 | 1.40e-06 | 7.15e-07 | 138 |
| hsa04137210 | Esophagus | ESCC | Mitophagy - animal | 54/4205 | 72/8465 | 9.33e-06 | 4.96e-05 | 2.54e-05 | 54 |
| hsa046259 | Esophagus | ESCC | C-type lectin receptor signaling pathway | 73/4205 | 104/8465 | 1.57e-05 | 7.98e-05 | 4.09e-05 | 73 |
| hsa0481028 | Esophagus | ESCC | Regulation of actin cytoskeleton | 133/4205 | 229/8465 | 5.94e-03 | 1.48e-02 | 7.56e-03 | 133 |
| hsa0421838 | Esophagus | ESCC | Cellular senescence | 119/4205 | 156/8465 | 5.89e-12 | 9.40e-11 | 4.81e-11 | 119 |
| hsa0414015 | Esophagus | ESCC | Autophagy - animal | 101/4205 | 141/8465 | 7.60e-08 | 6.21e-07 | 3.18e-07 | 101 |
| hsa0520537 | Esophagus | ESCC | Proteoglycans in cancer | 138/4205 | 205/8465 | 1.79e-07 | 1.40e-06 | 7.15e-07 | 138 |
| hsa0413738 | Esophagus | ESCC | Mitophagy - animal | 54/4205 | 72/8465 | 9.33e-06 | 4.96e-05 | 2.54e-05 | 54 |
| hsa0462513 | Esophagus | ESCC | C-type lectin receptor signaling pathway | 73/4205 | 104/8465 | 1.57e-05 | 7.98e-05 | 4.09e-05 | 73 |
| hsa04810112 | Esophagus | ESCC | Regulation of actin cytoskeleton | 133/4205 | 229/8465 | 5.94e-03 | 1.48e-02 | 7.56e-03 | 133 |
| hsa0481021 | Liver | Cirrhotic | Regulation of actin cytoskeleton | 100/2530 | 229/8465 | 5.28e-06 | 5.50e-05 | 3.39e-05 | 100 |
| hsa0413721 | Liver | Cirrhotic | Mitophagy - animal | 39/2530 | 72/8465 | 1.38e-05 | 1.24e-04 | 7.64e-05 | 39 |
| hsa041406 | Liver | Cirrhotic | Autophagy - animal | 65/2530 | 141/8465 | 3.10e-05 | 2.47e-04 | 1.52e-04 | 65 |
| hsa0520510 | Liver | Cirrhotic | Proteoglycans in cancer | 85/2530 | 205/8465 | 2.37e-04 | 1.58e-03 | 9.75e-04 | 85 |
| hsa042187 | Liver | Cirrhotic | Cellular senescence | 66/2530 | 156/8465 | 5.94e-04 | 3.60e-03 | 2.22e-03 | 66 |
| hsa0481031 | Liver | Cirrhotic | Regulation of actin cytoskeleton | 100/2530 | 229/8465 | 5.28e-06 | 5.50e-05 | 3.39e-05 | 100 |
| hsa0413731 | Liver | Cirrhotic | Mitophagy - animal | 39/2530 | 72/8465 | 1.38e-05 | 1.24e-04 | 7.64e-05 | 39 |
| hsa0414011 | Liver | Cirrhotic | Autophagy - animal | 65/2530 | 141/8465 | 3.10e-05 | 2.47e-04 | 1.52e-04 | 65 |
| Page: 1 2 3 4 5 |
Top |
Cell-cell communication analysis |
| Identification of potential cell-cell interactions between two cell types and their ligand-receptor pairs for different disease states |
| Ligand | Receptor | LRpair | Pathway | Tissue | Disease Stage |
| Page: 1 |
Top |
Single-cell gene regulatory network inference analysis |
| Find out the significant the regulons (TFs) and the target genes of each regulon across cell types for different disease states |
| TF | Cell Type | Tissue | Disease Stage | Target Gene | RSS | Regulon Activity |
| ∗The dot plots of a searched regulon are shown for all cell subpopulations in each disease state of each tissue based on the regulon specific score inferred using pySCENIC and by calculating the average expression. |
| Page: 1 |
Top |
Somatic mutation of malignant transformation related genes |
| Annotation of somatic variants for genes involved in malignant transformation |
| Hugo Symbol | Variant Class | Variant Classification | dbSNP RS | HGVSc | HGVSp | HGVSp Short | SWISSPROT | BIOTYPE | SIFT | PolyPhen | Tumor Sample Barcode | Tissue | Histology | Sex | Age | Stage | Therapy Types | Drugs | Outcome |
| RRAS2 | insertion | Frame_Shift_Ins | novel | c.217_218insGTAGG | p.Glu73GlyfsTer8 | p.E73Gfs*8 | P62070 | protein_coding | TCGA-AO-A128-01 | Breast | breast invasive carcinoma | Female | <65 | I/II | Chemotherapy | doxorubicin | SD | ||
| RRAS2 | SNV | Missense_Mutation | rs782490571 | c.349N>T | p.Arg117Cys | p.R117C | P62070 | protein_coding | tolerated(0.09) | probably_damaging(0.999) | TCGA-AA-3984-01 | Colorectum | colon adenocarcinoma | Female | <65 | I/II | Unknown | Unknown | SD |
| RRAS2 | SNV | Missense_Mutation | novel | c.472N>A | p.Ala158Thr | p.A158T | P62070 | protein_coding | deleterious(0) | probably_damaging(0.999) | TCGA-CA-6717-01 | Colorectum | colon adenocarcinoma | Male | <65 | I/II | Chemotherapy | oxaliplatin | CR |
| RRAS2 | SNV | Missense_Mutation | c.145N>T | p.Asp49Tyr | p.D49Y | P62070 | protein_coding | deleterious(0) | probably_damaging(0.987) | TCGA-AG-A002-01 | Colorectum | rectum adenocarcinoma | Male | <65 | I/II | Unknown | Unknown | SD | |
| RRAS2 | SNV | Missense_Mutation | c.499G>A | p.Ala167Thr | p.A167T | P62070 | protein_coding | deleterious(0.03) | possibly_damaging(0.868) | TCGA-CL-5918-01 | Colorectum | rectum adenocarcinoma | Female | >=65 | I/II | Unknown | Unknown | SD | |
| RRAS2 | SNV | Missense_Mutation | c.144N>C | p.Glu48Asp | p.E48D | P62070 | protein_coding | deleterious(0) | possibly_damaging(0.762) | TCGA-EI-6882-01 | Colorectum | rectum adenocarcinoma | Male | <65 | I/II | Unknown | Unknown | SD | |
| RRAS2 | SNV | Missense_Mutation | novel | c.583N>T | p.Asp195Tyr | p.D195Y | P62070 | protein_coding | deleterious(0.01) | benign(0.319) | TCGA-A5-A2K5-01 | Endometrium | uterine corpus endometrioid carcinoma | Female | >=65 | I/II | Unknown | Unknown | SD |
| RRAS2 | SNV | Missense_Mutation | rs113954997 | c.215A>T | p.Gln72Leu | p.Q72L | P62070 | protein_coding | deleterious(0) | possibly_damaging(0.717) | TCGA-AJ-A3EJ-01 | Endometrium | uterine corpus endometrioid carcinoma | Female | >=65 | III/IV | Unknown | Unknown | PD |
| RRAS2 | SNV | Missense_Mutation | novel | c.334N>A | p.Leu112Ile | p.L112I | P62070 | protein_coding | deleterious(0.04) | probably_damaging(0.998) | TCGA-AP-A056-01 | Endometrium | uterine corpus endometrioid carcinoma | Female | <65 | I/II | Unknown | Unknown | SD |
| RRAS2 | SNV | Missense_Mutation | rs782457908 | c.208N>A | p.Ala70Thr | p.A70T | P62070 | protein_coding | deleterious(0) | probably_damaging(0.967) | TCGA-AX-A1CE-01 | Endometrium | uterine corpus endometrioid carcinoma | Female | <65 | I/II | Unspecific | Paclitaxel | SD |
| Page: 1 2 3 4 |
Top |
Related drugs of malignant transformation related genes |
| Identification of chemicals and drugs interact with genes involved in malignant transfromation |
| (DGIdb 4.0) |
| Entrez ID | Symbol | Category | Interaction Types | Drug Claim Name | Drug Name | PMIDs |
| 22800 | RRAS2 | NA | tamoxifen | TAMOXIFEN | 19047159 |
| Page: 1 |

Copyright 2023-Present -The University of Texas Health Science Center at Houston |