
|
|||||
|
 | |
| |
| |
| |
| |
| |
|
Gene: RRAGB |
Gene summary for RRAGB |
| Gene information | Species | Human | Gene symbol | RRAGB | Gene ID | 10325 |
| Gene name | Ras related GTP binding B | |
| Gene Alias | RAGB | |
| Cytomap | Xp11.21 | |
| Gene Type | protein-coding | GO ID | GO:0001101 | UniProtAcc | Q5VZM2 |
Top |
Malignant transformation analysis |
| Identification of the aberrant gene expression in precancerous and cancerous lesions by comparing the gene expression of stem-like cells in diseased tissues with normal stem cells |
| Entrez ID | Symbol | Replicates | Species | Organ | Tissue | Adj P-value | Log2FC | Malignancy |
| 10325 | RRAGB | LZE4T | Human | Esophagus | ESCC | 1.21e-04 | 1.89e-01 | 0.0811 |
| 10325 | RRAGB | LZE7T | Human | Esophagus | ESCC | 3.86e-03 | 3.34e-01 | 0.0667 |
| 10325 | RRAGB | LZE24T | Human | Esophagus | ESCC | 3.15e-20 | 5.01e-01 | 0.0596 |
| 10325 | RRAGB | P1T-E | Human | Esophagus | ESCC | 8.47e-03 | 1.70e-01 | 0.0875 |
| 10325 | RRAGB | P2T-E | Human | Esophagus | ESCC | 9.74e-14 | 2.95e-01 | 0.1177 |
| 10325 | RRAGB | P4T-E | Human | Esophagus | ESCC | 5.78e-15 | 4.04e-01 | 0.1323 |
| 10325 | RRAGB | P5T-E | Human | Esophagus | ESCC | 1.30e-08 | 8.69e-02 | 0.1327 |
| 10325 | RRAGB | P8T-E | Human | Esophagus | ESCC | 6.60e-14 | 4.08e-01 | 0.0889 |
| 10325 | RRAGB | P9T-E | Human | Esophagus | ESCC | 5.70e-08 | 1.82e-01 | 0.1131 |
| 10325 | RRAGB | P10T-E | Human | Esophagus | ESCC | 1.32e-13 | 2.57e-01 | 0.116 |
| 10325 | RRAGB | P11T-E | Human | Esophagus | ESCC | 1.57e-04 | 2.61e-01 | 0.1426 |
| 10325 | RRAGB | P12T-E | Human | Esophagus | ESCC | 1.17e-28 | 5.58e-01 | 0.1122 |
| 10325 | RRAGB | P15T-E | Human | Esophagus | ESCC | 3.97e-02 | 1.64e-01 | 0.1149 |
| 10325 | RRAGB | P16T-E | Human | Esophagus | ESCC | 1.43e-21 | 4.21e-01 | 0.1153 |
| 10325 | RRAGB | P17T-E | Human | Esophagus | ESCC | 1.27e-02 | 2.21e-01 | 0.1278 |
| 10325 | RRAGB | P20T-E | Human | Esophagus | ESCC | 5.44e-08 | 2.91e-01 | 0.1124 |
| 10325 | RRAGB | P21T-E | Human | Esophagus | ESCC | 1.00e-07 | 9.55e-02 | 0.1617 |
| 10325 | RRAGB | P22T-E | Human | Esophagus | ESCC | 7.73e-30 | 5.84e-01 | 0.1236 |
| 10325 | RRAGB | P23T-E | Human | Esophagus | ESCC | 5.74e-12 | 3.23e-01 | 0.108 |
| 10325 | RRAGB | P26T-E | Human | Esophagus | ESCC | 1.75e-30 | 5.81e-01 | 0.1276 |
| Page: 1 2 3 |
| Tissue | Expression Dynamics | Abbreviation |
| Esophagus | 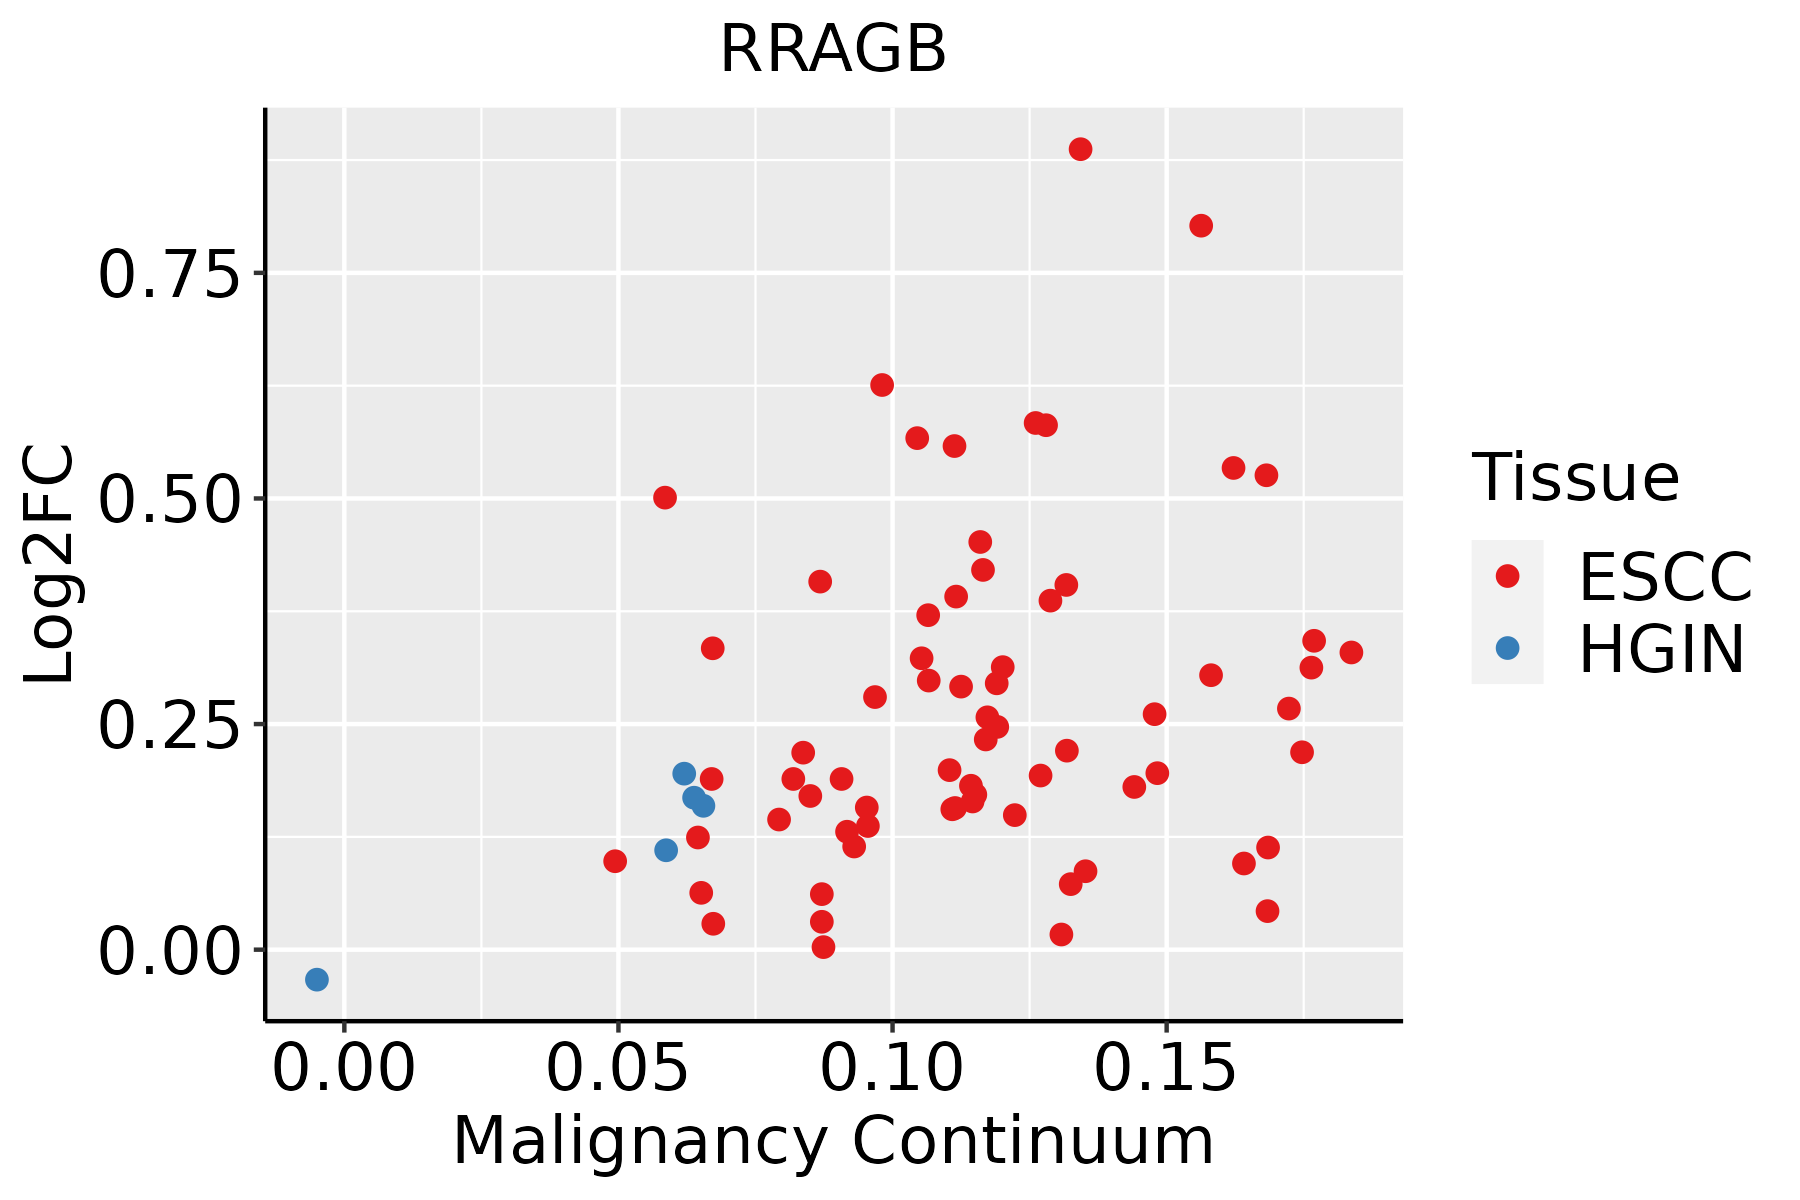 | ESCC: Esophageal squamous cell carcinoma |
| HGIN: High-grade intraepithelial neoplasias | ||
| LGIN: Low-grade intraepithelial neoplasias |
| ∗log2FC in expression of this searched gene in stem-like cells from each diseased tissue sample relative to stem-like cells in normal samples in each tissue plotted against the malignancy continuum. Samples are colored based on if they are from different disease stage. |
Top |
Malignant transformation related pathway analysis |
| Find out the enriched GO biological processes and KEGG pathways involved in transition from healthy to precancer to cancer |
| Tissue | Disease Stage | Enriched GO biological Processes |
| Colorectum | AD |  |
| Colorectum | SER |  |
| Colorectum | MSS |  |
| Colorectum | MSI-H |  |
| Colorectum | FAP |  |
| ∗Top 15 enriched GO BP terms are showed in the bar plot of each disease state in each tissue. Each row represents a significant GO biological process which is colored according to the -log10(p.adjust). |
| Page: 1 2 3 4 5 6 7 8 9 |
| GO ID | Tissue | Disease Stage | Description | Gene Ratio | Bg Ratio | pvalue | p.adjust | Count |
| GO:001050617 | Esophagus | ESCC | regulation of autophagy | 220/8552 | 317/18723 | 6.72e-18 | 6.36e-16 | 220 |
| GO:0071496111 | Esophagus | ESCC | cellular response to external stimulus | 215/8552 | 320/18723 | 4.29e-15 | 2.43e-13 | 215 |
| GO:0031668111 | Esophagus | ESCC | cellular response to extracellular stimulus | 168/8552 | 246/18723 | 4.93e-13 | 2.23e-11 | 168 |
| GO:0031669110 | Esophagus | ESCC | cellular response to nutrient levels | 148/8552 | 215/18723 | 4.58e-12 | 1.76e-10 | 148 |
| GO:0031667111 | Esophagus | ESCC | response to nutrient levels | 289/8552 | 474/18723 | 9.25e-12 | 3.47e-10 | 289 |
| GO:0009267110 | Esophagus | ESCC | cellular response to starvation | 110/8552 | 156/18723 | 2.63e-10 | 7.37e-09 | 110 |
| GO:004259419 | Esophagus | ESCC | response to starvation | 133/8552 | 197/18723 | 4.31e-10 | 1.14e-08 | 133 |
| GO:19909284 | Esophagus | ESCC | response to amino acid starvation | 37/8552 | 49/18723 | 2.05e-05 | 1.78e-04 | 37 |
| GO:00432007 | Esophagus | ESCC | response to amino acid | 74/8552 | 116/18723 | 6.23e-05 | 4.76e-04 | 74 |
| GO:000110110 | Esophagus | ESCC | response to acid chemical | 84/8552 | 135/18723 | 7.70e-05 | 5.74e-04 | 84 |
| GO:00319294 | Esophagus | ESCC | TOR signaling | 79/8552 | 126/18723 | 8.57e-05 | 6.21e-04 | 79 |
| GO:00341984 | Esophagus | ESCC | cellular response to amino acid starvation | 34/8552 | 46/18723 | 9.39e-05 | 6.70e-04 | 34 |
| GO:00712305 | Esophagus | ESCC | cellular response to amino acid stimulus | 48/8552 | 71/18723 | 1.55e-04 | 1.03e-03 | 48 |
| GO:00712296 | Esophagus | ESCC | cellular response to acid chemical | 52/8552 | 80/18723 | 3.79e-04 | 2.20e-03 | 52 |
| GO:00320061 | Esophagus | ESCC | regulation of TOR signaling | 63/8552 | 104/18723 | 1.55e-03 | 7.29e-03 | 63 |
| GO:00320082 | Esophagus | ESCC | positive regulation of TOR signaling | 31/8552 | 47/18723 | 4.01e-03 | 1.62e-02 | 31 |
| Page: 1 |
| Pathway ID | Tissue | Disease Stage | Description | Gene Ratio | Bg Ratio | pvalue | p.adjust | qvalue | Count |
| hsa05131211 | Esophagus | ESCC | Shigellosis | 176/4205 | 247/8465 | 2.27e-12 | 4.01e-11 | 2.05e-11 | 176 |
| hsa0414010 | Esophagus | ESCC | Autophagy - animal | 101/4205 | 141/8465 | 7.60e-08 | 6.21e-07 | 3.18e-07 | 101 |
| hsa041505 | Esophagus | ESCC | mTOR signaling pathway | 98/4205 | 156/8465 | 5.81e-04 | 1.95e-03 | 9.97e-04 | 98 |
| hsa05131310 | Esophagus | ESCC | Shigellosis | 176/4205 | 247/8465 | 2.27e-12 | 4.01e-11 | 2.05e-11 | 176 |
| hsa0414015 | Esophagus | ESCC | Autophagy - animal | 101/4205 | 141/8465 | 7.60e-08 | 6.21e-07 | 3.18e-07 | 101 |
| hsa0415013 | Esophagus | ESCC | mTOR signaling pathway | 98/4205 | 156/8465 | 5.81e-04 | 1.95e-03 | 9.97e-04 | 98 |
| Page: 1 |
Top |
Cell-cell communication analysis |
| Identification of potential cell-cell interactions between two cell types and their ligand-receptor pairs for different disease states |
| Ligand | Receptor | LRpair | Pathway | Tissue | Disease Stage |
| Page: 1 |
Top |
Single-cell gene regulatory network inference analysis |
| Find out the significant the regulons (TFs) and the target genes of each regulon across cell types for different disease states |
| TF | Cell Type | Tissue | Disease Stage | Target Gene | RSS | Regulon Activity |
| ∗The dot plots of a searched regulon are shown for all cell subpopulations in each disease state of each tissue based on the regulon specific score inferred using pySCENIC and by calculating the average expression. |
| Page: 1 |
Top |
Somatic mutation of malignant transformation related genes |
| Annotation of somatic variants for genes involved in malignant transformation |
| Hugo Symbol | Variant Class | Variant Classification | dbSNP RS | HGVSc | HGVSp | HGVSp Short | SWISSPROT | BIOTYPE | SIFT | PolyPhen | Tumor Sample Barcode | Tissue | Histology | Sex | Age | Stage | Therapy Types | Drugs | Outcome |
| RRAGB | SNV | Missense_Mutation | c.212N>A | p.Arg71His | p.R71H | Q5VZM2 | protein_coding | deleterious(0) | benign(0.117) | TCGA-2W-A8YY-01 | Cervix | cervical & endocervical cancer | Female | <65 | I/II | Chemotherapy | cisplatin | CR | |
| RRAGB | SNV | Missense_Mutation | c.863N>A | p.Arg288Lys | p.R288K | Q5VZM2 | protein_coding | deleterious(0.03) | probably_damaging(0.923) | TCGA-C5-A7UI-01 | Cervix | cervical & endocervical cancer | Female | <65 | I/II | Unknown | Unknown | SD | |
| RRAGB | SNV | Missense_Mutation | c.440N>C | p.Glu147Ala | p.E147A | Q5VZM2 | protein_coding | tolerated(0.33) | benign(0.123) | TCGA-A6-2686-01 | Colorectum | colon adenocarcinoma | Female | >=65 | I/II | Unknown | Unknown | SD | |
| RRAGB | SNV | Missense_Mutation | c.1019N>T | p.Pro340Leu | p.P340L | Q5VZM2 | protein_coding | deleterious(0.04) | benign(0.02) | TCGA-A6-6781-01 | Colorectum | colon adenocarcinoma | Male | <65 | III/IV | Chemotherapy | oxaliplatin | SD | |
| RRAGB | SNV | Missense_Mutation | c.827N>A | p.Ser276Tyr | p.S276Y | Q5VZM2 | protein_coding | deleterious(0) | probably_damaging(0.967) | TCGA-AA-3510-01 | Colorectum | colon adenocarcinoma | Male | >=65 | I/II | Unknown | Unknown | SD | |
| RRAGB | SNV | Missense_Mutation | c.1097N>A | p.Gly366Glu | p.G366E | Q5VZM2 | protein_coding | tolerated(0.08) | benign(0.006) | TCGA-AA-3715-01 | Colorectum | colon adenocarcinoma | Male | >=65 | I/II | Unknown | Unknown | PD | |
| RRAGB | SNV | Missense_Mutation | rs765179529 | c.850N>T | p.Arg284Cys | p.R284C | Q5VZM2 | protein_coding | deleterious(0.04) | possibly_damaging(0.892) | TCGA-AA-A010-01 | Colorectum | colon adenocarcinoma | Female | <65 | I/II | Chemotherapy | folinic | CR |
| RRAGB | SNV | Missense_Mutation | c.1093N>C | p.Asp365His | p.D365H | Q5VZM2 | protein_coding | deleterious(0.02) | possibly_damaging(0.569) | TCGA-AA-A01D-01 | Colorectum | colon adenocarcinoma | Female | <65 | III/IV | Chemotherapy | capecitabine | PD | |
| RRAGB | SNV | Missense_Mutation | c.264N>A | p.Ser88Arg | p.S88R | Q5VZM2 | protein_coding | tolerated_low_confidence(0.07) | benign(0) | TCGA-AD-6895-01 | Colorectum | colon adenocarcinoma | Male | >=65 | III/IV | Unknown | Unknown | SD | |
| RRAGB | SNV | Missense_Mutation | c.863G>T | p.Arg288Ile | p.R288I | Q5VZM2 | protein_coding | deleterious(0) | probably_damaging(0.999) | TCGA-CA-6717-01 | Colorectum | colon adenocarcinoma | Male | <65 | I/II | Chemotherapy | oxaliplatin | CR |
| Page: 1 2 3 4 5 6 |
Top |
Related drugs of malignant transformation related genes |
| Identification of chemicals and drugs interact with genes involved in malignant transfromation |
| (DGIdb 4.0) |
| Entrez ID | Symbol | Category | Interaction Types | Drug Claim Name | Drug Name | PMIDs |
| Page: 1 |

Copyright 2023-Present -The University of Texas Health Science Center at Houston |