
|
|||||
|
 | |
| |
| |
| |
| |
| |
|
Gene: RRAD |
Gene summary for RRAD |
| Gene information | Species | Human | Gene symbol | RRAD | Gene ID | 6236 |
| Gene name | RRAD, Ras related glycolysis inhibitor and calcium channel regulator | |
| Gene Alias | RAD | |
| Cytomap | 16q22.1 | |
| Gene Type | protein-coding | GO ID | GO:0006810 | UniProtAcc | A0A024R6X0 |
Top |
Malignant transformation analysis |
| Identification of the aberrant gene expression in precancerous and cancerous lesions by comparing the gene expression of stem-like cells in diseased tissues with normal stem cells |
| Entrez ID | Symbol | Replicates | Species | Organ | Tissue | Adj P-value | Log2FC | Malignancy |
| 6236 | RRAD | P4T-E | Human | Esophagus | ESCC | 2.28e-06 | 5.50e-01 | 0.1323 |
| 6236 | RRAD | P8T-E | Human | Esophagus | ESCC | 2.55e-08 | 3.74e-01 | 0.0889 |
| 6236 | RRAD | P11T-E | Human | Esophagus | ESCC | 9.49e-13 | 1.28e+00 | 0.1426 |
| 6236 | RRAD | P17T-E | Human | Esophagus | ESCC | 6.82e-03 | 2.40e-01 | 0.1278 |
| 6236 | RRAD | P28T-E | Human | Esophagus | ESCC | 3.07e-21 | 1.14e+00 | 0.1149 |
| 6236 | RRAD | P44T-E | Human | Esophagus | ESCC | 4.26e-02 | 3.65e-01 | 0.1096 |
| 6236 | RRAD | P75T-E | Human | Esophagus | ESCC | 1.24e-18 | 9.64e-01 | 0.1125 |
| 6236 | RRAD | P130T-E | Human | Esophagus | ESCC | 2.99e-24 | 1.47e+00 | 0.1676 |
| 6236 | RRAD | HCC2 | Human | Liver | HCC | 3.50e-03 | 3.52e+00 | 0.5341 |
| 6236 | RRAD | S014 | Human | Liver | HCC | 5.32e-03 | 4.51e-01 | 0.2254 |
| 6236 | RRAD | S027 | Human | Liver | HCC | 9.64e-14 | 1.85e+00 | 0.2446 |
| 6236 | RRAD | S028 | Human | Liver | HCC | 1.18e-17 | 1.53e+00 | 0.2503 |
| 6236 | RRAD | S029 | Human | Liver | HCC | 7.04e-23 | 2.07e+00 | 0.2581 |
| 6236 | RRAD | TD9 | Human | Lung | IAC | 9.80e-09 | 1.47e+00 | 0.088 |
| 6236 | RRAD | RNA-P10T2-P10T2-1 | Human | Lung | AAH | 4.11e-02 | 8.93e-01 | -0.1271 |
| 6236 | RRAD | RNA-P10T2-P10T2-2 | Human | Lung | AAH | 4.84e-02 | 9.33e-01 | -0.1406 |
| 6236 | RRAD | RNA-P10T2-P10T2-3 | Human | Lung | AAH | 4.09e-04 | 1.01e+00 | -0.1408 |
| 6236 | RRAD | RNA-P25T1-P25T1-1 | Human | Lung | AIS | 8.73e-03 | 4.27e-01 | -0.2116 |
| 6236 | RRAD | RNA-P7T1-P7T1-2 | Human | Lung | AIS | 3.86e-02 | 5.87e-01 | -0.0876 |
| 6236 | RRAD | RNA-P7T1-P7T1-4 | Human | Lung | AIS | 5.93e-05 | 6.91e-01 | -0.0809 |
| Page: 1 2 |
| Tissue | Expression Dynamics | Abbreviation |
| Esophagus | 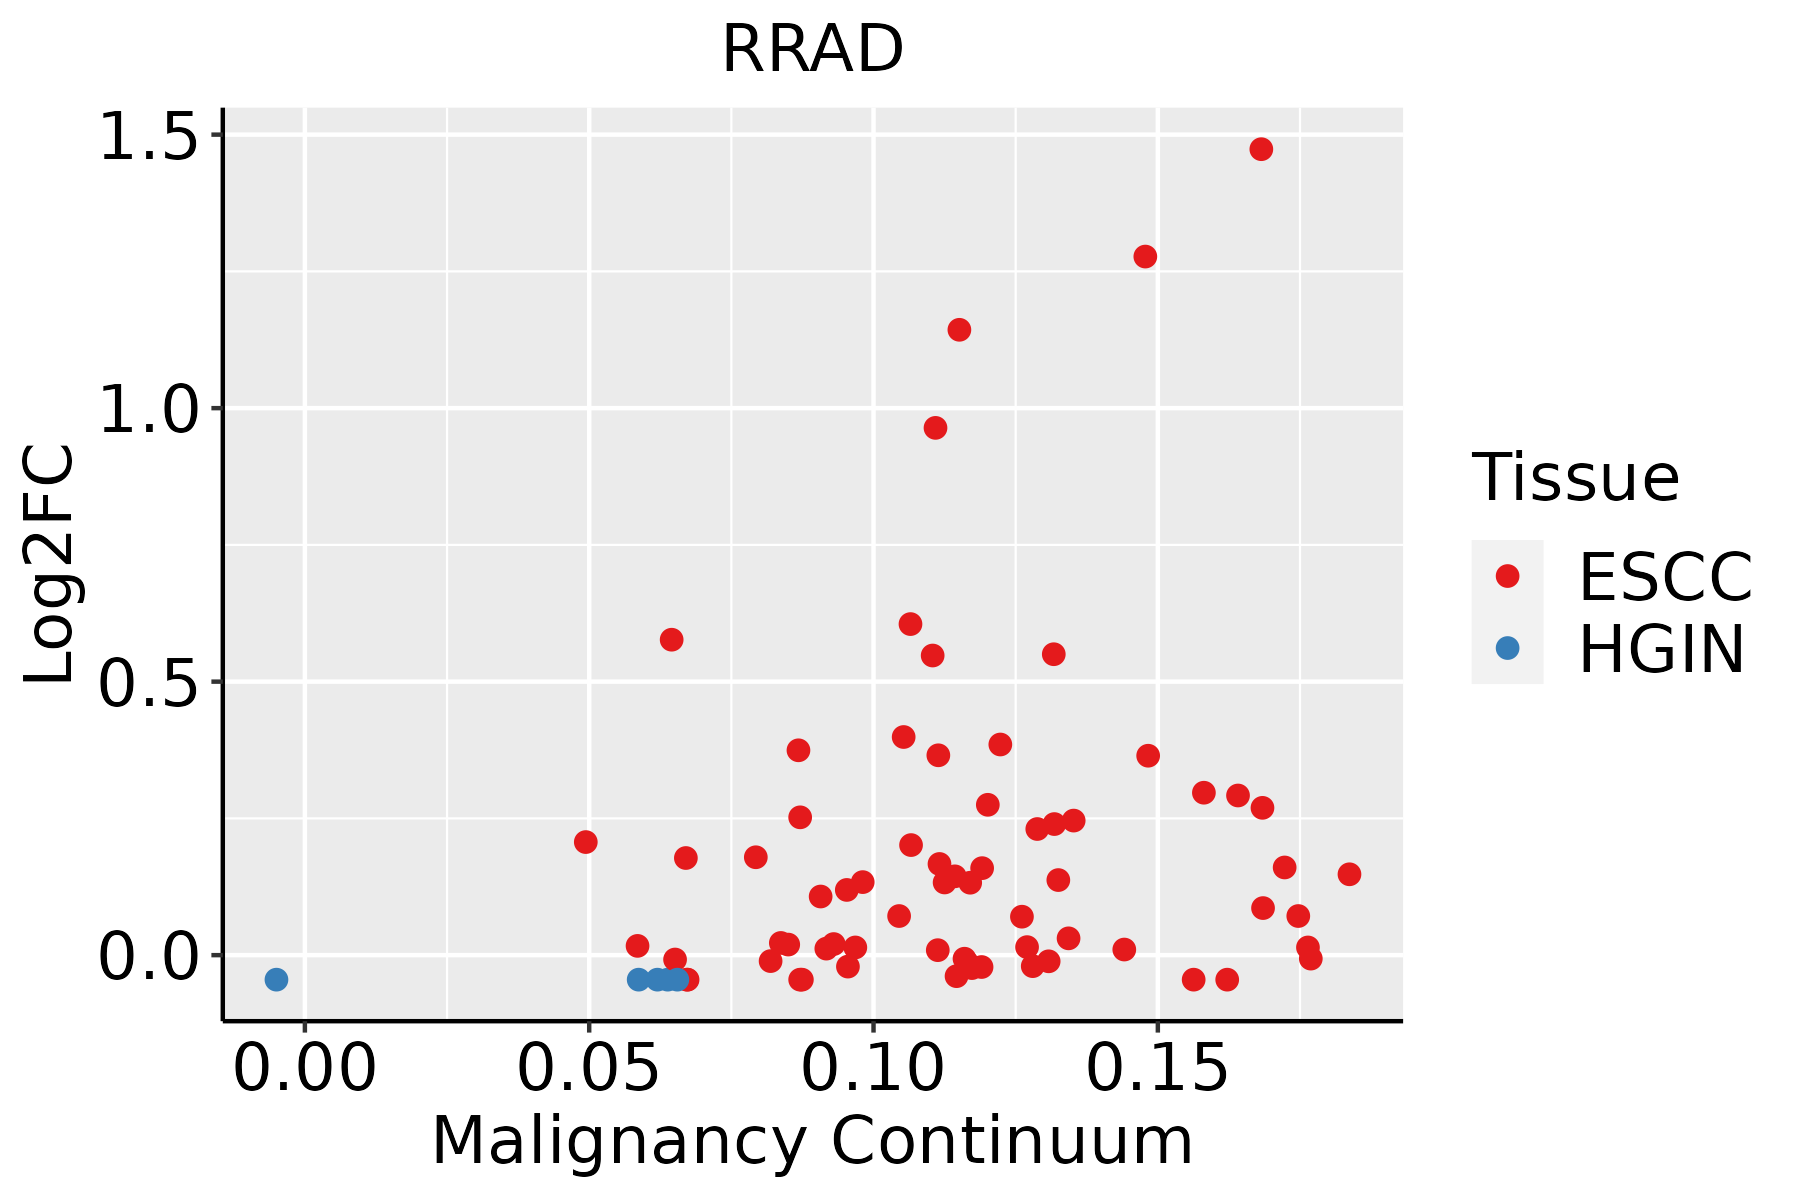 | ESCC: Esophageal squamous cell carcinoma |
| HGIN: High-grade intraepithelial neoplasias | ||
| LGIN: Low-grade intraepithelial neoplasias | ||
| Liver | 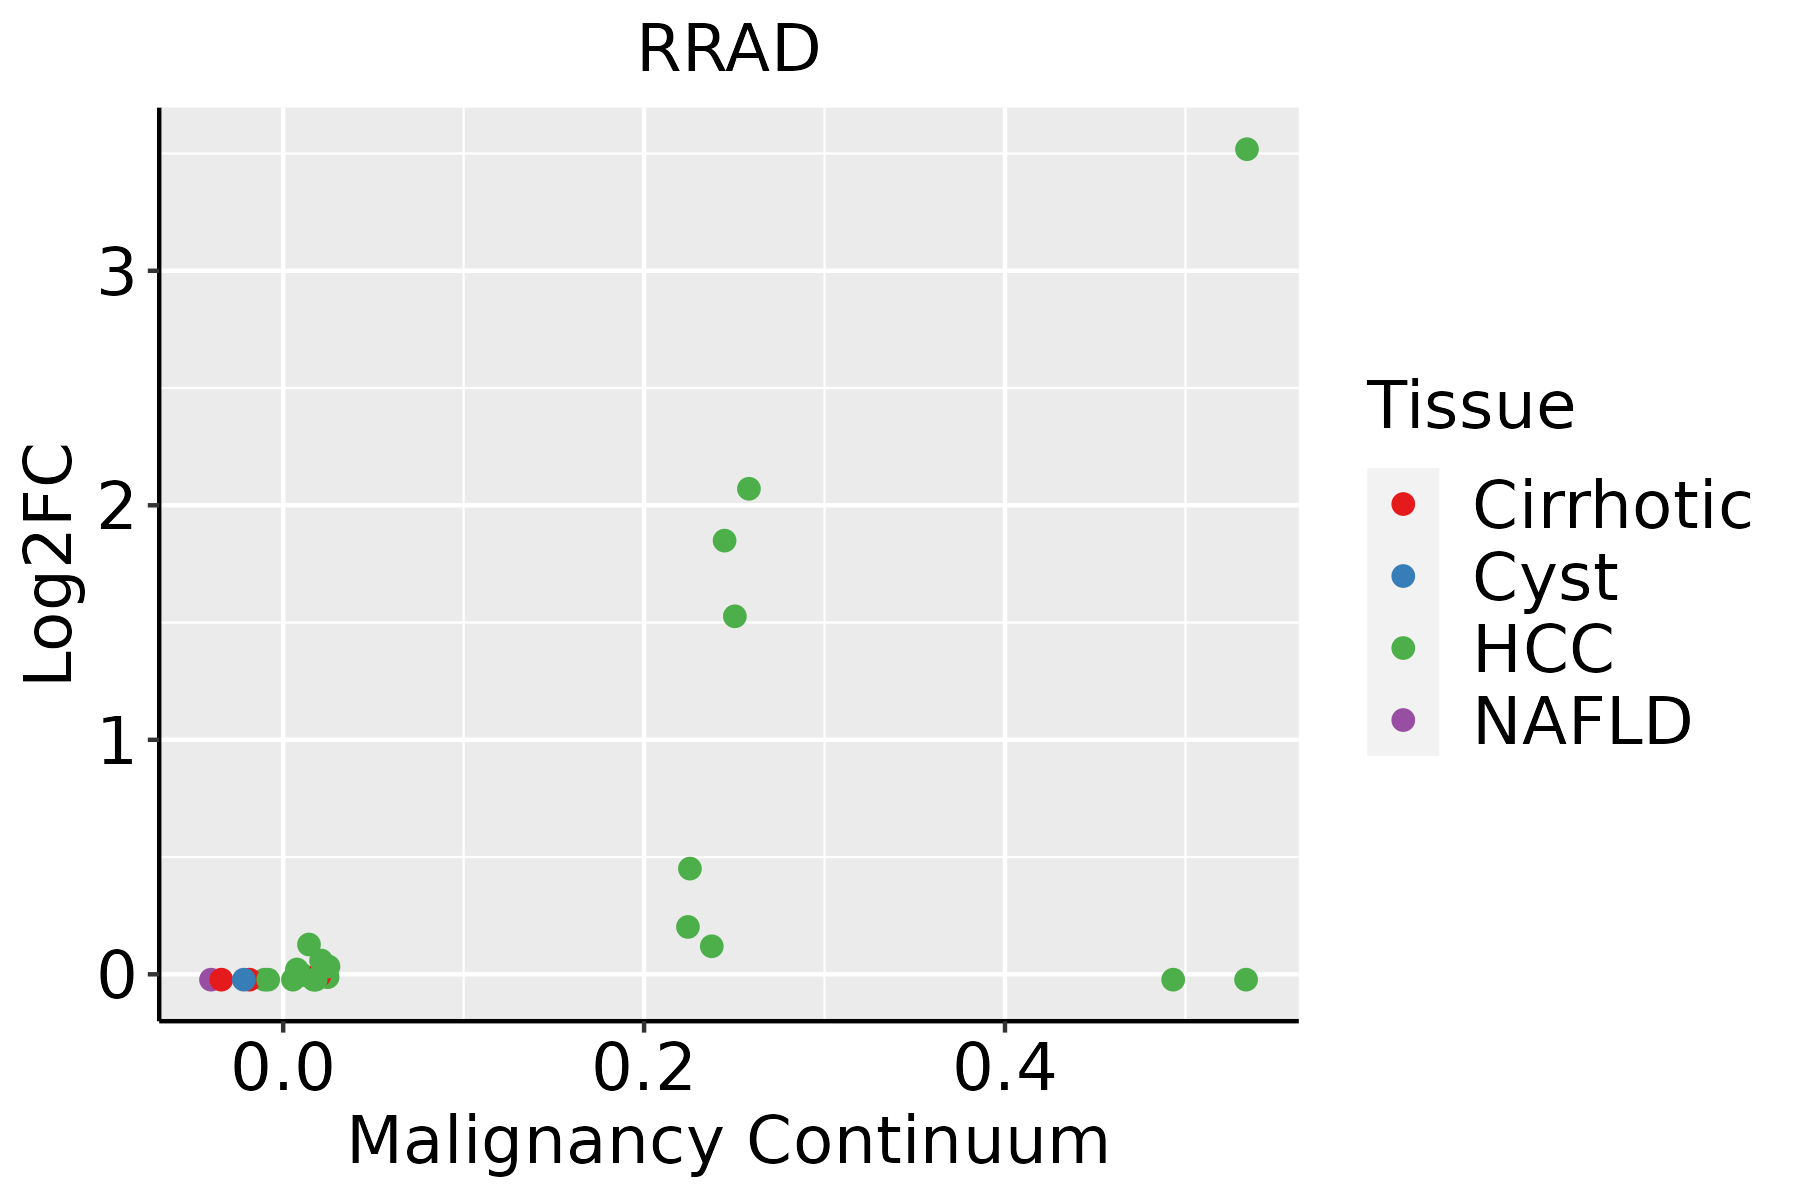 | HCC: Hepatocellular carcinoma |
| NAFLD: Non-alcoholic fatty liver disease | ||
| Lung | 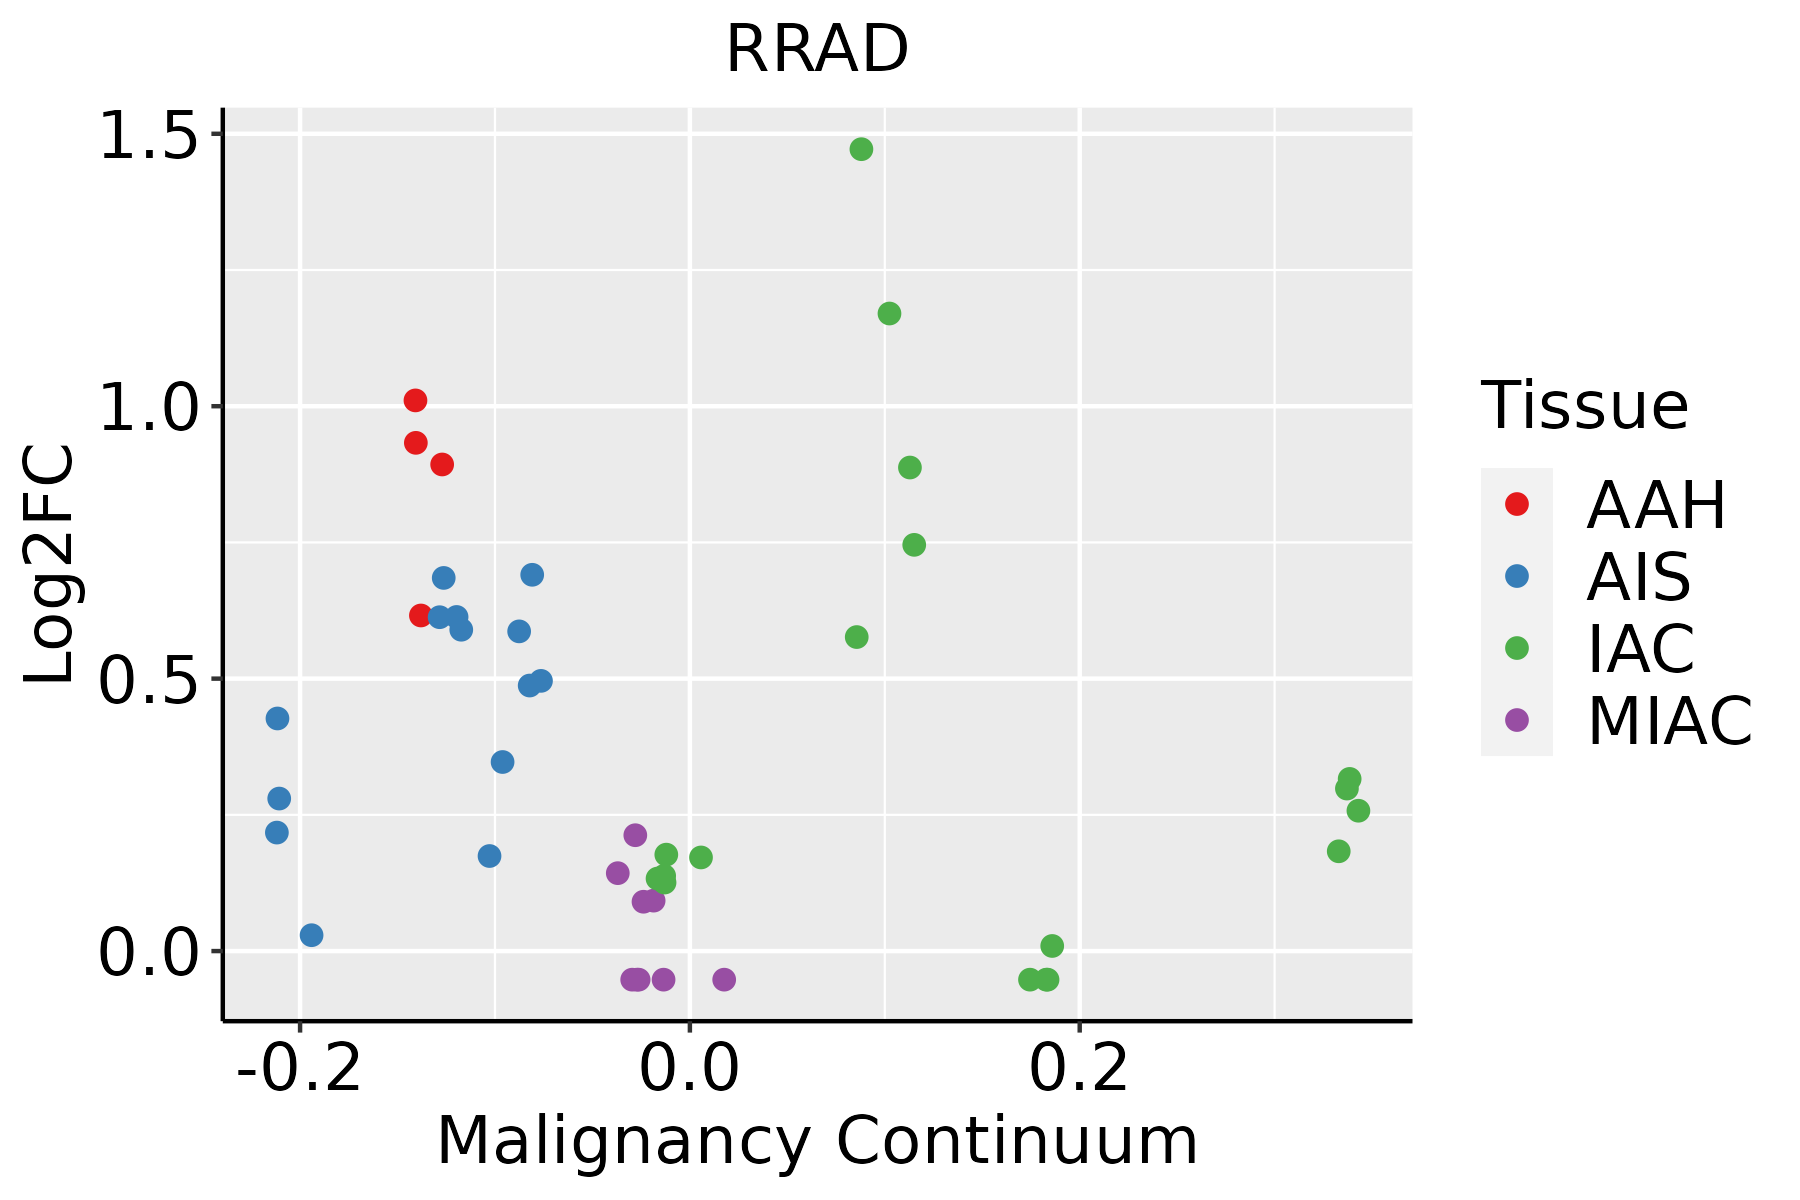 | AAH: Atypical adenomatous hyperplasia |
| AIS: Adenocarcinoma in situ | ||
| IAC: Invasive lung adenocarcinoma | ||
| MIA: Minimally invasive adenocarcinoma | ||
| Oral Cavity |  | EOLP: Erosive Oral lichen planus |
| LP: leukoplakia | ||
| NEOLP: Non-erosive oral lichen planus | ||
| OSCC: Oral squamous cell carcinoma | ||
| Thyroid | 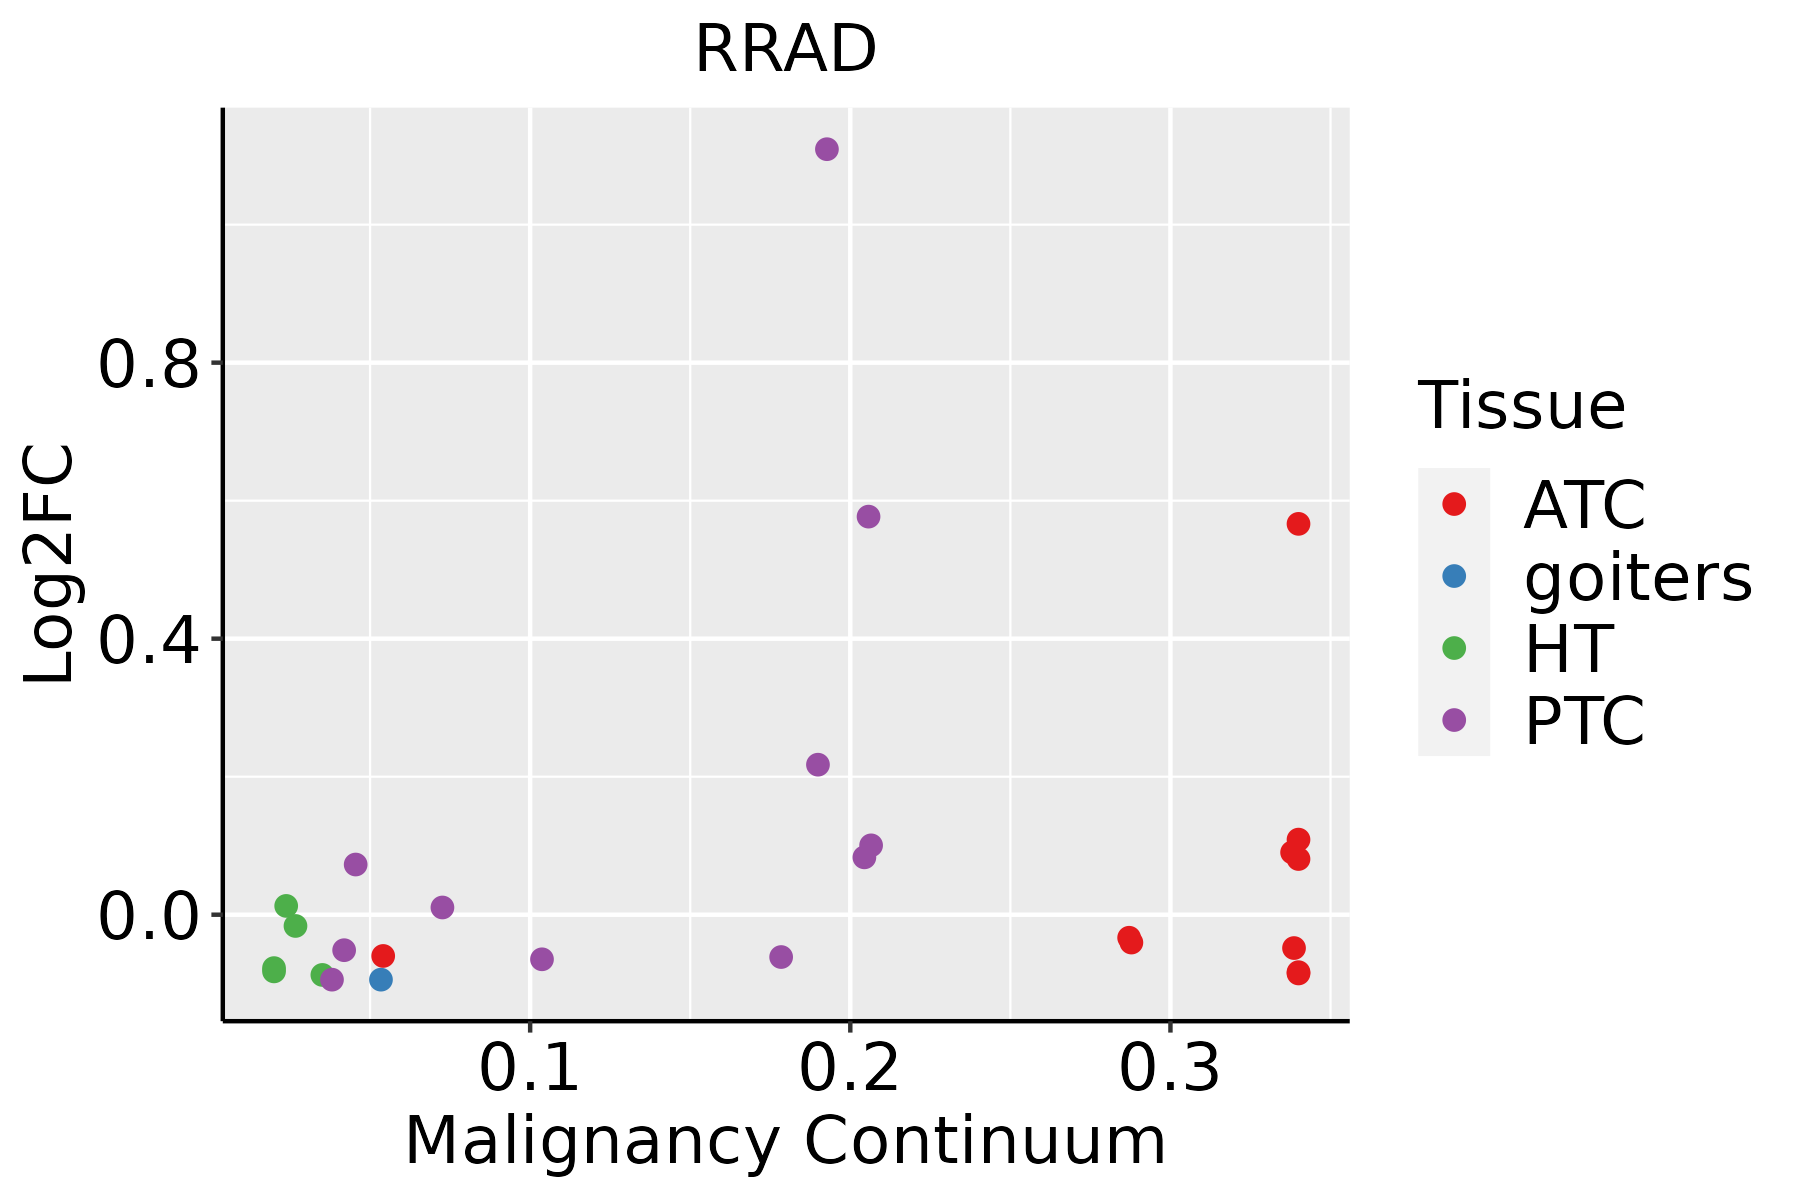 | ATC: Anaplastic thyroid cancer |
| HT: Hashimoto's thyroiditis | ||
| PTC: Papillary thyroid cancer |
| ∗log2FC in expression of this searched gene in stem-like cells from each diseased tissue sample relative to stem-like cells in normal samples in each tissue plotted against the malignancy continuum. Samples are colored based on if they are from different disease stage. |
Top |
Malignant transformation related pathway analysis |
| Find out the enriched GO biological processes and KEGG pathways involved in transition from healthy to precancer to cancer |
| Tissue | Disease Stage | Enriched GO biological Processes |
| Colorectum | AD |  |
| Colorectum | SER |  |
| Colorectum | MSS |  |
| Colorectum | MSI-H |  |
| Colorectum | FAP |  |
| ∗Top 15 enriched GO BP terms are showed in the bar plot of each disease state in each tissue. Each row represents a significant GO biological process which is colored according to the -log10(p.adjust). |
| Page: 1 2 3 4 5 6 7 8 9 |
| GO ID | Tissue | Disease Stage | Description | Gene Ratio | Bg Ratio | pvalue | p.adjust | Count |
| GO:00324124 | Lung | IAC | regulation of ion transmembrane transporter activity | 45/2061 | 267/18723 | 2.43e-03 | 2.33e-02 | 45 |
| GO:00228984 | Lung | IAC | regulation of transmembrane transporter activity | 46/2061 | 278/18723 | 3.16e-03 | 2.75e-02 | 46 |
| GO:00324095 | Lung | IAC | regulation of transporter activity | 49/2061 | 310/18723 | 5.93e-03 | 4.30e-02 | 49 |
| GO:19040622 | Lung | IAC | regulation of cation transmembrane transport | 55/2061 | 357/18723 | 6.36e-03 | 4.52e-02 | 55 |
| GO:00109595 | Lung | IAC | regulation of metal ion transport | 61/2061 | 406/18723 | 7.31e-03 | 4.98e-02 | 61 |
| GO:003241211 | Lung | AIS | regulation of ion transmembrane transporter activity | 42/1849 | 267/18723 | 1.65e-03 | 1.89e-02 | 42 |
| GO:002289811 | Lung | AIS | regulation of transmembrane transporter activity | 43/1849 | 278/18723 | 2.04e-03 | 2.24e-02 | 43 |
| GO:001095912 | Lung | AIS | regulation of metal ion transport | 58/1849 | 406/18723 | 2.63e-03 | 2.67e-02 | 58 |
| GO:003240911 | Lung | AIS | regulation of transporter activity | 45/1849 | 310/18723 | 5.54e-03 | 4.71e-02 | 45 |
| GO:0006816 | Lung | AIS | calcium ion transport | 58/1849 | 422/18723 | 6.08e-03 | 4.98e-02 | 58 |
| GO:003241221 | Lung | AAH | regulation of ion transmembrane transporter activity | 19/613 | 267/18723 | 1.33e-03 | 3.62e-02 | 19 |
| GO:002289821 | Lung | AAH | regulation of transmembrane transporter activity | 19/613 | 278/18723 | 2.11e-03 | 4.61e-02 | 19 |
| GO:00510517 | Oral cavity | EOLP | negative regulation of transport | 80/2218 | 470/18723 | 5.11e-04 | 4.44e-03 | 80 |
| GO:005105113 | Oral cavity | NEOLP | negative regulation of transport | 72/2005 | 470/18723 | 1.14e-03 | 8.49e-03 | 72 |
| GO:00109598 | Oral cavity | NEOLP | regulation of metal ion transport | 59/2005 | 406/18723 | 9.36e-03 | 4.44e-02 | 59 |
| GO:00510518 | Thyroid | PTC | negative regulation of transport | 176/5968 | 470/18723 | 5.44e-03 | 2.49e-02 | 176 |
| GO:005105114 | Thyroid | ATC | negative regulation of transport | 183/6293 | 470/18723 | 8.12e-03 | 3.13e-02 | 183 |
| Page: 1 |
| Pathway ID | Tissue | Disease Stage | Description | Gene Ratio | Bg Ratio | pvalue | p.adjust | qvalue | Count |
| Page: 1 |
Top |
Cell-cell communication analysis |
| Identification of potential cell-cell interactions between two cell types and their ligand-receptor pairs for different disease states |
| Ligand | Receptor | LRpair | Pathway | Tissue | Disease Stage |
| Page: 1 |
Top |
Single-cell gene regulatory network inference analysis |
| Find out the significant the regulons (TFs) and the target genes of each regulon across cell types for different disease states |
| TF | Cell Type | Tissue | Disease Stage | Target Gene | RSS | Regulon Activity |
| ∗The dot plots of a searched regulon are shown for all cell subpopulations in each disease state of each tissue based on the regulon specific score inferred using pySCENIC and by calculating the average expression. |
| Page: 1 |
Top |
Somatic mutation of malignant transformation related genes |
| Annotation of somatic variants for genes involved in malignant transformation |
| Hugo Symbol | Variant Class | Variant Classification | dbSNP RS | HGVSc | HGVSp | HGVSp Short | SWISSPROT | BIOTYPE | SIFT | PolyPhen | Tumor Sample Barcode | Tissue | Histology | Sex | Age | Stage | Therapy Types | Drugs | Outcome |
| RRAD | SNV | Missense_Mutation | novel | c.267N>C | p.Glu89Asp | p.E89D | P55042 | protein_coding | tolerated(0.59) | benign(0) | TCGA-BH-A0B6-01 | Breast | breast invasive carcinoma | Female | <65 | I/II | Unknown | Unknown | SD |
| RRAD | SNV | Missense_Mutation | c.380N>G | p.Tyr127Cys | p.Y127C | P55042 | protein_coding | tolerated(0.05) | probably_damaging(0.982) | TCGA-E2-A15L-01 | Breast | breast invasive carcinoma | Female | >=65 | I/II | Hormone Therapy | arimidex | SD | |
| RRAD | SNV | Missense_Mutation | rs774899242 | c.812G>A | p.Arg271Gln | p.R271Q | P55042 | protein_coding | deleterious(0.02) | probably_damaging(0.923) | TCGA-2W-A8YY-01 | Cervix | cervical & endocervical cancer | Female | <65 | I/II | Chemotherapy | cisplatin | CR |
| RRAD | SNV | Missense_Mutation | novel | c.580G>A | p.Asp194Asn | p.D194N | P55042 | protein_coding | tolerated(0.07) | benign(0.285) | TCGA-2W-A8YY-01 | Cervix | cervical & endocervical cancer | Female | <65 | I/II | Chemotherapy | cisplatin | CR |
| RRAD | SNV | Missense_Mutation | rs774899242 | c.812N>A | p.Arg271Gln | p.R271Q | P55042 | protein_coding | deleterious(0.02) | probably_damaging(0.923) | TCGA-DG-A2KM-01 | Cervix | cervical & endocervical cancer | Female | <65 | I/II | Chemotherapy | cisplatin | SD |
| RRAD | SNV | Missense_Mutation | c.532N>C | p.Glu178Gln | p.E178Q | P55042 | protein_coding | tolerated(0.11) | probably_damaging(0.999) | TCGA-IR-A3LK-01 | Cervix | cervical & endocervical cancer | Female | >=65 | I/II | Chemotherapy | cisplatin | PD | |
| RRAD | SNV | Missense_Mutation | novel | c.333N>A | p.Phe111Leu | p.F111L | P55042 | protein_coding | deleterious(0.01) | benign(0.425) | TCGA-LP-A4AV-01 | Cervix | cervical & endocervical cancer | Female | <65 | I/II | Unknown | Unknown | SD |
| RRAD | SNV | Missense_Mutation | c.833N>A | p.Ala278Glu | p.A278E | P55042 | protein_coding | deleterious(0) | probably_damaging(0.999) | TCGA-AA-3846-01 | Colorectum | colon adenocarcinoma | Female | >=65 | I/II | Unknown | Unknown | SD | |
| RRAD | SNV | Missense_Mutation | rs757648876 | c.572G>A | p.Arg191Gln | p.R191Q | P55042 | protein_coding | deleterious(0) | probably_damaging(0.998) | TCGA-AA-3947-01 | Colorectum | colon adenocarcinoma | Female | <65 | I/II | Unknown | Unknown | SD |
| RRAD | SNV | Missense_Mutation | c.839N>A | p.Arg280His | p.R280H | P55042 | protein_coding | deleterious(0.04) | probably_damaging(0.997) | TCGA-AD-6965-01 | Colorectum | colon adenocarcinoma | Male | <65 | III/IV | Chemotherapy | oxaliplatin | PD |
| Page: 1 2 3 |
Top |
Related drugs of malignant transformation related genes |
| Identification of chemicals and drugs interact with genes involved in malignant transfromation |
| (DGIdb 4.0) |
| Entrez ID | Symbol | Category | Interaction Types | Drug Claim Name | Drug Name | PMIDs |
| Page: 1 |

Copyright 2023-Present -The University of Texas Health Science Center at Houston |