
|
|||||
|
 | |
| |
| |
| |
| |
| |
|
Gene: RPUSD4 |
Gene summary for RPUSD4 |
| Gene information | Species | Human | Gene symbol | RPUSD4 | Gene ID | 84881 |
| Gene name | RNA pseudouridine synthase D4 | |
| Gene Alias | RPUSD4 | |
| Cytomap | 11q24.2 | |
| Gene Type | protein-coding | GO ID | GO:0000154 | UniProtAcc | Q96CM3 |
Top |
Malignant transformation analysis |
| Identification of the aberrant gene expression in precancerous and cancerous lesions by comparing the gene expression of stem-like cells in diseased tissues with normal stem cells |
| Entrez ID | Symbol | Replicates | Species | Organ | Tissue | Adj P-value | Log2FC | Malignancy |
| 84881 | RPUSD4 | LZE24T | Human | Esophagus | ESCC | 1.36e-11 | 2.20e-01 | 0.0596 |
| 84881 | RPUSD4 | P2T-E | Human | Esophagus | ESCC | 1.79e-13 | 8.86e-02 | 0.1177 |
| 84881 | RPUSD4 | P4T-E | Human | Esophagus | ESCC | 6.85e-22 | 5.51e-01 | 0.1323 |
| 84881 | RPUSD4 | P5T-E | Human | Esophagus | ESCC | 3.05e-13 | 1.34e-01 | 0.1327 |
| 84881 | RPUSD4 | P8T-E | Human | Esophagus | ESCC | 2.99e-06 | 6.87e-02 | 0.0889 |
| 84881 | RPUSD4 | P10T-E | Human | Esophagus | ESCC | 6.26e-13 | 8.96e-02 | 0.116 |
| 84881 | RPUSD4 | P11T-E | Human | Esophagus | ESCC | 1.06e-08 | 3.05e-01 | 0.1426 |
| 84881 | RPUSD4 | P12T-E | Human | Esophagus | ESCC | 6.08e-18 | 2.83e-01 | 0.1122 |
| 84881 | RPUSD4 | P15T-E | Human | Esophagus | ESCC | 7.51e-09 | 1.44e-01 | 0.1149 |
| 84881 | RPUSD4 | P16T-E | Human | Esophagus | ESCC | 4.86e-25 | 2.16e-01 | 0.1153 |
| 84881 | RPUSD4 | P20T-E | Human | Esophagus | ESCC | 6.22e-09 | 1.05e-01 | 0.1124 |
| 84881 | RPUSD4 | P21T-E | Human | Esophagus | ESCC | 9.28e-25 | 3.86e-01 | 0.1617 |
| 84881 | RPUSD4 | P22T-E | Human | Esophagus | ESCC | 4.55e-06 | 4.72e-02 | 0.1236 |
| 84881 | RPUSD4 | P23T-E | Human | Esophagus | ESCC | 1.47e-11 | 1.86e-01 | 0.108 |
| 84881 | RPUSD4 | P24T-E | Human | Esophagus | ESCC | 1.56e-15 | 8.14e-02 | 0.1287 |
| 84881 | RPUSD4 | P26T-E | Human | Esophagus | ESCC | 8.02e-19 | 3.12e-01 | 0.1276 |
| 84881 | RPUSD4 | P27T-E | Human | Esophagus | ESCC | 9.71e-11 | 1.21e-01 | 0.1055 |
| 84881 | RPUSD4 | P28T-E | Human | Esophagus | ESCC | 2.84e-08 | 5.41e-02 | 0.1149 |
| 84881 | RPUSD4 | P30T-E | Human | Esophagus | ESCC | 1.01e-10 | 3.63e-01 | 0.137 |
| 84881 | RPUSD4 | P31T-E | Human | Esophagus | ESCC | 1.18e-14 | 2.68e-01 | 0.1251 |
| Page: 1 2 3 4 |
| Tissue | Expression Dynamics | Abbreviation |
| Esophagus | 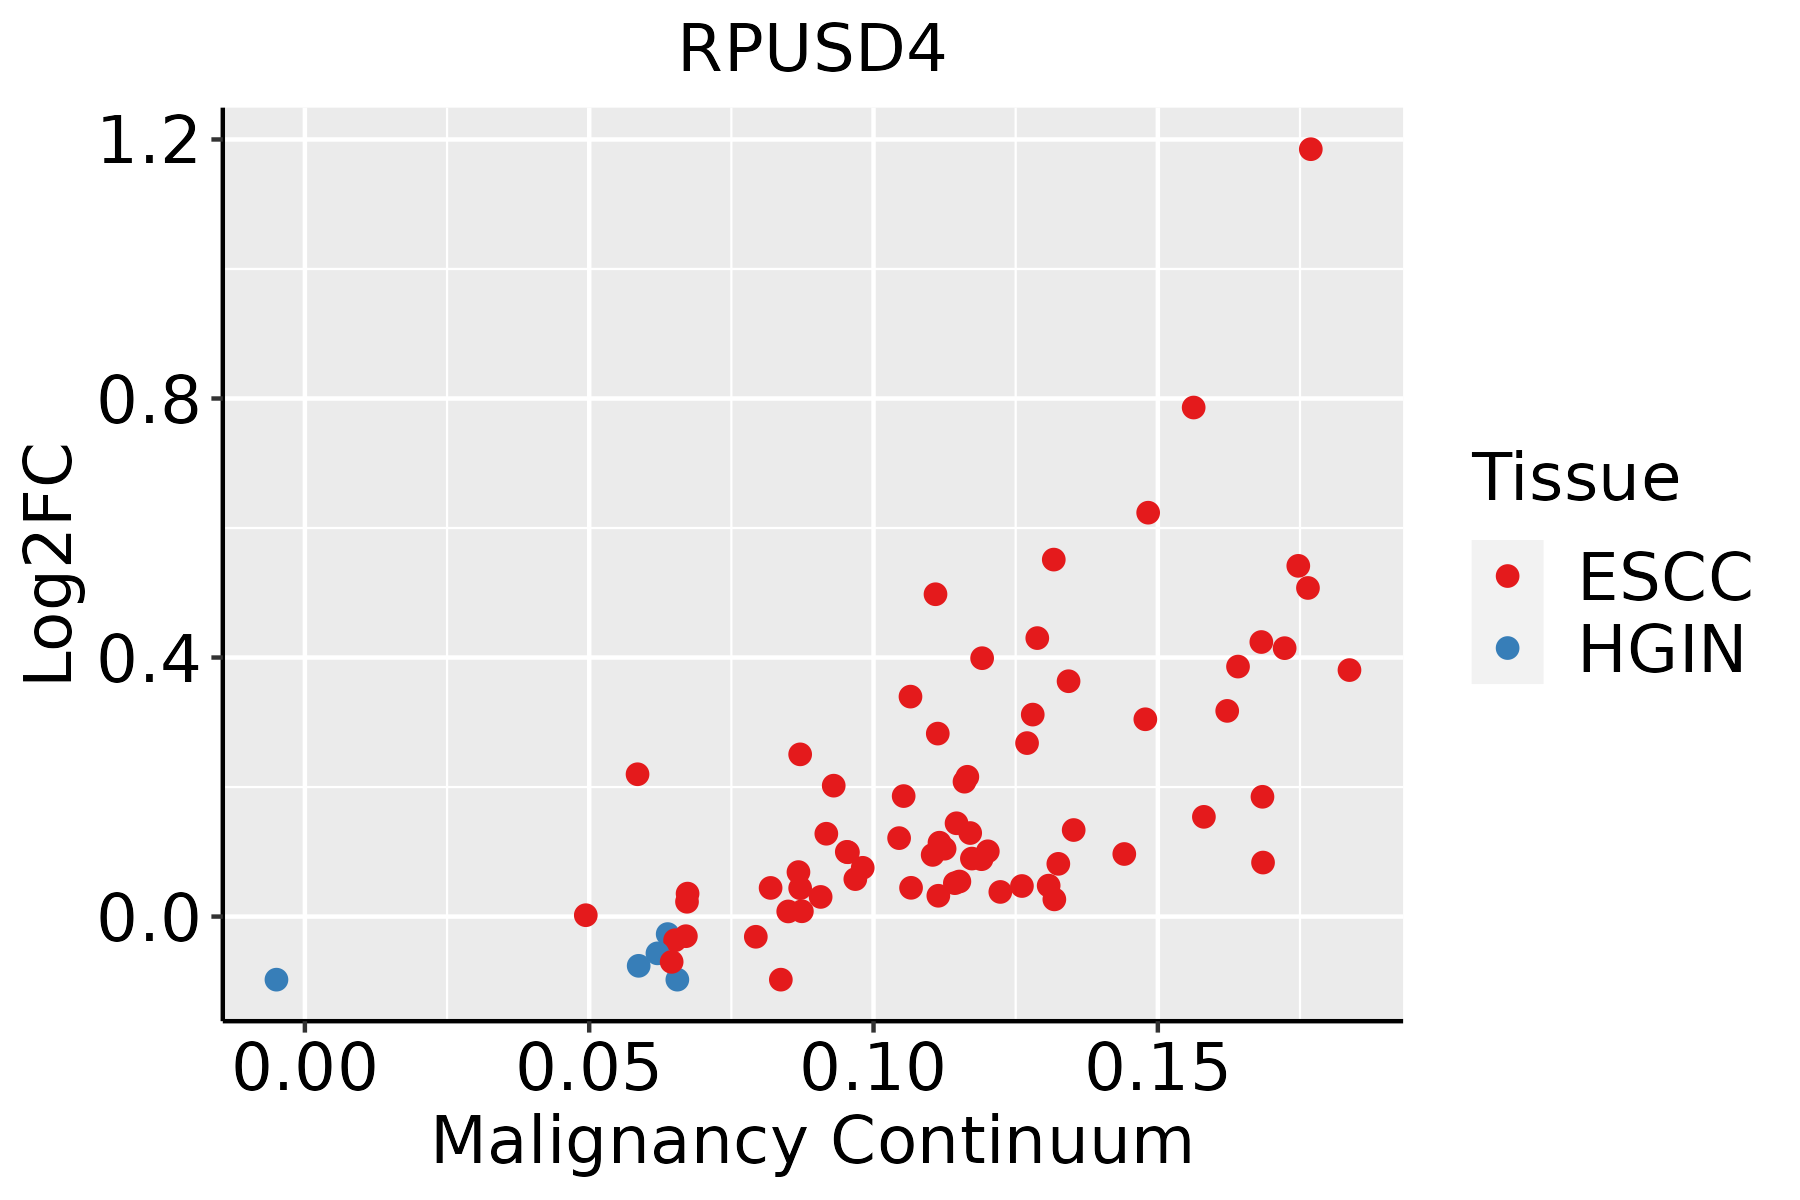 | ESCC: Esophageal squamous cell carcinoma |
| HGIN: High-grade intraepithelial neoplasias | ||
| LGIN: Low-grade intraepithelial neoplasias | ||
| Oral Cavity | 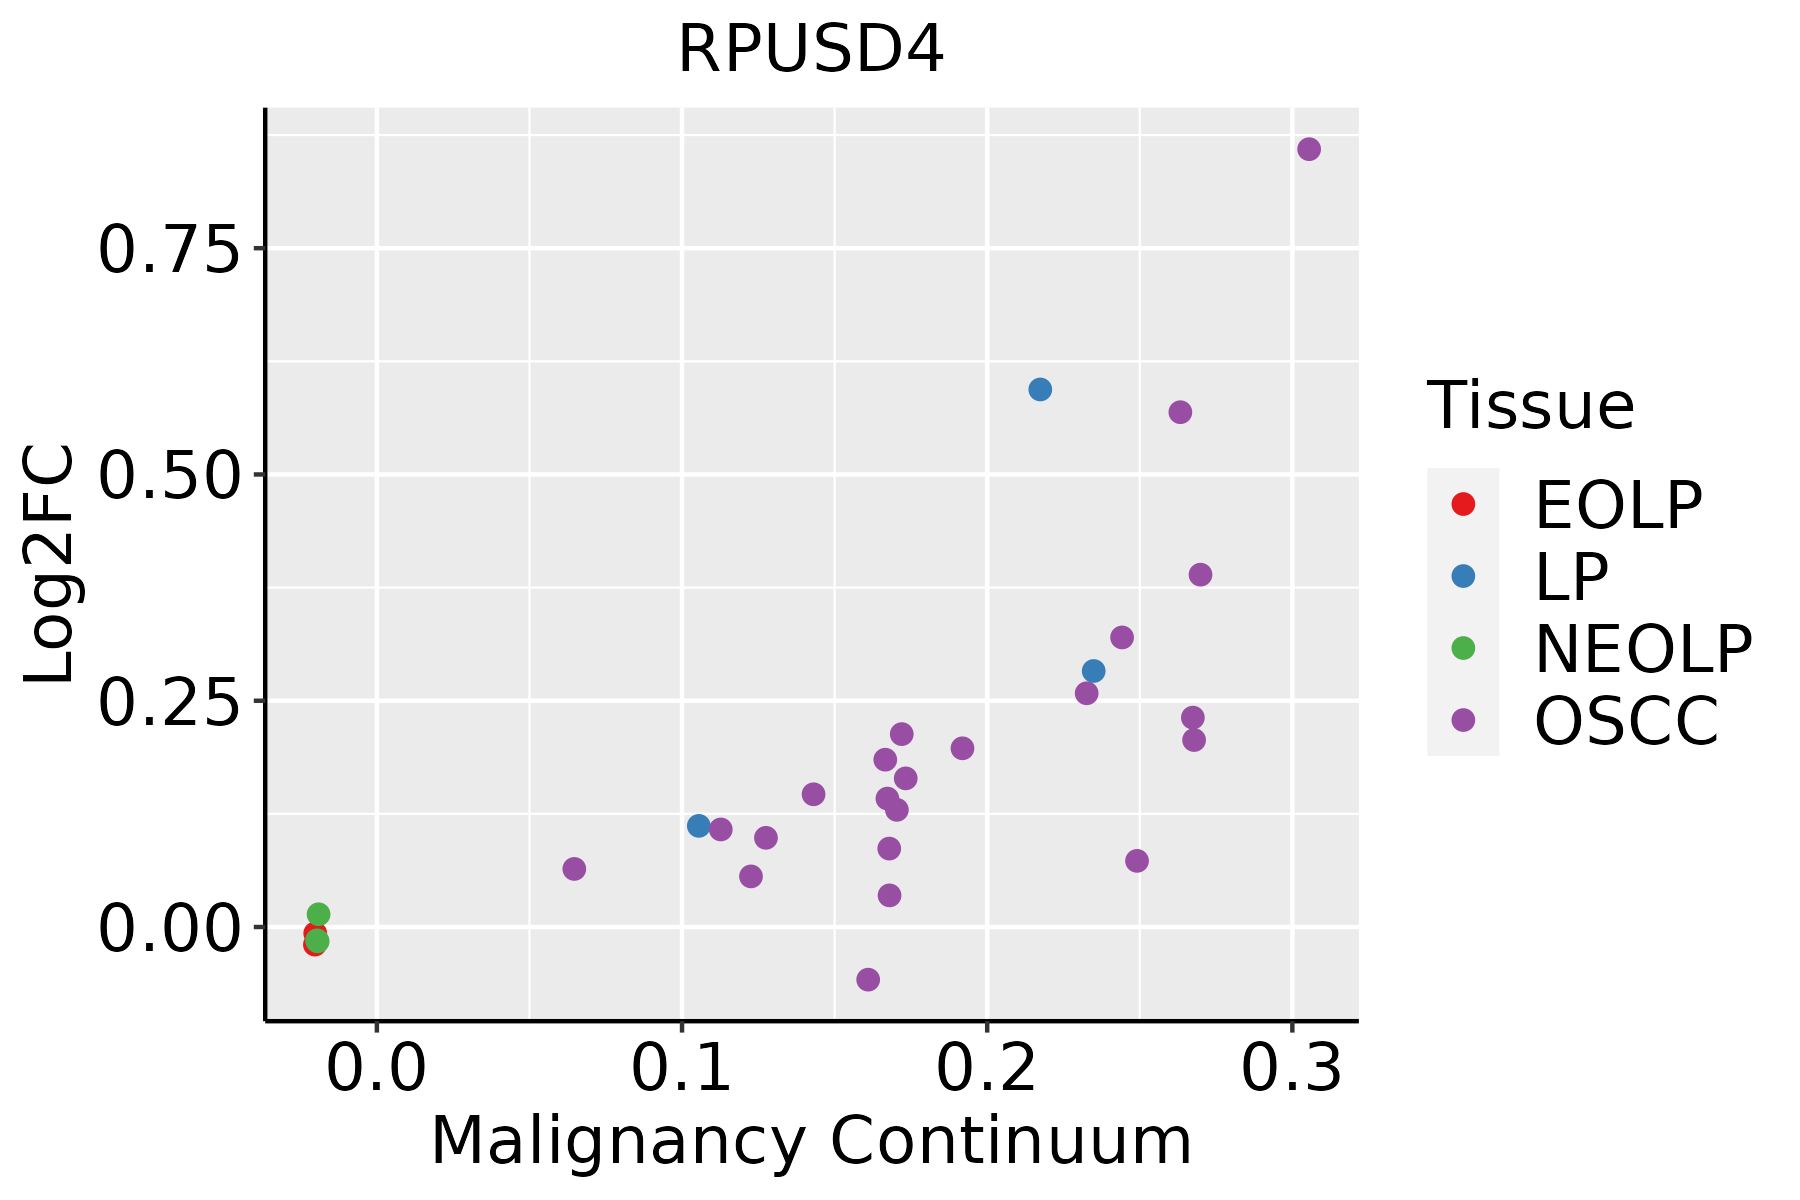 | EOLP: Erosive Oral lichen planus |
| LP: leukoplakia | ||
| NEOLP: Non-erosive oral lichen planus | ||
| OSCC: Oral squamous cell carcinoma |
| ∗log2FC in expression of this searched gene in stem-like cells from each diseased tissue sample relative to stem-like cells in normal samples in each tissue plotted against the malignancy continuum. Samples are colored based on if they are from different disease stage. |
Top |
Malignant transformation related pathway analysis |
| Find out the enriched GO biological processes and KEGG pathways involved in transition from healthy to precancer to cancer |
| Tissue | Disease Stage | Enriched GO biological Processes |
| Colorectum | AD |  |
| Colorectum | SER |  |
| Colorectum | MSS |  |
| Colorectum | MSI-H |  |
| Colorectum | FAP |  |
| ∗Top 15 enriched GO BP terms are showed in the bar plot of each disease state in each tissue. Each row represents a significant GO biological process which is colored according to the -log10(p.adjust). |
| Page: 1 2 3 4 5 6 7 8 9 |
| GO ID | Tissue | Disease Stage | Description | Gene Ratio | Bg Ratio | pvalue | p.adjust | Count |
| GO:0022613111 | Esophagus | ESCC | ribonucleoprotein complex biogenesis | 365/8552 | 463/18723 | 1.74e-49 | 1.11e-45 | 365 |
| GO:0042254111 | Esophagus | ESCC | ribosome biogenesis | 252/8552 | 299/18723 | 3.27e-44 | 1.04e-40 | 252 |
| GO:003447015 | Esophagus | ESCC | ncRNA processing | 300/8552 | 395/18723 | 3.09e-35 | 3.26e-32 | 300 |
| GO:0016072110 | Esophagus | ESCC | rRNA metabolic process | 197/8552 | 236/18723 | 1.31e-33 | 1.18e-30 | 197 |
| GO:0006364110 | Esophagus | ESCC | rRNA processing | 189/8552 | 225/18723 | 4.88e-33 | 3.87e-30 | 189 |
| GO:003466012 | Esophagus | ESCC | ncRNA metabolic process | 346/8552 | 485/18723 | 4.35e-31 | 2.51e-28 | 346 |
| GO:014005313 | Esophagus | ESCC | mitochondrial gene expression | 93/8552 | 108/18723 | 1.96e-18 | 2.03e-16 | 93 |
| GO:0006417111 | Esophagus | ESCC | regulation of translation | 304/8552 | 468/18723 | 1.53e-17 | 1.33e-15 | 304 |
| GO:003254314 | Esophagus | ESCC | mitochondrial translation | 68/8552 | 76/18723 | 1.02e-15 | 6.86e-14 | 68 |
| GO:0045727111 | Esophagus | ESCC | positive regulation of translation | 107/8552 | 136/18723 | 2.79e-15 | 1.68e-13 | 107 |
| GO:0034250111 | Esophagus | ESCC | positive regulation of cellular amide metabolic process | 123/8552 | 162/18723 | 3.32e-15 | 1.93e-13 | 123 |
| GO:00080333 | Esophagus | ESCC | tRNA processing | 92/8552 | 127/18723 | 7.83e-10 | 1.93e-08 | 92 |
| GO:00063992 | Esophagus | ESCC | tRNA metabolic process | 122/8552 | 179/18723 | 9.03e-10 | 2.19e-08 | 122 |
| GO:00094512 | Esophagus | ESCC | RNA modification | 114/8552 | 167/18723 | 2.76e-09 | 6.04e-08 | 114 |
| GO:00009592 | Esophagus | ESCC | mitochondrial RNA metabolic process | 39/8552 | 49/18723 | 1.20e-06 | 1.49e-05 | 39 |
| GO:00701292 | Esophagus | ESCC | regulation of mitochondrial translation | 22/8552 | 24/18723 | 2.82e-06 | 3.21e-05 | 22 |
| GO:00009631 | Esophagus | ESCC | mitochondrial RNA processing | 19/8552 | 20/18723 | 3.83e-06 | 4.14e-05 | 19 |
| GO:00064002 | Esophagus | ESCC | tRNA modification | 62/8552 | 90/18723 | 7.02e-06 | 7.04e-05 | 62 |
| GO:00621252 | Esophagus | ESCC | regulation of mitochondrial gene expression | 24/8552 | 28/18723 | 1.37e-05 | 1.25e-04 | 24 |
| GO:00701312 | Esophagus | ESCC | positive regulation of mitochondrial translation | 14/8552 | 15/18723 | 1.47e-04 | 9.85e-04 | 14 |
| Page: 1 2 3 |
| Pathway ID | Tissue | Disease Stage | Description | Gene Ratio | Bg Ratio | pvalue | p.adjust | qvalue | Count |
| Page: 1 |
Top |
Cell-cell communication analysis |
| Identification of potential cell-cell interactions between two cell types and their ligand-receptor pairs for different disease states |
| Ligand | Receptor | LRpair | Pathway | Tissue | Disease Stage |
| Page: 1 |
Top |
Single-cell gene regulatory network inference analysis |
| Find out the significant the regulons (TFs) and the target genes of each regulon across cell types for different disease states |
| TF | Cell Type | Tissue | Disease Stage | Target Gene | RSS | Regulon Activity |
| ∗The dot plots of a searched regulon are shown for all cell subpopulations in each disease state of each tissue based on the regulon specific score inferred using pySCENIC and by calculating the average expression. |
| Page: 1 |
Top |
Somatic mutation of malignant transformation related genes |
| Annotation of somatic variants for genes involved in malignant transformation |
| Hugo Symbol | Variant Class | Variant Classification | dbSNP RS | HGVSc | HGVSp | HGVSp Short | SWISSPROT | BIOTYPE | SIFT | PolyPhen | Tumor Sample Barcode | Tissue | Histology | Sex | Age | Stage | Therapy Types | Drugs | Outcome |
| RPUSD4 | SNV | Missense_Mutation | c.770N>T | p.Ala257Val | p.A257V | Q96CM3 | protein_coding | deleterious(0.05) | possibly_damaging(0.824) | TCGA-AN-A0AK-01 | Breast | breast invasive carcinoma | Female | >=65 | I/II | Unknown | Unknown | SD | |
| RPUSD4 | SNV | Missense_Mutation | rs369015729 | c.694N>A | p.Val232Met | p.V232M | Q96CM3 | protein_coding | tolerated(0.09) | benign(0.177) | TCGA-BH-A0HQ-01 | Breast | breast invasive carcinoma | Female | <65 | I/II | Hormone Therapy | arimidex | SD |
| RPUSD4 | SNV | Missense_Mutation | c.718G>C | p.Ala240Pro | p.A240P | Q96CM3 | protein_coding | deleterious(0) | probably_damaging(0.979) | TCGA-GM-A2DL-01 | Breast | breast invasive carcinoma | Female | <65 | I/II | Hormone Therapy | tamoxiphen | CR | |
| RPUSD4 | insertion | Frame_Shift_Ins | novel | c.819_820insGTGGGCACCCTGAAGAAGCTGGGGCTAGAACAGTCGAAGG | p.His274ValfsTer26 | p.H274Vfs*26 | Q96CM3 | protein_coding | TCGA-A2-A0CX-01 | Breast | breast invasive carcinoma | Female | <65 | I/II | Chemotherapy | adriamycin | SD | ||
| RPUSD4 | insertion | Nonsense_Mutation | novel | c.1090_1091insTCATGTCATCTGCTTGTAATTAGTTACCATCTGAGCTTGA | p.Asp364ValfsTer8 | p.D364Vfs*8 | Q96CM3 | protein_coding | TCGA-A8-A07R-01 | Breast | breast invasive carcinoma | Female | >=65 | III/IV | Ancillary | zoledronic | SD | ||
| RPUSD4 | SNV | Missense_Mutation | c.703C>T | p.Arg235Trp | p.R235W | Q96CM3 | protein_coding | deleterious(0) | probably_damaging(0.985) | TCGA-EA-A3HS-01 | Cervix | cervical & endocervical cancer | Female | <65 | I/II | Unknown | Unknown | SD | |
| RPUSD4 | SNV | Missense_Mutation | rs142091462 | c.451C>T | p.Arg151Trp | p.R151W | Q96CM3 | protein_coding | deleterious(0) | probably_damaging(0.999) | TCGA-IR-A3LA-01 | Cervix | cervical & endocervical cancer | Female | <65 | I/II | Chemotherapy | cisplatin | CR |
| RPUSD4 | SNV | Missense_Mutation | rs574615517 | c.598N>A | p.Val200Met | p.V200M | Q96CM3 | protein_coding | deleterious(0) | probably_damaging(0.918) | TCGA-AA-3831-01 | Colorectum | colon adenocarcinoma | Male | >=65 | I/II | Unknown | Unknown | SD |
| RPUSD4 | SNV | Missense_Mutation | novel | c.487N>A | p.Ala163Thr | p.A163T | Q96CM3 | protein_coding | deleterious(0.04) | possibly_damaging(0.558) | TCGA-AA-3950-01 | Colorectum | colon adenocarcinoma | Female | >=65 | I/II | Unknown | Unknown | SD |
| RPUSD4 | SNV | Missense_Mutation | c.104N>T | p.Ala35Val | p.A35V | Q96CM3 | protein_coding | tolerated(0.09) | benign(0.265) | TCGA-AA-3966-01 | Colorectum | colon adenocarcinoma | Female | >=65 | I/II | Unknown | Unknown | SD |
| Page: 1 2 3 4 |
Top |
Related drugs of malignant transformation related genes |
| Identification of chemicals and drugs interact with genes involved in malignant transfromation |
| (DGIdb 4.0) |
| Entrez ID | Symbol | Category | Interaction Types | Drug Claim Name | Drug Name | PMIDs |
| Page: 1 |

Copyright 2023-Present -The University of Texas Health Science Center at Houston |