
|
|||||
|
 | |
| |
| |
| |
| |
| |
|
Gene: RPUSD3 |
Gene summary for RPUSD3 |
| Gene information | Species | Human | Gene symbol | RPUSD3 | Gene ID | 285367 |
| Gene name | RNA pseudouridine synthase D3 | |
| Gene Alias | RPUSD3 | |
| Cytomap | 3p25.3 | |
| Gene Type | protein-coding | GO ID | GO:0000154 | UniProtAcc | Q6P087 |
Top |
Malignant transformation analysis |
| Identification of the aberrant gene expression in precancerous and cancerous lesions by comparing the gene expression of stem-like cells in diseased tissues with normal stem cells |
| Entrez ID | Symbol | Replicates | Species | Organ | Tissue | Adj P-value | Log2FC | Malignancy |
| 285367 | RPUSD3 | LZE4T | Human | Esophagus | ESCC | 8.20e-18 | 3.78e-01 | 0.0811 |
| 285367 | RPUSD3 | LZE7T | Human | Esophagus | ESCC | 1.42e-03 | 1.59e-01 | 0.0667 |
| 285367 | RPUSD3 | LZE22T | Human | Esophagus | ESCC | 1.60e-03 | 5.02e-01 | 0.068 |
| 285367 | RPUSD3 | LZE24T | Human | Esophagus | ESCC | 7.26e-12 | 4.31e-01 | 0.0596 |
| 285367 | RPUSD3 | LZE6T | Human | Esophagus | ESCC | 1.10e-04 | 2.74e-01 | 0.0845 |
| 285367 | RPUSD3 | P1T-E | Human | Esophagus | ESCC | 6.00e-03 | 1.86e-01 | 0.0875 |
| 285367 | RPUSD3 | P2T-E | Human | Esophagus | ESCC | 4.55e-18 | 3.98e-01 | 0.1177 |
| 285367 | RPUSD3 | P4T-E | Human | Esophagus | ESCC | 2.28e-27 | 6.73e-01 | 0.1323 |
| 285367 | RPUSD3 | P5T-E | Human | Esophagus | ESCC | 5.69e-52 | 1.03e+00 | 0.1327 |
| 285367 | RPUSD3 | P8T-E | Human | Esophagus | ESCC | 3.79e-10 | 2.10e-01 | 0.0889 |
| 285367 | RPUSD3 | P9T-E | Human | Esophagus | ESCC | 5.85e-11 | 2.84e-01 | 0.1131 |
| 285367 | RPUSD3 | P10T-E | Human | Esophagus | ESCC | 1.74e-21 | 4.20e-01 | 0.116 |
| 285367 | RPUSD3 | P11T-E | Human | Esophagus | ESCC | 1.12e-17 | 6.37e-01 | 0.1426 |
| 285367 | RPUSD3 | P12T-E | Human | Esophagus | ESCC | 3.73e-25 | 4.96e-01 | 0.1122 |
| 285367 | RPUSD3 | P15T-E | Human | Esophagus | ESCC | 3.79e-12 | 2.63e-01 | 0.1149 |
| 285367 | RPUSD3 | P16T-E | Human | Esophagus | ESCC | 1.10e-36 | 7.45e-01 | 0.1153 |
| 285367 | RPUSD3 | P17T-E | Human | Esophagus | ESCC | 5.90e-04 | 2.48e-01 | 0.1278 |
| 285367 | RPUSD3 | P19T-E | Human | Esophagus | ESCC | 2.41e-06 | 4.26e-01 | 0.1662 |
| 285367 | RPUSD3 | P20T-E | Human | Esophagus | ESCC | 8.66e-16 | 3.80e-01 | 0.1124 |
| 285367 | RPUSD3 | P21T-E | Human | Esophagus | ESCC | 1.73e-41 | 7.49e-01 | 0.1617 |
| Page: 1 2 3 4 5 6 |
| Tissue | Expression Dynamics | Abbreviation |
| Esophagus |  | ESCC: Esophageal squamous cell carcinoma |
| HGIN: High-grade intraepithelial neoplasias | ||
| LGIN: Low-grade intraepithelial neoplasias | ||
| Liver | 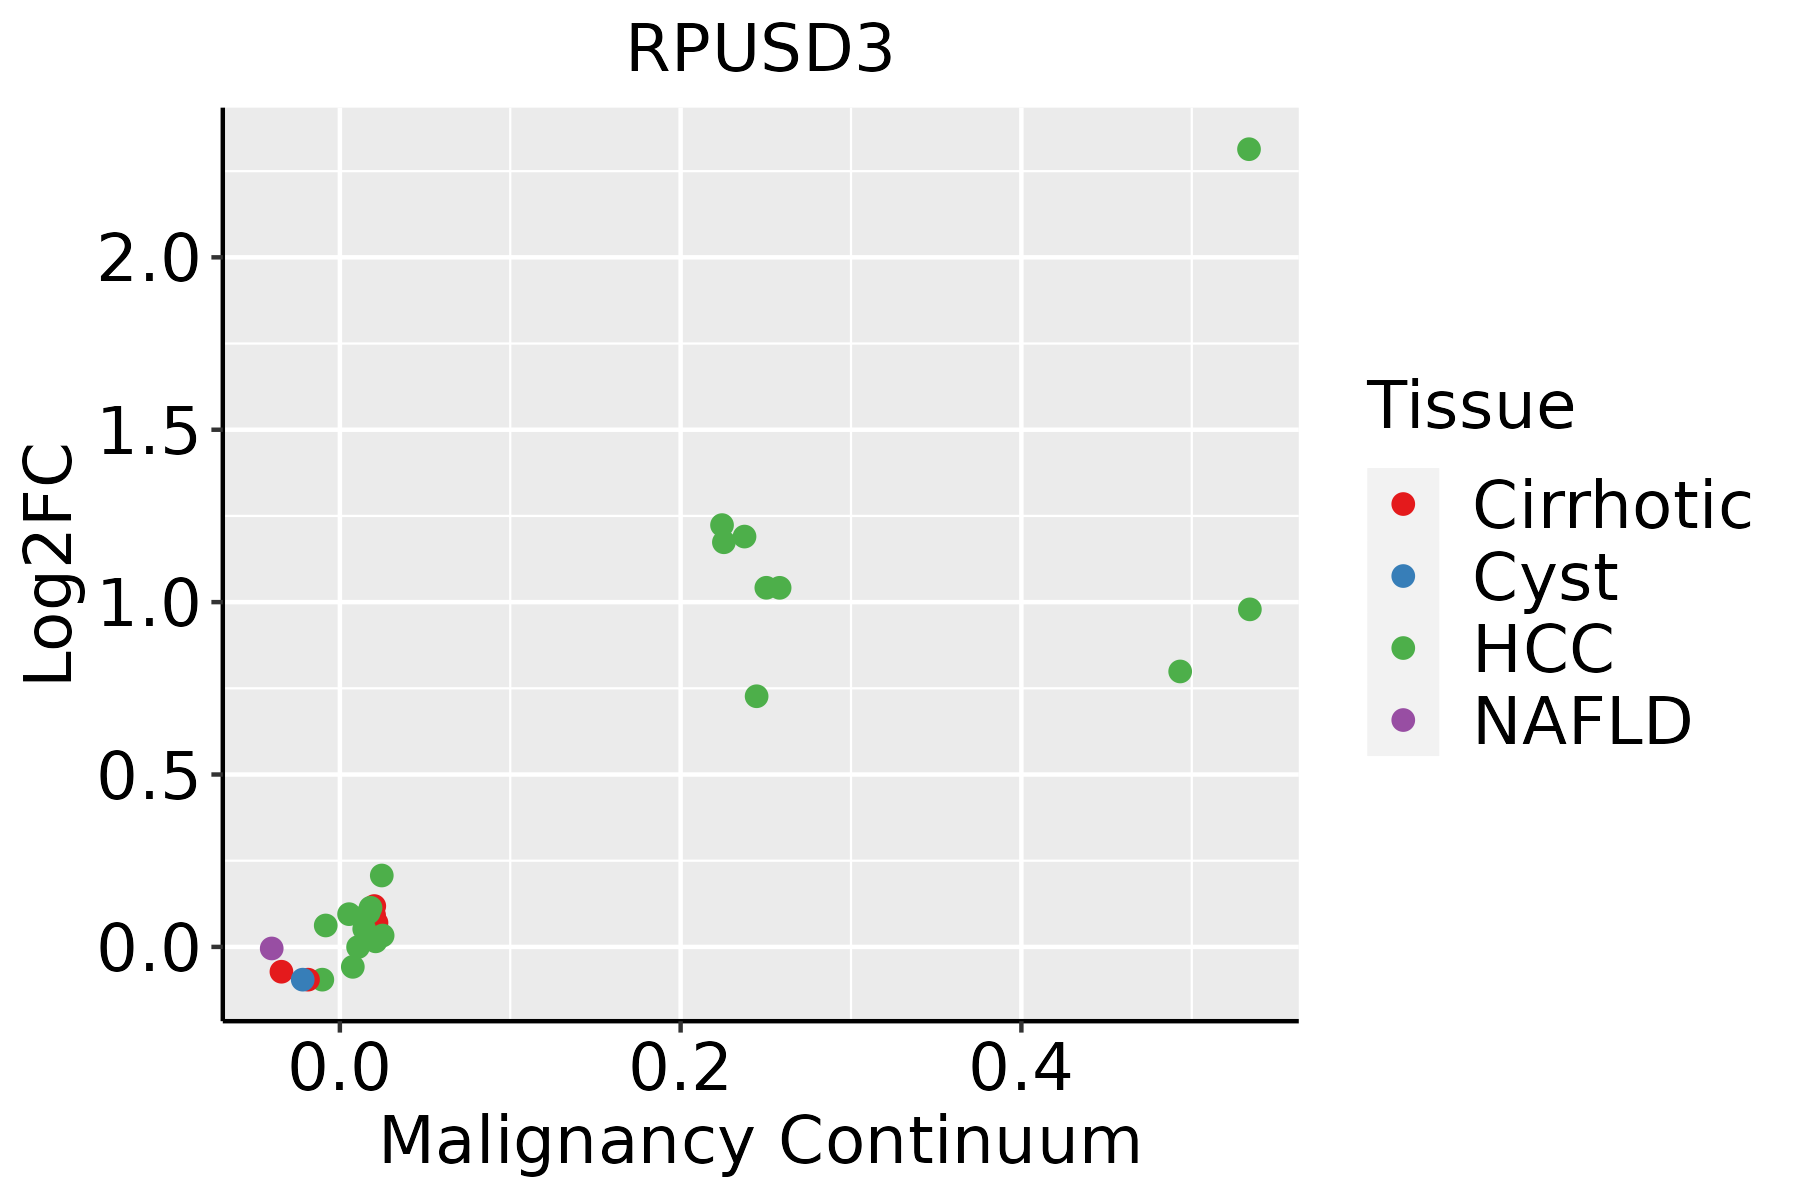 | HCC: Hepatocellular carcinoma |
| NAFLD: Non-alcoholic fatty liver disease | ||
| Oral Cavity |  | EOLP: Erosive Oral lichen planus |
| LP: leukoplakia | ||
| NEOLP: Non-erosive oral lichen planus | ||
| OSCC: Oral squamous cell carcinoma | ||
| Skin | 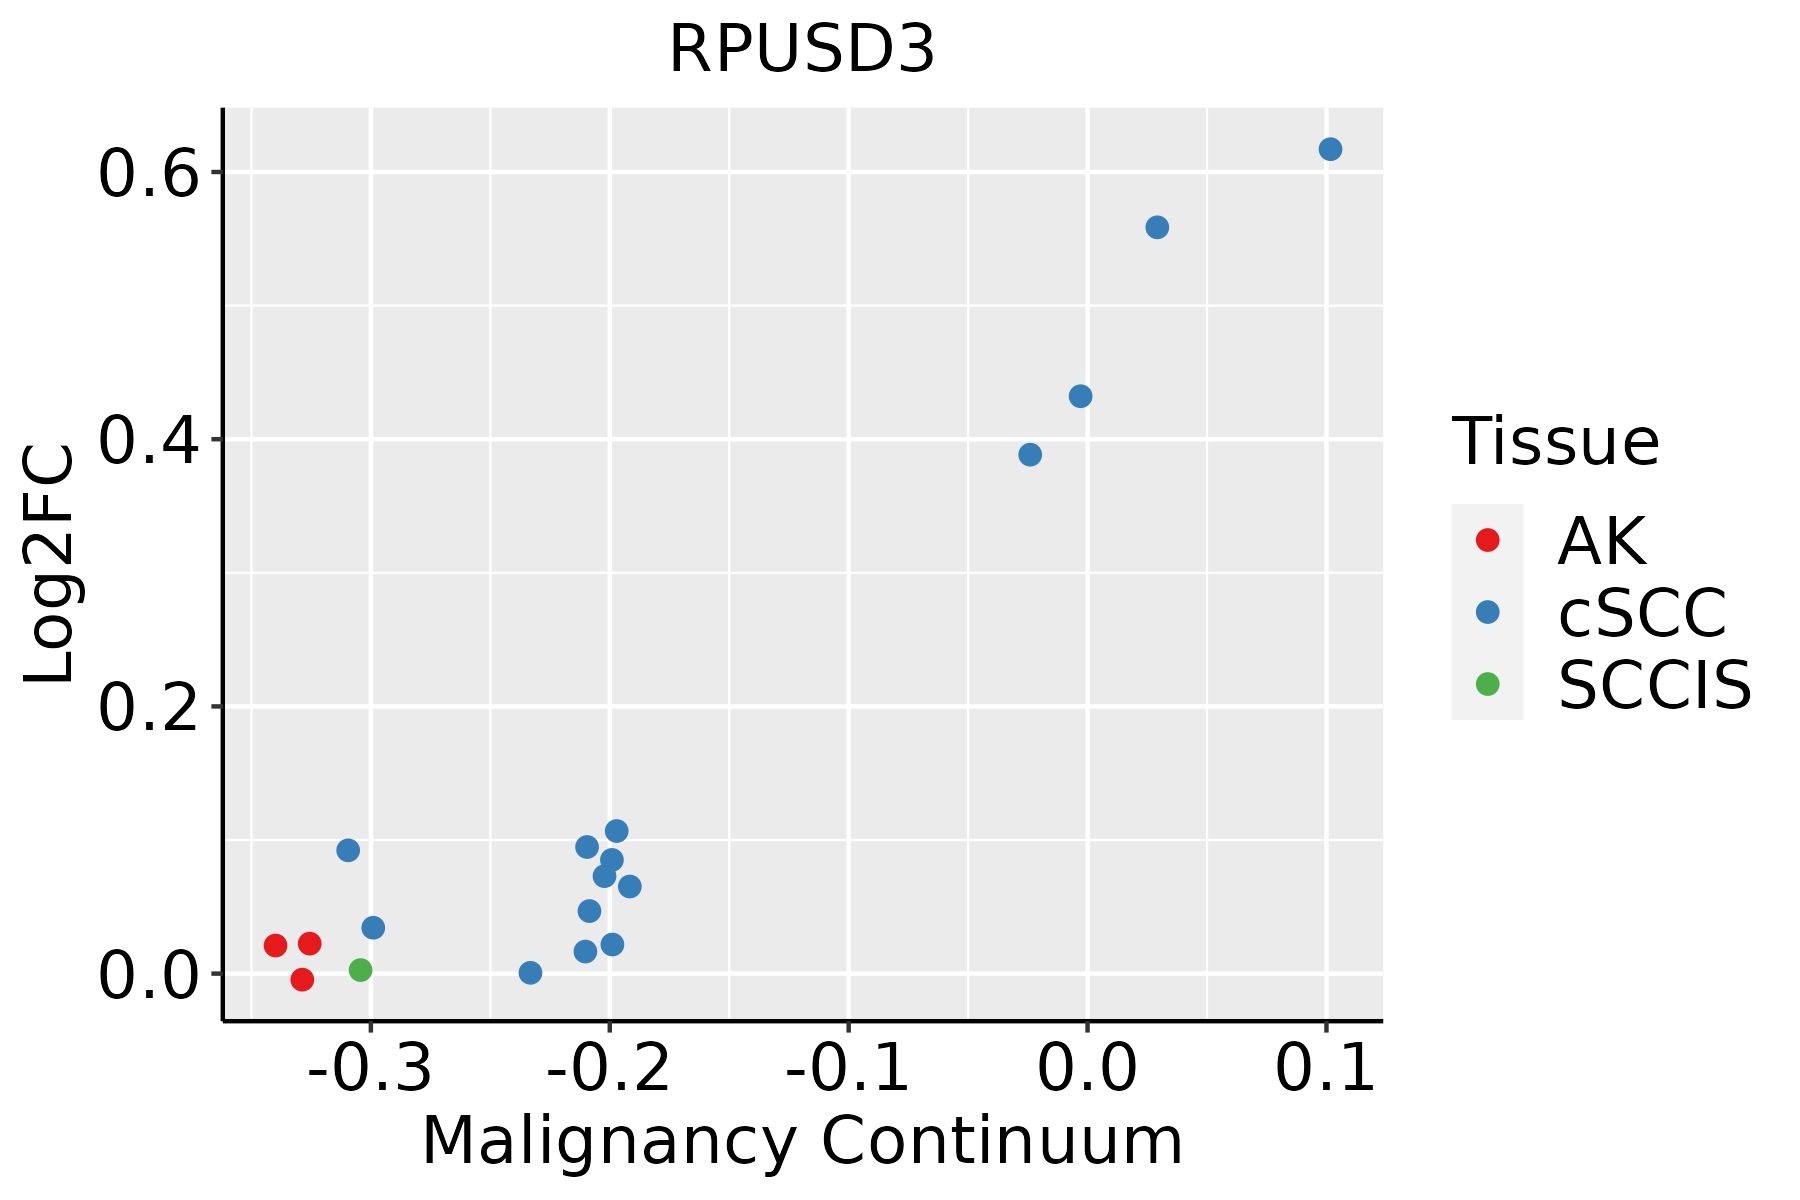 | AK: Actinic keratosis |
| cSCC: Cutaneous squamous cell carcinoma | ||
| SCCIS:squamous cell carcinoma in situ | ||
| Thyroid |  | ATC: Anaplastic thyroid cancer |
| HT: Hashimoto's thyroiditis | ||
| PTC: Papillary thyroid cancer |
| ∗log2FC in expression of this searched gene in stem-like cells from each diseased tissue sample relative to stem-like cells in normal samples in each tissue plotted against the malignancy continuum. Samples are colored based on if they are from different disease stage. |
Top |
Malignant transformation related pathway analysis |
| Find out the enriched GO biological processes and KEGG pathways involved in transition from healthy to precancer to cancer |
| Tissue | Disease Stage | Enriched GO biological Processes |
| Colorectum | AD |  |
| Colorectum | SER |  |
| Colorectum | MSS |  |
| Colorectum | MSI-H |  |
| Colorectum | FAP |  |
| ∗Top 15 enriched GO BP terms are showed in the bar plot of each disease state in each tissue. Each row represents a significant GO biological process which is colored according to the -log10(p.adjust). |
| Page: 1 2 3 4 5 6 7 8 9 |
| GO ID | Tissue | Disease Stage | Description | Gene Ratio | Bg Ratio | pvalue | p.adjust | Count |
| GO:0022613111 | Esophagus | ESCC | ribonucleoprotein complex biogenesis | 365/8552 | 463/18723 | 1.74e-49 | 1.11e-45 | 365 |
| GO:0042254111 | Esophagus | ESCC | ribosome biogenesis | 252/8552 | 299/18723 | 3.27e-44 | 1.04e-40 | 252 |
| GO:003447015 | Esophagus | ESCC | ncRNA processing | 300/8552 | 395/18723 | 3.09e-35 | 3.26e-32 | 300 |
| GO:0016072110 | Esophagus | ESCC | rRNA metabolic process | 197/8552 | 236/18723 | 1.31e-33 | 1.18e-30 | 197 |
| GO:0006364110 | Esophagus | ESCC | rRNA processing | 189/8552 | 225/18723 | 4.88e-33 | 3.87e-30 | 189 |
| GO:003466012 | Esophagus | ESCC | ncRNA metabolic process | 346/8552 | 485/18723 | 4.35e-31 | 2.51e-28 | 346 |
| GO:014005313 | Esophagus | ESCC | mitochondrial gene expression | 93/8552 | 108/18723 | 1.96e-18 | 2.03e-16 | 93 |
| GO:0006417111 | Esophagus | ESCC | regulation of translation | 304/8552 | 468/18723 | 1.53e-17 | 1.33e-15 | 304 |
| GO:003254314 | Esophagus | ESCC | mitochondrial translation | 68/8552 | 76/18723 | 1.02e-15 | 6.86e-14 | 68 |
| GO:0045727111 | Esophagus | ESCC | positive regulation of translation | 107/8552 | 136/18723 | 2.79e-15 | 1.68e-13 | 107 |
| GO:0034250111 | Esophagus | ESCC | positive regulation of cellular amide metabolic process | 123/8552 | 162/18723 | 3.32e-15 | 1.93e-13 | 123 |
| GO:00094512 | Esophagus | ESCC | RNA modification | 114/8552 | 167/18723 | 2.76e-09 | 6.04e-08 | 114 |
| GO:00701292 | Esophagus | ESCC | regulation of mitochondrial translation | 22/8552 | 24/18723 | 2.82e-06 | 3.21e-05 | 22 |
| GO:00621252 | Esophagus | ESCC | regulation of mitochondrial gene expression | 24/8552 | 28/18723 | 1.37e-05 | 1.25e-04 | 24 |
| GO:00701312 | Esophagus | ESCC | positive regulation of mitochondrial translation | 14/8552 | 15/18723 | 1.47e-04 | 9.85e-04 | 14 |
| GO:00015221 | Esophagus | ESCC | pseudouridine synthesis | 16/8552 | 18/18723 | 1.78e-04 | 1.15e-03 | 16 |
| GO:0000154 | Esophagus | ESCC | rRNA modification | 26/8552 | 37/18723 | 2.16e-03 | 9.62e-03 | 26 |
| GO:00311182 | Esophagus | ESCC | rRNA pseudouridine synthesis | 9/8552 | 10/18723 | 5.09e-03 | 1.92e-02 | 9 |
| GO:002261312 | Liver | Cirrhotic | ribonucleoprotein complex biogenesis | 231/4634 | 463/18723 | 3.28e-32 | 6.86e-29 | 231 |
| GO:004225412 | Liver | Cirrhotic | ribosome biogenesis | 154/4634 | 299/18723 | 1.18e-23 | 6.72e-21 | 154 |
| Page: 1 2 3 4 5 6 |
| Pathway ID | Tissue | Disease Stage | Description | Gene Ratio | Bg Ratio | pvalue | p.adjust | qvalue | Count |
| Page: 1 |
Top |
Cell-cell communication analysis |
| Identification of potential cell-cell interactions between two cell types and their ligand-receptor pairs for different disease states |
| Ligand | Receptor | LRpair | Pathway | Tissue | Disease Stage |
| Page: 1 |
Top |
Single-cell gene regulatory network inference analysis |
| Find out the significant the regulons (TFs) and the target genes of each regulon across cell types for different disease states |
| TF | Cell Type | Tissue | Disease Stage | Target Gene | RSS | Regulon Activity |
| ∗The dot plots of a searched regulon are shown for all cell subpopulations in each disease state of each tissue based on the regulon specific score inferred using pySCENIC and by calculating the average expression. |
| Page: 1 |
Top |
Somatic mutation of malignant transformation related genes |
| Annotation of somatic variants for genes involved in malignant transformation |
| Hugo Symbol | Variant Class | Variant Classification | dbSNP RS | HGVSc | HGVSp | HGVSp Short | SWISSPROT | BIOTYPE | SIFT | PolyPhen | Tumor Sample Barcode | Tissue | Histology | Sex | Age | Stage | Therapy Types | Drugs | Outcome |
| RPUSD3 | SNV | Missense_Mutation | novel | c.728T>A | p.Phe243Tyr | p.F243Y | Q6P087 | protein_coding | tolerated(0.06) | benign(0.146) | TCGA-A2-A3Y0-01 | Breast | breast invasive carcinoma | Female | <65 | I/II | Chemotherapy | adriamycin | CR |
| RPUSD3 | SNV | Missense_Mutation | rs748220786 | c.824N>A | p.Arg275Gln | p.R275Q | Q6P087 | protein_coding | tolerated(0.18) | benign(0.007) | TCGA-AN-A046-01 | Breast | breast invasive carcinoma | Female | >=65 | I/II | Unknown | Unknown | SD |
| RPUSD3 | SNV | Missense_Mutation | c.526G>T | p.Asp176Tyr | p.D176Y | Q6P087 | protein_coding | tolerated(0.32) | benign(0.335) | TCGA-GM-A2D9-01 | Breast | breast invasive carcinoma | Female | >=65 | I/II | Hormone Therapy | arimidex | SD | |
| RPUSD3 | insertion | In_Frame_Ins | novel | c.195_196insAGGCAG | p.Leu65_Leu66insArgGln | p.L65_L66insRQ | Q6P087 | protein_coding | TCGA-AO-A03L-01 | Breast | breast invasive carcinoma | Female | <65 | III/IV | Chemotherapy | cyclophosphamide | SD | ||
| RPUSD3 | SNV | Missense_Mutation | c.955C>G | p.Leu319Val | p.L319V | Q6P087 | protein_coding | deleterious(0) | possibly_damaging(0.896) | TCGA-IR-A3LA-01 | Cervix | cervical & endocervical cancer | Female | <65 | I/II | Chemotherapy | cisplatin | CR | |
| RPUSD3 | SNV | Missense_Mutation | c.577N>C | p.Glu193Gln | p.E193Q | Q6P087 | protein_coding | tolerated(0.32) | benign(0.098) | TCGA-JW-A5VL-01 | Cervix | cervical & endocervical cancer | Female | <65 | I/II | Unknown | Unknown | SD | |
| RPUSD3 | SNV | Missense_Mutation | rs775434005 | c.425N>C | p.Val142Ala | p.V142A | Q6P087 | protein_coding | deleterious(0.03) | benign(0.433) | TCGA-AA-A02R-01 | Colorectum | colon adenocarcinoma | Female | >=65 | I/II | Unknown | Unknown | PD |
| RPUSD3 | SNV | Missense_Mutation | rs149050872 | c.947N>A | p.Arg316Gln | p.R316Q | Q6P087 | protein_coding | tolerated(0.85) | benign(0.001) | TCGA-AZ-6607-01 | Colorectum | colon adenocarcinoma | Male | >=65 | III/IV | Unknown | Unknown | PD |
| RPUSD3 | SNV | Missense_Mutation | rs377371328 | c.889N>T | p.Arg297Cys | p.R297C | Q6P087 | protein_coding | tolerated(0.09) | benign(0.013) | TCGA-CM-4746-01 | Colorectum | colon adenocarcinoma | Male | <65 | I/II | Unknown | Unknown | SD |
| RPUSD3 | SNV | Missense_Mutation | rs748220786 | c.824N>A | p.Arg275Gln | p.R275Q | Q6P087 | protein_coding | tolerated(0.18) | benign(0.007) | TCGA-QG-A5Z2-01 | Colorectum | colon adenocarcinoma | Male | <65 | I/II | Unknown | Unknown | SD |
| Page: 1 2 3 4 |
Top |
Related drugs of malignant transformation related genes |
| Identification of chemicals and drugs interact with genes involved in malignant transfromation |
| (DGIdb 4.0) |
| Entrez ID | Symbol | Category | Interaction Types | Drug Claim Name | Drug Name | PMIDs |
| Page: 1 |

Copyright 2023-Present -The University of Texas Health Science Center at Houston |