
|
|||||
|
 | |
| |
| |
| |
| |
| |
|
Gene: RPTOR |
Gene summary for RPTOR |
| Gene information | Species | Human | Gene symbol | RPTOR | Gene ID | 57521 |
| Gene name | regulatory associated protein of MTOR complex 1 | |
| Gene Alias | KOG1 | |
| Cytomap | 17q25.3 | |
| Gene Type | protein-coding | GO ID | GO:0000082 | UniProtAcc | Q8N122 |
Top |
Malignant transformation analysis |
| Identification of the aberrant gene expression in precancerous and cancerous lesions by comparing the gene expression of stem-like cells in diseased tissues with normal stem cells |
| Entrez ID | Symbol | Replicates | Species | Organ | Tissue | Adj P-value | Log2FC | Malignancy |
| 57521 | RPTOR | CCI_1 | Human | Cervix | CC | 1.68e-12 | 6.97e-01 | 0.528 |
| 57521 | RPTOR | CCI_2 | Human | Cervix | CC | 1.55e-05 | 5.00e-01 | 0.5249 |
| 57521 | RPTOR | CCI_3 | Human | Cervix | CC | 1.37e-14 | 7.46e-01 | 0.516 |
| 57521 | RPTOR | HTA11_3410_2000001011 | Human | Colorectum | AD | 5.90e-11 | -5.33e-01 | 0.0155 |
| 57521 | RPTOR | HTA11_866_3004761011 | Human | Colorectum | AD | 3.11e-07 | -5.08e-01 | 0.096 |
| 57521 | RPTOR | HTA11_7696_3000711011 | Human | Colorectum | AD | 1.27e-02 | -3.27e-01 | 0.0674 |
| 57521 | RPTOR | HTA11_99999970781_79442 | Human | Colorectum | MSS | 6.56e-17 | -5.24e-01 | 0.294 |
| 57521 | RPTOR | HTA11_99999971662_82457 | Human | Colorectum | MSS | 6.30e-03 | -2.88e-01 | 0.3859 |
| 57521 | RPTOR | HTA11_99999974143_84620 | Human | Colorectum | MSS | 5.35e-10 | -4.06e-01 | 0.3005 |
| 57521 | RPTOR | A002-C-010 | Human | Colorectum | FAP | 1.09e-05 | -1.05e-01 | 0.242 |
| 57521 | RPTOR | A001-C-207 | Human | Colorectum | FAP | 4.04e-05 | -2.13e-01 | 0.1278 |
| 57521 | RPTOR | A015-C-203 | Human | Colorectum | FAP | 1.73e-30 | -2.88e-01 | -0.1294 |
| 57521 | RPTOR | A015-C-204 | Human | Colorectum | FAP | 6.91e-07 | -2.57e-01 | -0.0228 |
| 57521 | RPTOR | A014-C-040 | Human | Colorectum | FAP | 4.99e-04 | -2.24e-01 | -0.1184 |
| 57521 | RPTOR | A002-C-201 | Human | Colorectum | FAP | 1.98e-14 | -2.75e-01 | 0.0324 |
| 57521 | RPTOR | A002-C-203 | Human | Colorectum | FAP | 7.65e-05 | -4.60e-02 | 0.2786 |
| 57521 | RPTOR | A001-C-119 | Human | Colorectum | FAP | 6.84e-08 | -3.92e-01 | -0.1557 |
| 57521 | RPTOR | A001-C-108 | Human | Colorectum | FAP | 1.42e-16 | -1.33e-01 | -0.0272 |
| 57521 | RPTOR | A002-C-205 | Human | Colorectum | FAP | 1.26e-23 | -3.62e-01 | -0.1236 |
| 57521 | RPTOR | A001-C-104 | Human | Colorectum | FAP | 3.24e-04 | -1.26e-01 | 0.0184 |
| Page: 1 2 3 4 5 |
| Tissue | Expression Dynamics | Abbreviation |
| Cervix | 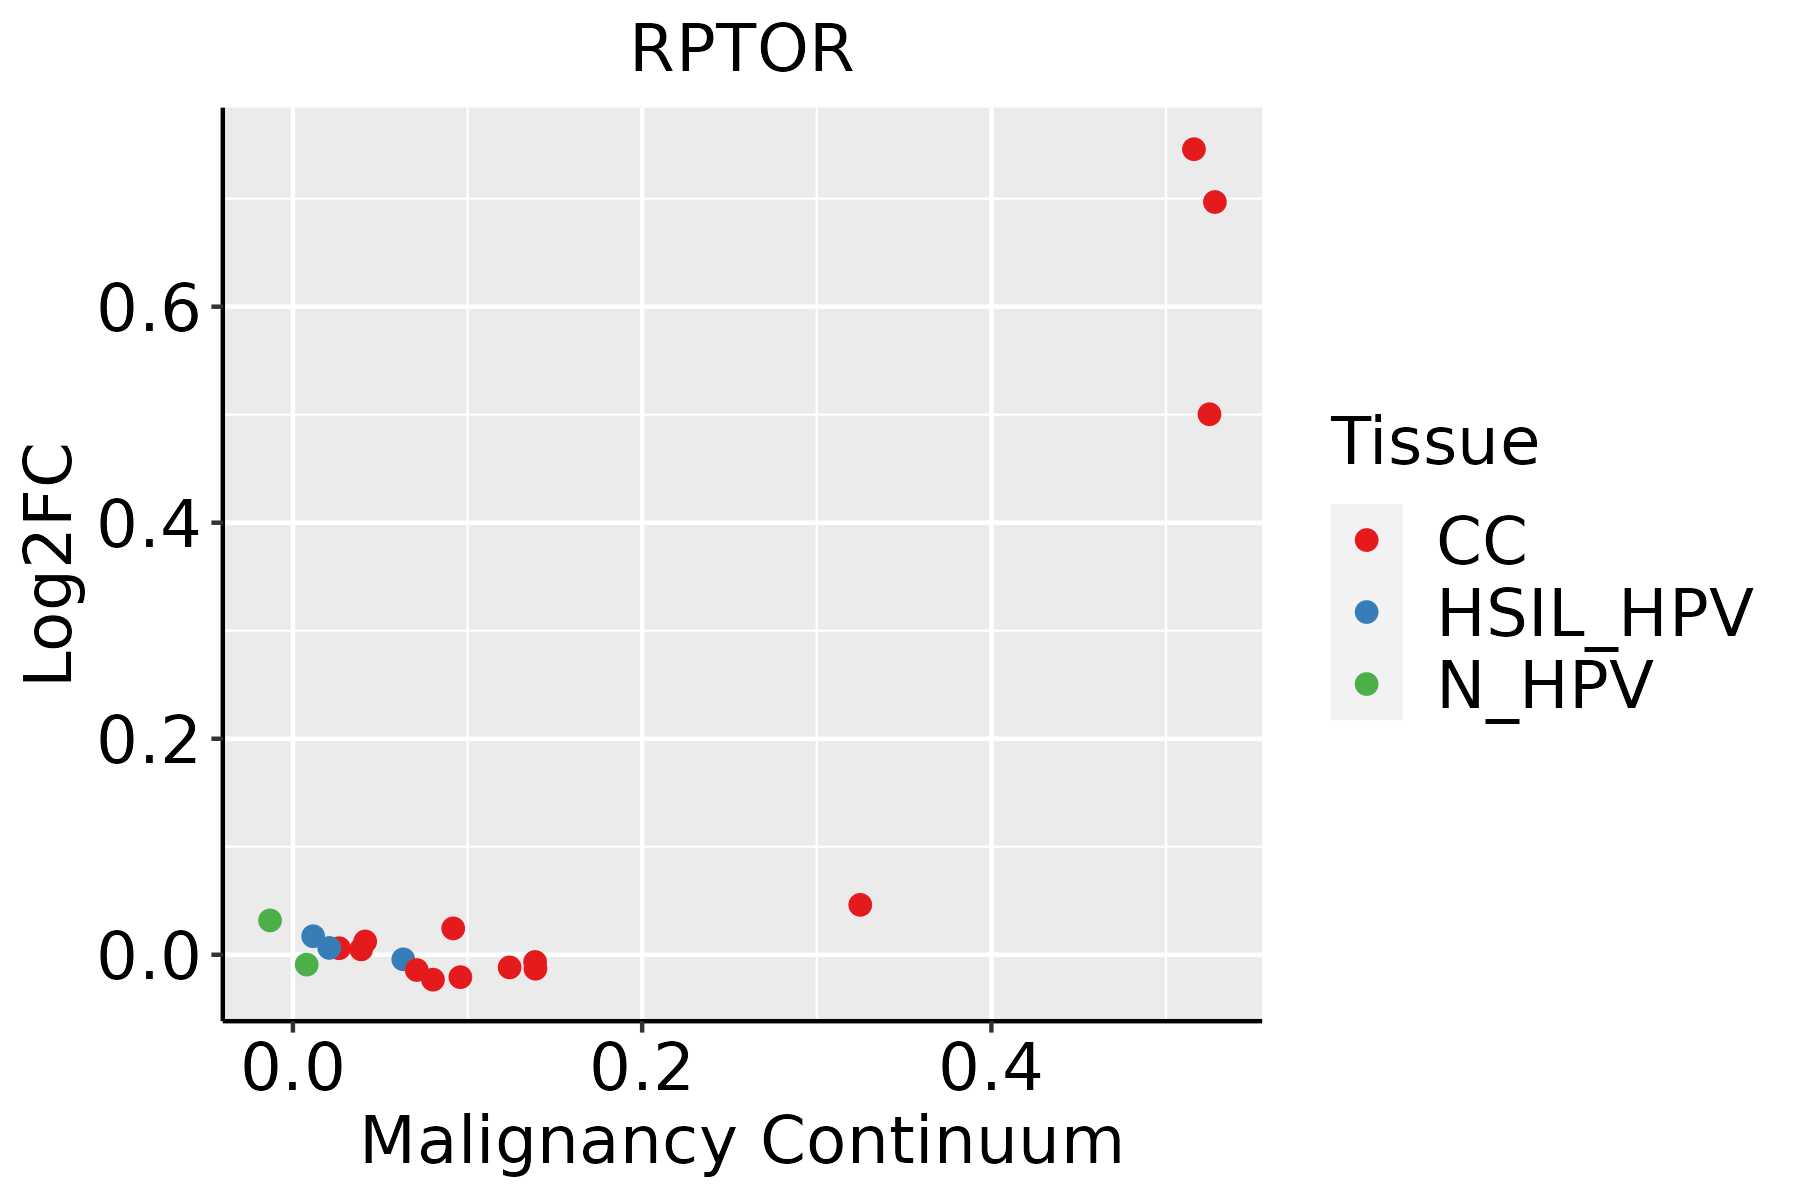 | CC: Cervix cancer |
| HSIL_HPV: HPV-infected high-grade squamous intraepithelial lesions | ||
| N_HPV: HPV-infected normal cervix | ||
| Colorectum (GSE201348) |  | FAP: Familial adenomatous polyposis |
| CRC: Colorectal cancer | ||
| Colorectum (HTA11) |  | AD: Adenomas |
| SER: Sessile serrated lesions | ||
| MSI-H: Microsatellite-high colorectal cancer | ||
| MSS: Microsatellite stable colorectal cancer | ||
| Esophagus | 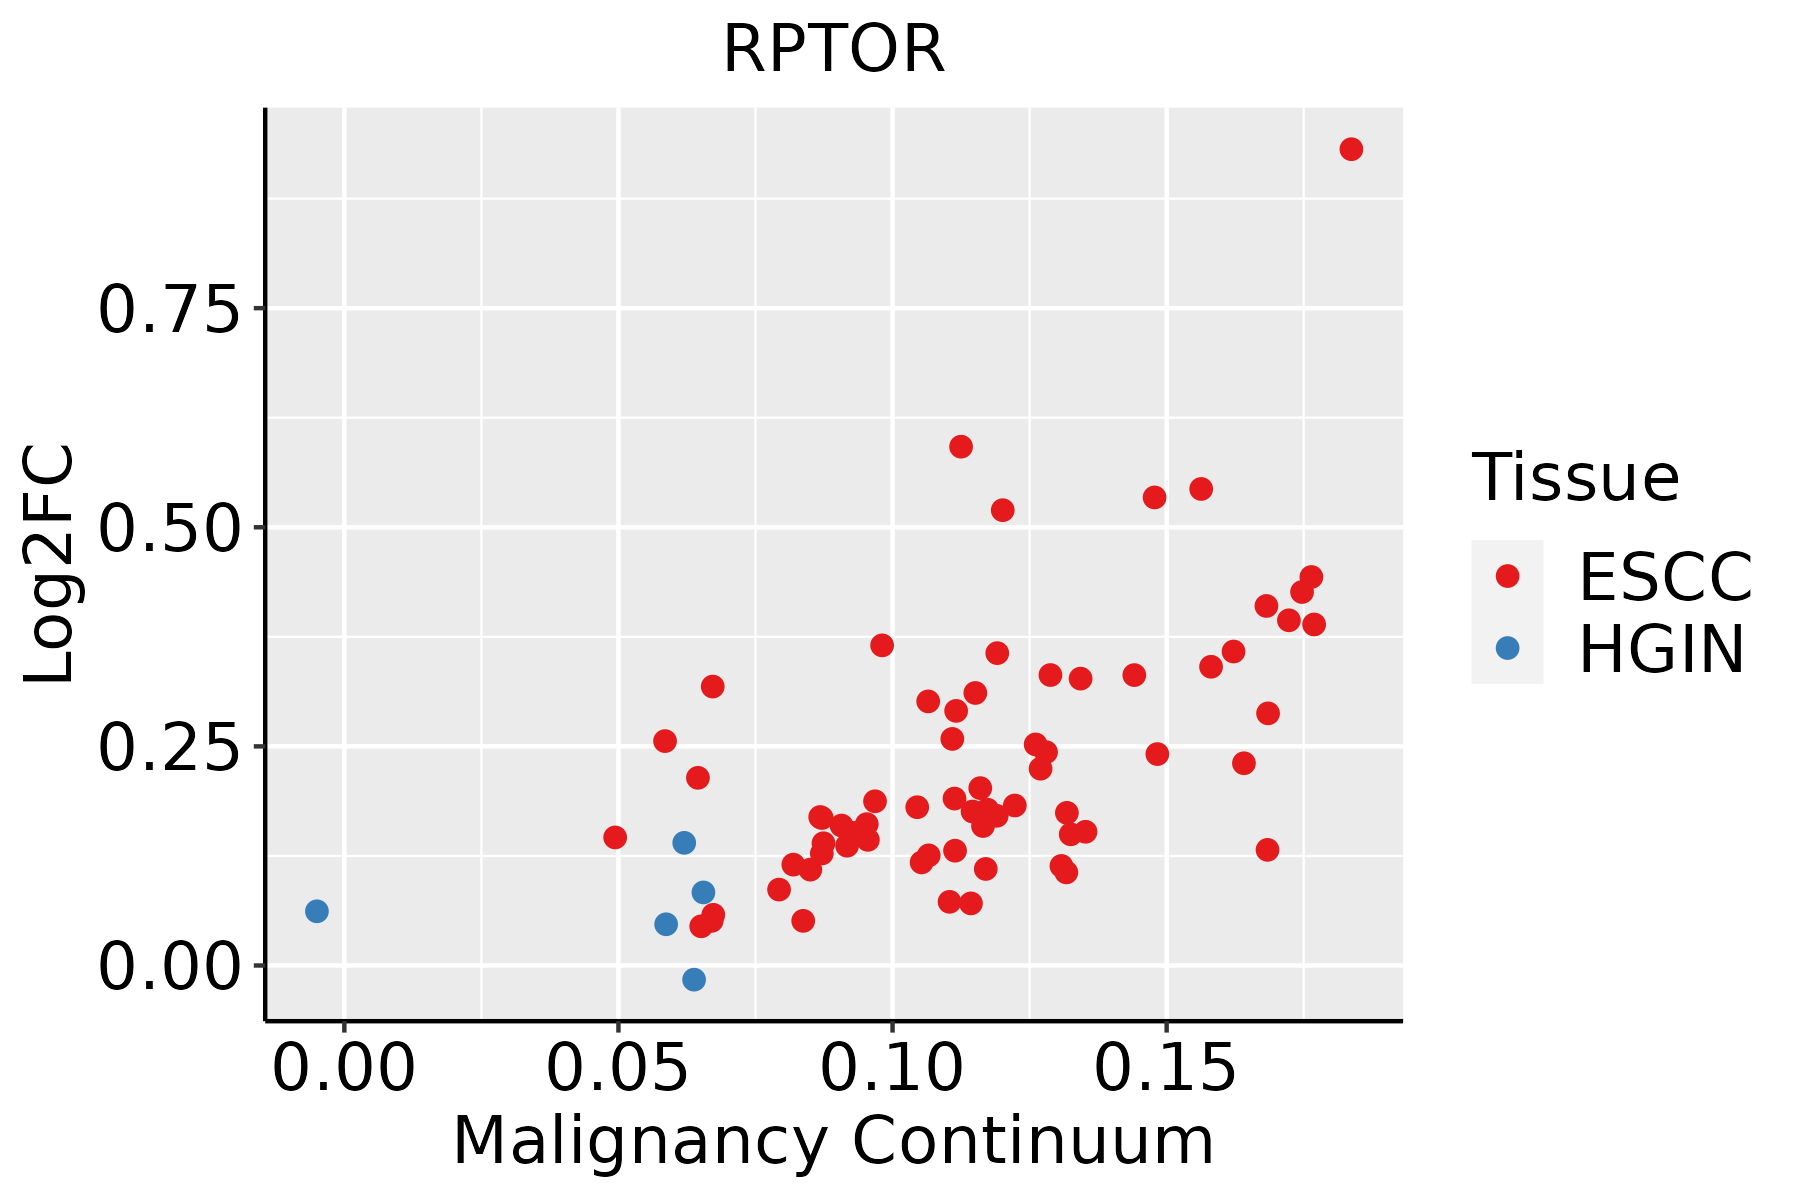 | ESCC: Esophageal squamous cell carcinoma |
| HGIN: High-grade intraepithelial neoplasias | ||
| LGIN: Low-grade intraepithelial neoplasias | ||
| Lung | 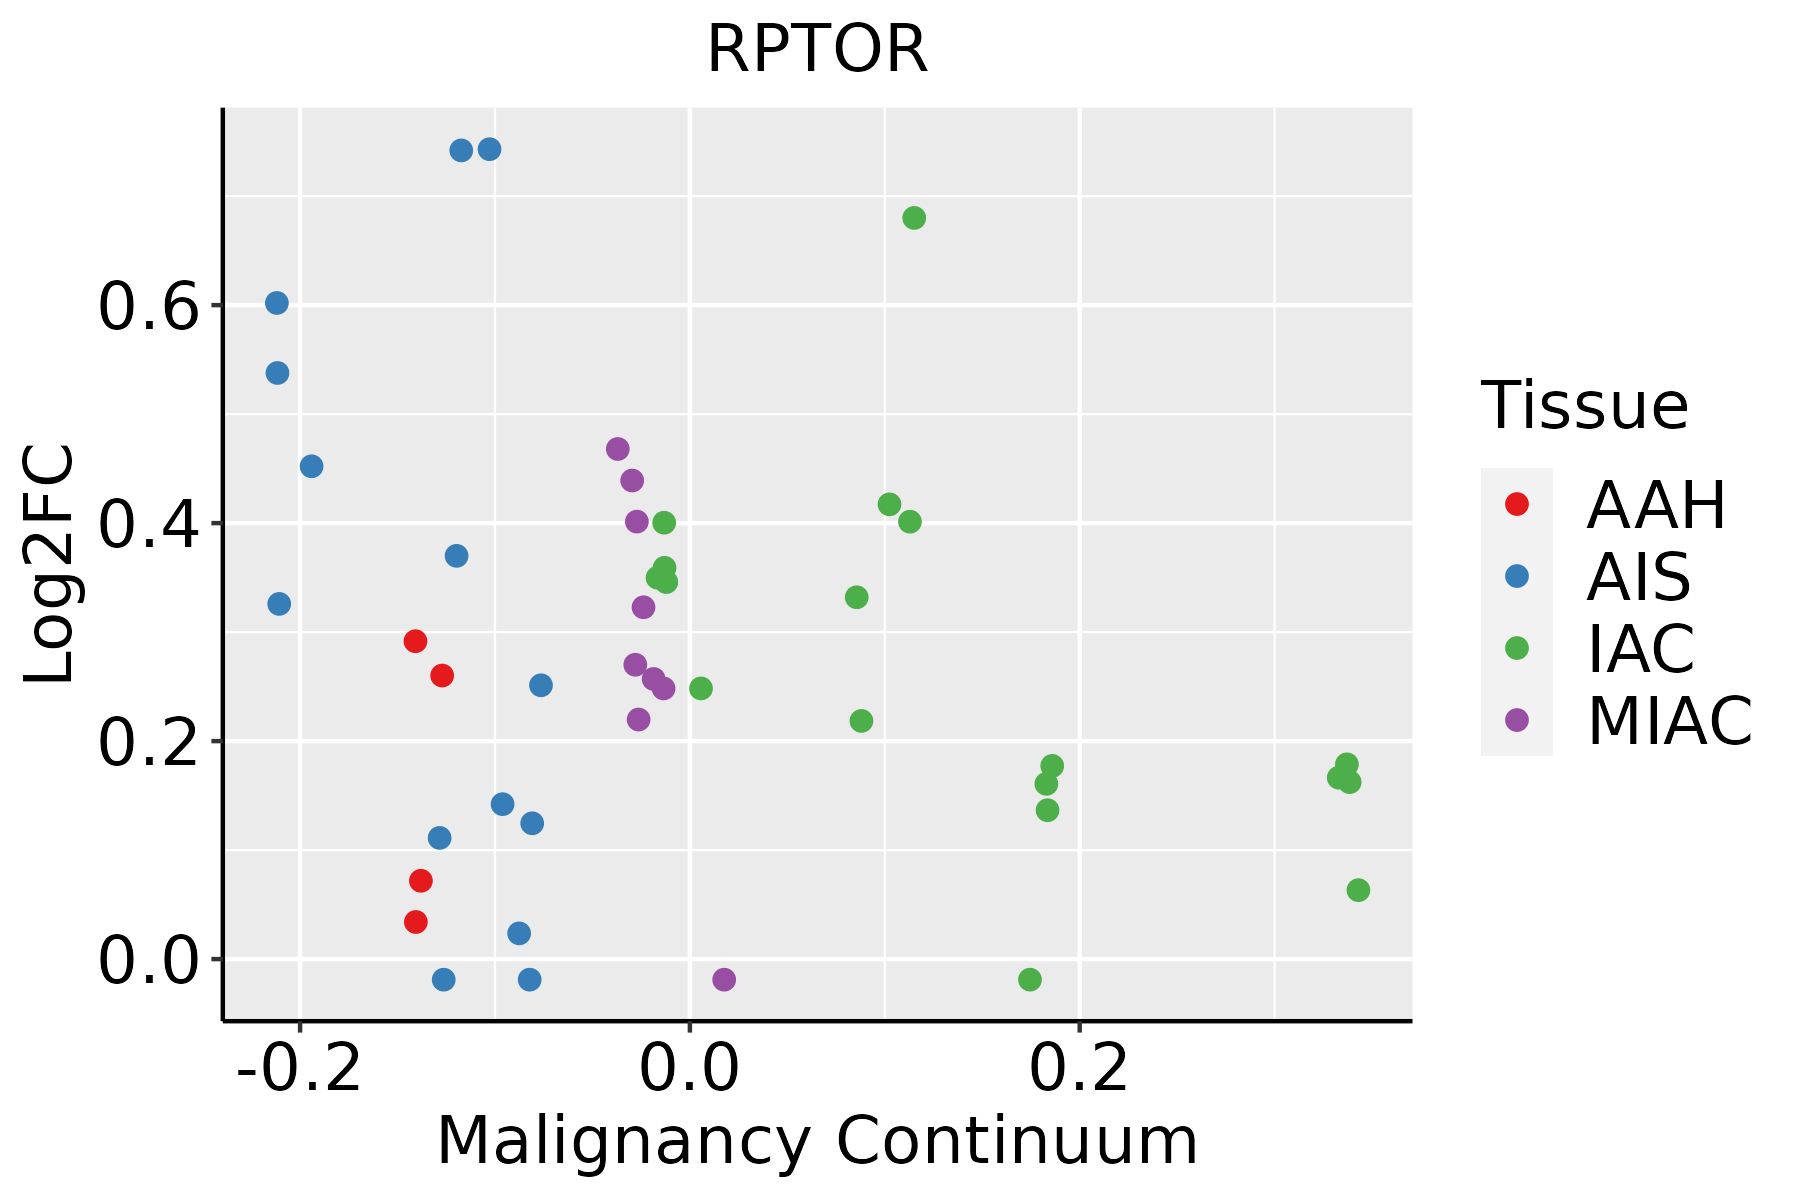 | AAH: Atypical adenomatous hyperplasia |
| AIS: Adenocarcinoma in situ | ||
| IAC: Invasive lung adenocarcinoma | ||
| MIA: Minimally invasive adenocarcinoma |
| ∗log2FC in expression of this searched gene in stem-like cells from each diseased tissue sample relative to stem-like cells in normal samples in each tissue plotted against the malignancy continuum. Samples are colored based on if they are from different disease stage. |
Top |
Malignant transformation related pathway analysis |
| Find out the enriched GO biological processes and KEGG pathways involved in transition from healthy to precancer to cancer |
| Tissue | Disease Stage | Enriched GO biological Processes |
| Colorectum | AD |  |
| Colorectum | SER |  |
| Colorectum | MSS |  |
| Colorectum | MSI-H |  |
| Colorectum | FAP |  |
| ∗Top 15 enriched GO BP terms are showed in the bar plot of each disease state in each tissue. Each row represents a significant GO biological process which is colored according to the -log10(p.adjust). |
| Page: 1 2 3 4 5 6 7 8 9 |
| GO ID | Tissue | Disease Stage | Description | Gene Ratio | Bg Ratio | pvalue | p.adjust | Count |
| GO:007149610 | Cervix | CC | cellular response to external stimulus | 78/2311 | 320/18723 | 1.82e-09 | 1.98e-07 | 78 |
| GO:00506737 | Cervix | CC | epithelial cell proliferation | 98/2311 | 437/18723 | 2.01e-09 | 2.15e-07 | 98 |
| GO:003367410 | Cervix | CC | positive regulation of kinase activity | 101/2311 | 467/18723 | 8.66e-09 | 7.22e-07 | 101 |
| GO:00458608 | Cervix | CC | positive regulation of protein kinase activity | 85/2311 | 386/18723 | 5.61e-08 | 3.29e-06 | 85 |
| GO:00506787 | Cervix | CC | regulation of epithelial cell proliferation | 83/2311 | 381/18723 | 1.31e-07 | 6.42e-06 | 83 |
| GO:00447725 | Cervix | CC | mitotic cell cycle phase transition | 89/2311 | 424/18723 | 2.70e-07 | 1.12e-05 | 89 |
| GO:00316689 | Cervix | CC | cellular response to extracellular stimulus | 59/2311 | 246/18723 | 3.03e-07 | 1.24e-05 | 59 |
| GO:00719007 | Cervix | CC | regulation of protein serine/threonine kinase activity | 75/2311 | 359/18723 | 2.76e-06 | 8.02e-05 | 75 |
| GO:003166710 | Cervix | CC | response to nutrient levels | 92/2311 | 474/18723 | 5.80e-06 | 1.42e-04 | 92 |
| GO:20000453 | Cervix | CC | regulation of G1/S transition of mitotic cell cycle | 37/2311 | 142/18723 | 6.33e-06 | 1.53e-04 | 37 |
| GO:00457876 | Cervix | CC | positive regulation of cell cycle | 66/2311 | 313/18723 | 7.78e-06 | 1.81e-04 | 66 |
| GO:00092678 | Cervix | CC | cellular response to starvation | 39/2311 | 156/18723 | 1.04e-05 | 2.32e-04 | 39 |
| GO:00000824 | Cervix | CC | G1/S transition of mitotic cell cycle | 49/2311 | 214/18723 | 1.16e-05 | 2.48e-04 | 49 |
| GO:00160498 | Cervix | CC | cell growth | 92/2311 | 482/18723 | 1.16e-05 | 2.49e-04 | 92 |
| GO:19028062 | Cervix | CC | regulation of cell cycle G1/S phase transition | 41/2311 | 168/18723 | 1.18e-05 | 2.51e-04 | 41 |
| GO:00425948 | Cervix | CC | response to starvation | 46/2311 | 197/18723 | 1.24e-05 | 2.59e-04 | 46 |
| GO:00073466 | Cervix | CC | regulation of mitotic cell cycle | 88/2311 | 457/18723 | 1.26e-05 | 2.60e-04 | 88 |
| GO:19019903 | Cervix | CC | regulation of mitotic cell cycle phase transition | 63/2311 | 299/18723 | 1.27e-05 | 2.60e-04 | 63 |
| GO:00316698 | Cervix | CC | cellular response to nutrient levels | 49/2311 | 215/18723 | 1.32e-05 | 2.68e-04 | 49 |
| GO:00325359 | Cervix | CC | regulation of cellular component size | 76/2311 | 383/18723 | 1.66e-05 | 3.21e-04 | 76 |
| Page: 1 2 3 4 5 6 7 8 9 10 11 12 13 |
| Pathway ID | Tissue | Disease Stage | Description | Gene Ratio | Bg Ratio | pvalue | p.adjust | qvalue | Count |
| hsa0471420 | Cervix | CC | Thermogenesis | 76/1267 | 232/8465 | 4.29e-12 | 1.16e-10 | 6.85e-11 | 76 |
| hsa0513120 | Cervix | CC | Shigellosis | 69/1267 | 247/8465 | 7.64e-08 | 1.03e-06 | 6.10e-07 | 69 |
| hsa04714110 | Cervix | CC | Thermogenesis | 76/1267 | 232/8465 | 4.29e-12 | 1.16e-10 | 6.85e-11 | 76 |
| hsa05131110 | Cervix | CC | Shigellosis | 69/1267 | 247/8465 | 7.64e-08 | 1.03e-06 | 6.10e-07 | 69 |
| hsa04714 | Colorectum | AD | Thermogenesis | 120/2092 | 232/8465 | 2.76e-19 | 1.16e-17 | 7.37e-18 | 120 |
| hsa05131 | Colorectum | AD | Shigellosis | 109/2092 | 247/8465 | 1.09e-11 | 2.44e-10 | 1.55e-10 | 109 |
| hsa04152 | Colorectum | AD | AMPK signaling pathway | 47/2092 | 121/8465 | 3.74e-04 | 2.82e-03 | 1.80e-03 | 47 |
| hsa04213 | Colorectum | AD | Longevity regulating pathway - multiple species | 27/2092 | 62/8465 | 8.72e-04 | 5.96e-03 | 3.80e-03 | 27 |
| hsa04140 | Colorectum | AD | Autophagy - animal | 49/2092 | 141/8465 | 4.58e-03 | 2.20e-02 | 1.40e-02 | 49 |
| hsa04211 | Colorectum | AD | Longevity regulating pathway | 33/2092 | 89/8465 | 6.15e-03 | 2.68e-02 | 1.71e-02 | 33 |
| hsa047141 | Colorectum | AD | Thermogenesis | 120/2092 | 232/8465 | 2.76e-19 | 1.16e-17 | 7.37e-18 | 120 |
| hsa051311 | Colorectum | AD | Shigellosis | 109/2092 | 247/8465 | 1.09e-11 | 2.44e-10 | 1.55e-10 | 109 |
| hsa041521 | Colorectum | AD | AMPK signaling pathway | 47/2092 | 121/8465 | 3.74e-04 | 2.82e-03 | 1.80e-03 | 47 |
| hsa042131 | Colorectum | AD | Longevity regulating pathway - multiple species | 27/2092 | 62/8465 | 8.72e-04 | 5.96e-03 | 3.80e-03 | 27 |
| hsa041401 | Colorectum | AD | Autophagy - animal | 49/2092 | 141/8465 | 4.58e-03 | 2.20e-02 | 1.40e-02 | 49 |
| hsa042111 | Colorectum | AD | Longevity regulating pathway | 33/2092 | 89/8465 | 6.15e-03 | 2.68e-02 | 1.71e-02 | 33 |
| hsa047144 | Colorectum | MSS | Thermogenesis | 113/1875 | 232/8465 | 1.52e-19 | 4.62e-18 | 2.83e-18 | 113 |
| hsa051314 | Colorectum | MSS | Shigellosis | 94/1875 | 247/8465 | 6.82e-09 | 1.34e-07 | 8.23e-08 | 94 |
| hsa042134 | Colorectum | MSS | Longevity regulating pathway - multiple species | 27/1875 | 62/8465 | 1.33e-04 | 1.17e-03 | 7.18e-04 | 27 |
| hsa042112 | Colorectum | MSS | Longevity regulating pathway | 33/1875 | 89/8465 | 9.33e-04 | 5.58e-03 | 3.42e-03 | 33 |
| Page: 1 2 3 4 5 |
Top |
Cell-cell communication analysis |
| Identification of potential cell-cell interactions between two cell types and their ligand-receptor pairs for different disease states |
| Ligand | Receptor | LRpair | Pathway | Tissue | Disease Stage |
| Page: 1 |
Top |
Single-cell gene regulatory network inference analysis |
| Find out the significant the regulons (TFs) and the target genes of each regulon across cell types for different disease states |
| TF | Cell Type | Tissue | Disease Stage | Target Gene | RSS | Regulon Activity |
| ∗The dot plots of a searched regulon are shown for all cell subpopulations in each disease state of each tissue based on the regulon specific score inferred using pySCENIC and by calculating the average expression. |
| Page: 1 |
Top |
Somatic mutation of malignant transformation related genes |
| Annotation of somatic variants for genes involved in malignant transformation |
| Hugo Symbol | Variant Class | Variant Classification | dbSNP RS | HGVSc | HGVSp | HGVSp Short | SWISSPROT | BIOTYPE | SIFT | PolyPhen | Tumor Sample Barcode | Tissue | Histology | Sex | Age | Stage | Therapy Types | Drugs | Outcome |
| RPTOR | SNV | Missense_Mutation | c.2297N>C | p.Ser766Thr | p.S766T | Q8N122 | protein_coding | tolerated(0.37) | benign(0.027) | TCGA-A2-A04P-01 | Breast | breast invasive carcinoma | Female | <65 | III/IV | Chemotherapy | taxol | PD | |
| RPTOR | SNV | Missense_Mutation | c.1159N>C | p.Asp387His | p.D387H | Q8N122 | protein_coding | deleterious(0) | probably_damaging(0.99) | TCGA-AC-A23H-01 | Breast | breast invasive carcinoma | Female | >=65 | I/II | Unknown | Unknown | PD | |
| RPTOR | SNV | Missense_Mutation | c.2246N>T | p.Gly749Val | p.G749V | Q8N122 | protein_coding | tolerated(0.31) | benign(0.221) | TCGA-AN-A0AK-01 | Breast | breast invasive carcinoma | Female | >=65 | I/II | Unknown | Unknown | SD | |
| RPTOR | SNV | Missense_Mutation | c.223N>T | p.Val75Leu | p.V75L | Q8N122 | protein_coding | tolerated(0.09) | benign(0.052) | TCGA-AN-A0FS-01 | Breast | breast invasive carcinoma | Female | <65 | I/II | Unknown | Unknown | SD | |
| RPTOR | SNV | Missense_Mutation | c.1201A>T | p.Thr401Ser | p.T401S | Q8N122 | protein_coding | tolerated(0.1) | benign(0.022) | TCGA-AO-A124-01 | Breast | breast invasive carcinoma | Female | <65 | I/II | Chemotherapy | doxorubicin | SD | |
| RPTOR | SNV | Missense_Mutation | c.1088N>T | p.Thr363Ile | p.T363I | Q8N122 | protein_coding | deleterious(0) | benign(0.265) | TCGA-AO-A128-01 | Breast | breast invasive carcinoma | Female | <65 | I/II | Chemotherapy | doxorubicin | SD | |
| RPTOR | SNV | Missense_Mutation | rs766868607 | c.3430N>A | p.Val1144Met | p.V1144M | Q8N122 | protein_coding | tolerated(0.06) | probably_damaging(0.959) | TCGA-D8-A1J8-01 | Breast | breast invasive carcinoma | Female | >=65 | I/II | Hormone Therapy | nolvadex | SD |
| RPTOR | SNV | Missense_Mutation | novel | c.3733G>A | p.Glu1245Lys | p.E1245K | Q8N122 | protein_coding | tolerated(0.49) | benign(0.001) | TCGA-E2-A2P6-01 | Breast | breast invasive carcinoma | Female | >=65 | I/II | Hormone Therapy | anastrozole | SD |
| RPTOR | insertion | Frame_Shift_Ins | novel | c.324_325insC | p.Gln109ProfsTer16 | p.Q109Pfs*16 | Q8N122 | protein_coding | TCGA-A2-A0CP-01 | Breast | breast invasive carcinoma | Female | <65 | I/II | Chemotherapy | cytoxan | SD | ||
| RPTOR | insertion | Nonsense_Mutation | novel | c.326_327insCTCCTGAAATAAATGGGTAAATCCTGGACATGAAT | p.Gln109HisfsTer3 | p.Q109Hfs*3 | Q8N122 | protein_coding | TCGA-A2-A0CP-01 | Breast | breast invasive carcinoma | Female | <65 | I/II | Chemotherapy | cytoxan | SD |
| Page: 1 2 3 4 5 6 7 8 9 10 11 12 13 14 15 16 |
Top |
Related drugs of malignant transformation related genes |
| Identification of chemicals and drugs interact with genes involved in malignant transfromation |
| (DGIdb 4.0) |
| Entrez ID | Symbol | Category | Interaction Types | Drug Claim Name | Drug Name | PMIDs |
| 57521 | RPTOR | CLINICALLY ACTIONABLE, KINASE | everolimus | EVEROLIMUS | ||
| 57521 | RPTOR | CLINICALLY ACTIONABLE, KINASE | inhibitor | AZD8055 | AZD-8055 | |
| 57521 | RPTOR | CLINICALLY ACTIONABLE, KINASE | inhibitor | MLN0128 | SAPANISERTIB | |
| 57521 | RPTOR | CLINICALLY ACTIONABLE, KINASE | inhibitor | OSI-027 | OSI-027 |
| Page: 1 |

Copyright 2023-Present -The University of Texas Health Science Center at Houston |