
|
|||||
|
 | |
| |
| |
| |
| |
| |
|
Gene: RPS6KB2 |
Gene summary for RPS6KB2 |
| Gene information | Species | Human | Gene symbol | RPS6KB2 | Gene ID | 6199 |
| Gene name | ribosomal protein S6 kinase B2 | |
| Gene Alias | KLS | |
| Cytomap | 11q13.2 | |
| Gene Type | protein-coding | GO ID | GO:0006412 | UniProtAcc | Q9UBS0 |
Top |
Malignant transformation analysis |
| Identification of the aberrant gene expression in precancerous and cancerous lesions by comparing the gene expression of stem-like cells in diseased tissues with normal stem cells |
| Entrez ID | Symbol | Replicates | Species | Organ | Tissue | Adj P-value | Log2FC | Malignancy |
| 6199 | RPS6KB2 | LZE4T | Human | Esophagus | ESCC | 3.17e-09 | 2.83e-01 | 0.0811 |
| 6199 | RPS6KB2 | LZE5T | Human | Esophagus | ESCC | 5.63e-03 | 2.38e-01 | 0.0514 |
| 6199 | RPS6KB2 | LZE7T | Human | Esophagus | ESCC | 5.23e-03 | 5.07e-01 | 0.0667 |
| 6199 | RPS6KB2 | LZE8T | Human | Esophagus | ESCC | 5.32e-14 | 3.16e-01 | 0.067 |
| 6199 | RPS6KB2 | LZE20T | Human | Esophagus | ESCC | 4.21e-13 | 6.79e-01 | 0.0662 |
| 6199 | RPS6KB2 | LZE22T | Human | Esophagus | ESCC | 6.02e-04 | 4.68e-01 | 0.068 |
| 6199 | RPS6KB2 | LZE24T | Human | Esophagus | ESCC | 5.90e-20 | 7.04e-01 | 0.0596 |
| 6199 | RPS6KB2 | LZE21T | Human | Esophagus | ESCC | 2.72e-05 | 2.51e-01 | 0.0655 |
| 6199 | RPS6KB2 | LZE6T | Human | Esophagus | ESCC | 2.66e-04 | 3.54e-01 | 0.0845 |
| 6199 | RPS6KB2 | P1T-E | Human | Esophagus | ESCC | 2.03e-03 | 3.61e-01 | 0.0875 |
| 6199 | RPS6KB2 | P2T-E | Human | Esophagus | ESCC | 1.36e-26 | 5.52e-01 | 0.1177 |
| 6199 | RPS6KB2 | P4T-E | Human | Esophagus | ESCC | 1.67e-24 | 7.24e-01 | 0.1323 |
| 6199 | RPS6KB2 | P5T-E | Human | Esophagus | ESCC | 6.56e-29 | 7.14e-01 | 0.1327 |
| 6199 | RPS6KB2 | P8T-E | Human | Esophagus | ESCC | 8.11e-44 | 8.15e-01 | 0.0889 |
| 6199 | RPS6KB2 | P9T-E | Human | Esophagus | ESCC | 2.47e-17 | 3.87e-01 | 0.1131 |
| 6199 | RPS6KB2 | P10T-E | Human | Esophagus | ESCC | 5.44e-20 | 3.61e-01 | 0.116 |
| 6199 | RPS6KB2 | P11T-E | Human | Esophagus | ESCC | 9.61e-12 | 6.56e-01 | 0.1426 |
| 6199 | RPS6KB2 | P12T-E | Human | Esophagus | ESCC | 1.33e-31 | 6.29e-01 | 0.1122 |
| 6199 | RPS6KB2 | P15T-E | Human | Esophagus | ESCC | 1.95e-28 | 7.23e-01 | 0.1149 |
| 6199 | RPS6KB2 | P16T-E | Human | Esophagus | ESCC | 2.03e-24 | 5.24e-01 | 0.1153 |
| Page: 1 2 3 4 5 6 7 |
| Tissue | Expression Dynamics | Abbreviation |
| Esophagus | 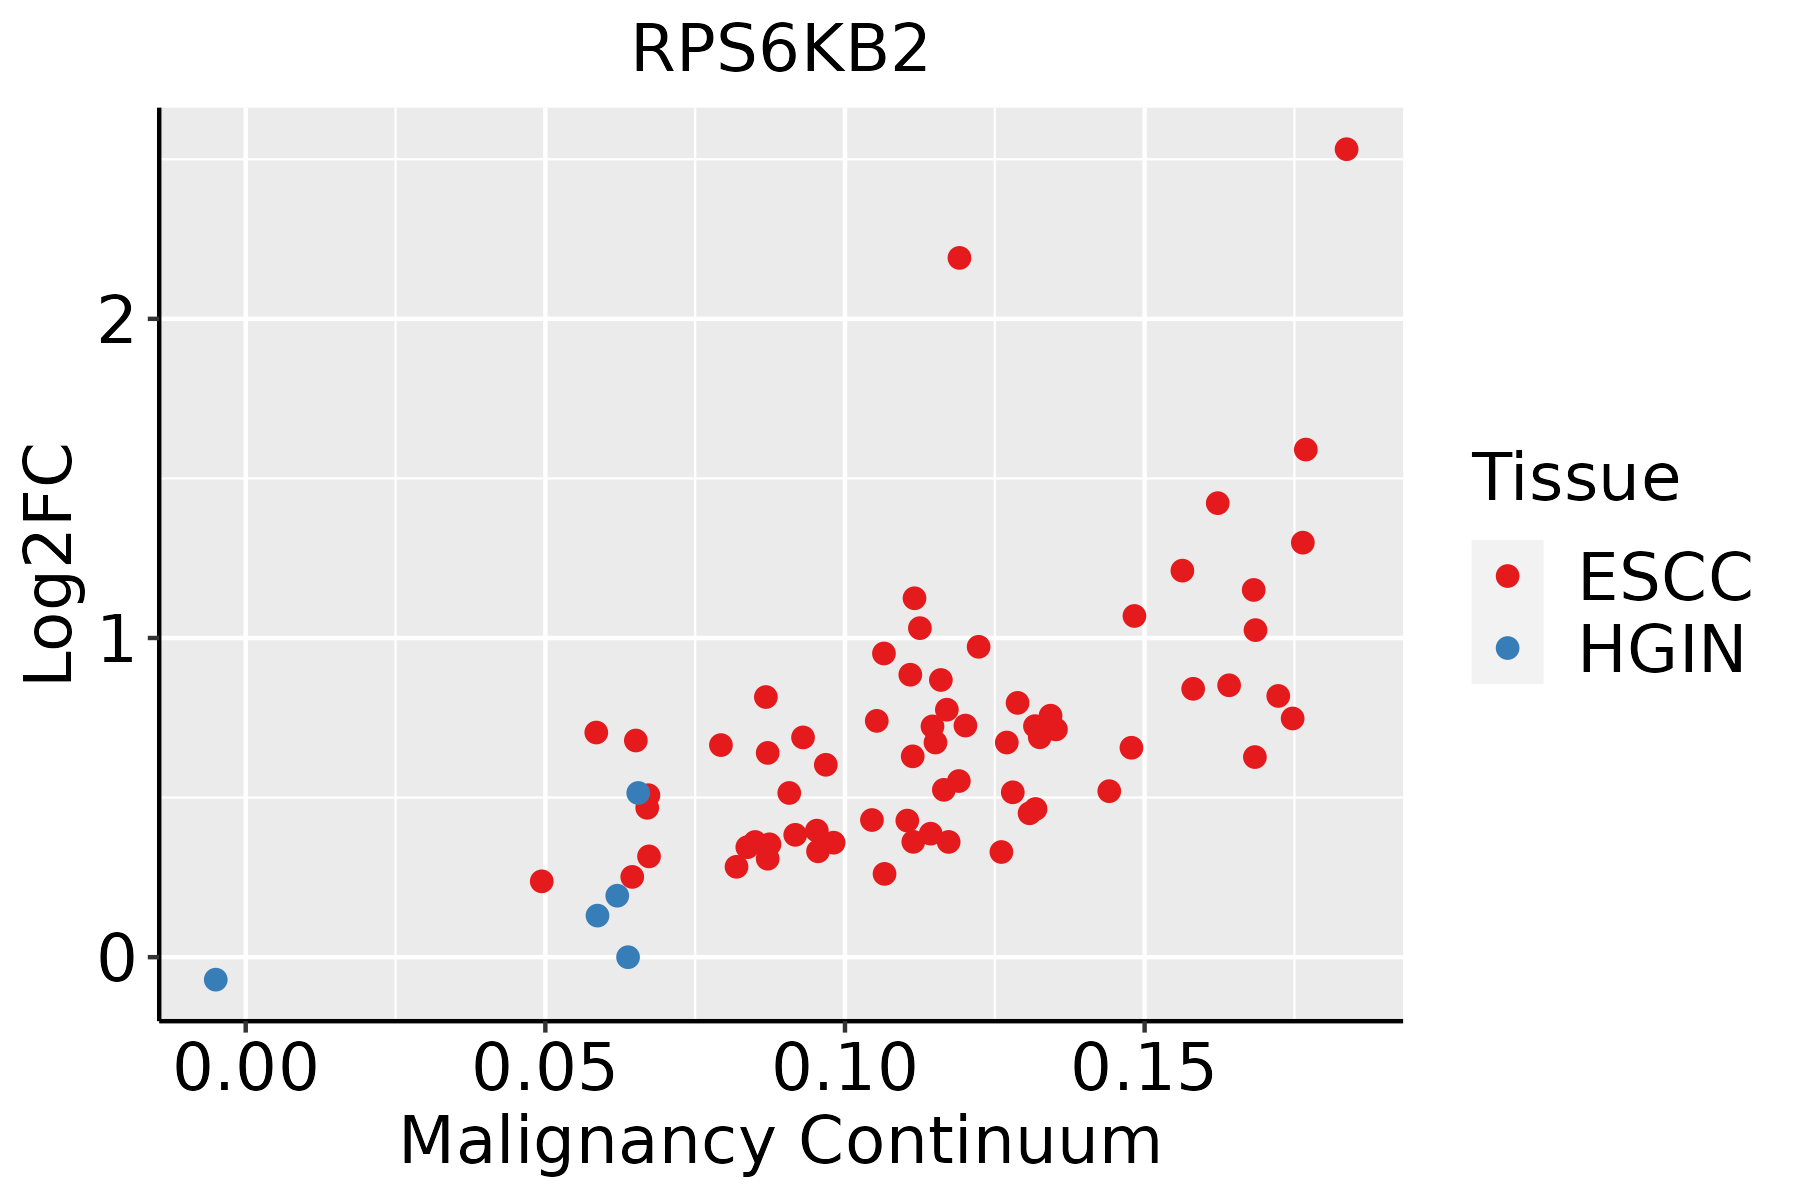 | ESCC: Esophageal squamous cell carcinoma |
| HGIN: High-grade intraepithelial neoplasias | ||
| LGIN: Low-grade intraepithelial neoplasias | ||
| Liver |  | HCC: Hepatocellular carcinoma |
| NAFLD: Non-alcoholic fatty liver disease | ||
| Oral Cavity | 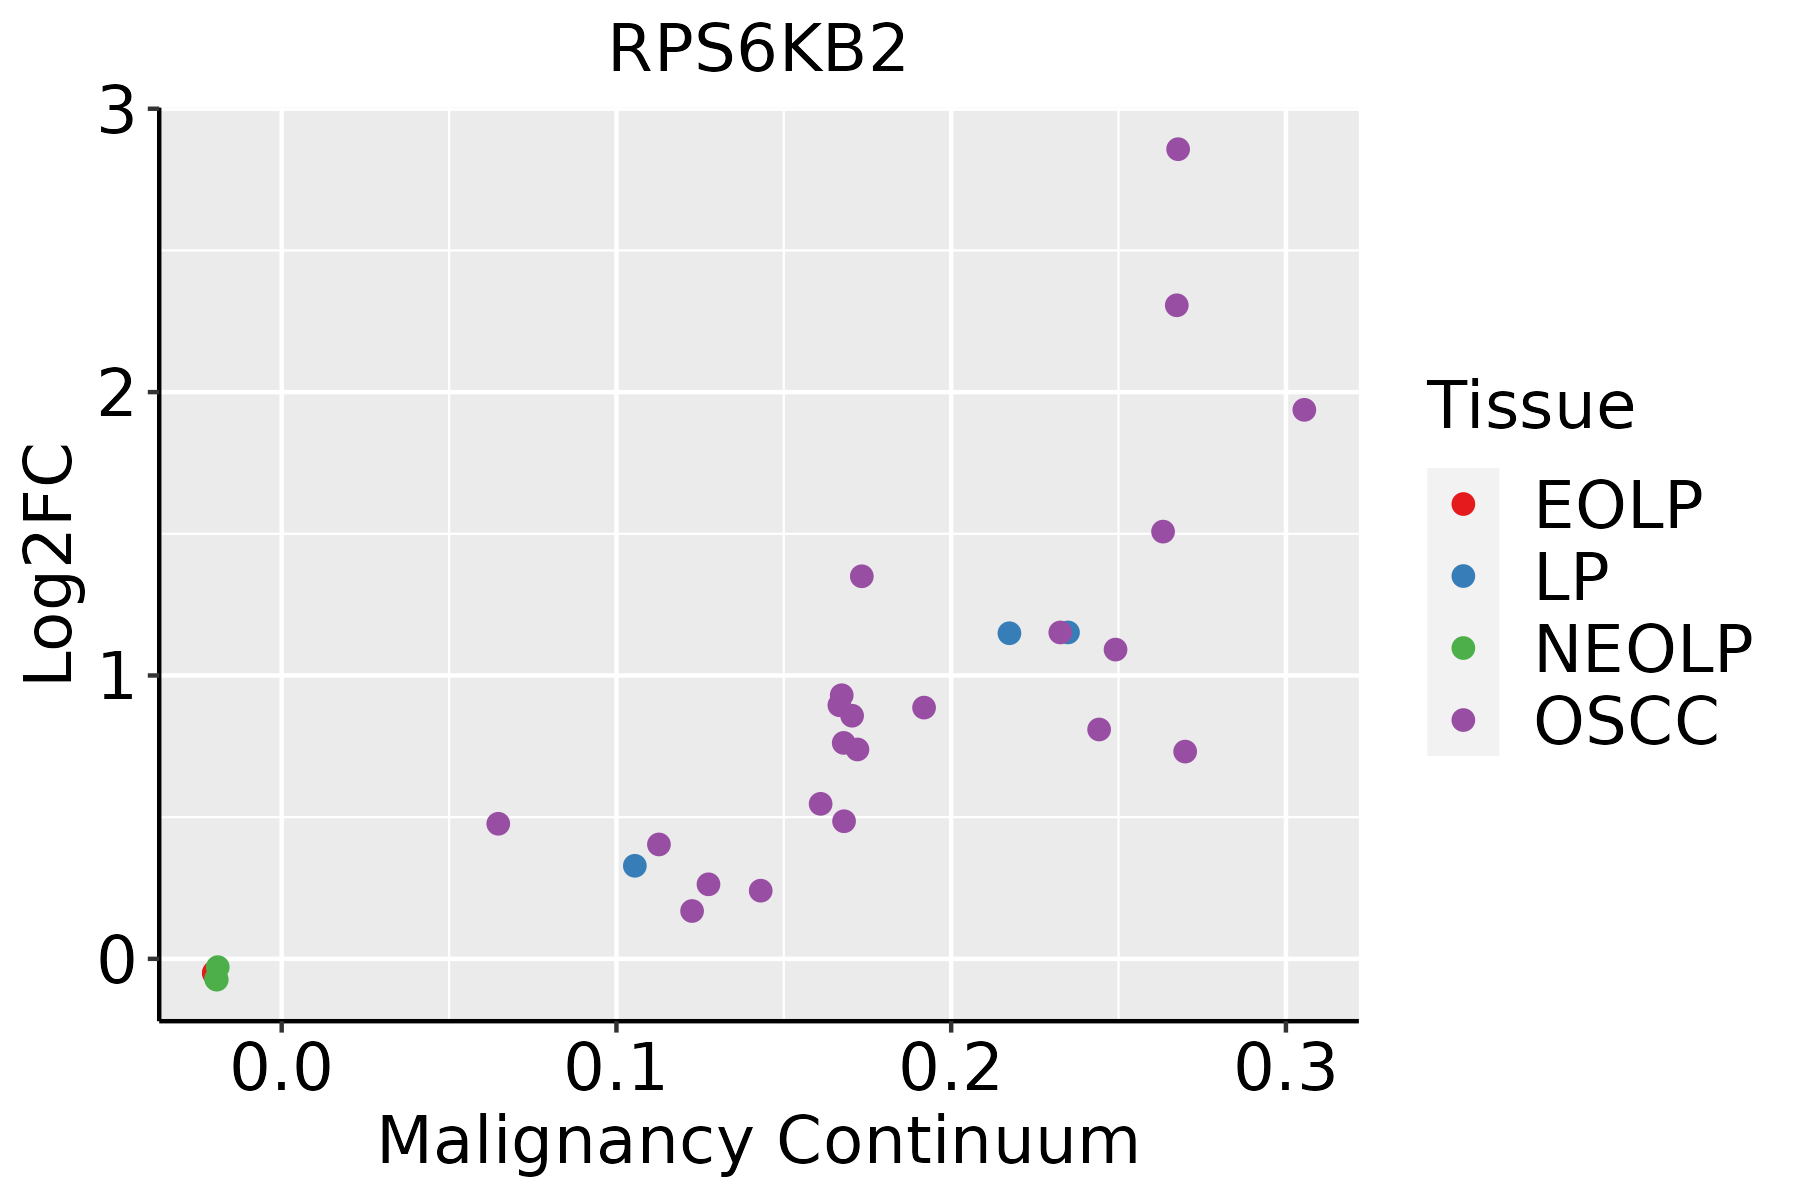 | EOLP: Erosive Oral lichen planus |
| LP: leukoplakia | ||
| NEOLP: Non-erosive oral lichen planus | ||
| OSCC: Oral squamous cell carcinoma | ||
| Skin | 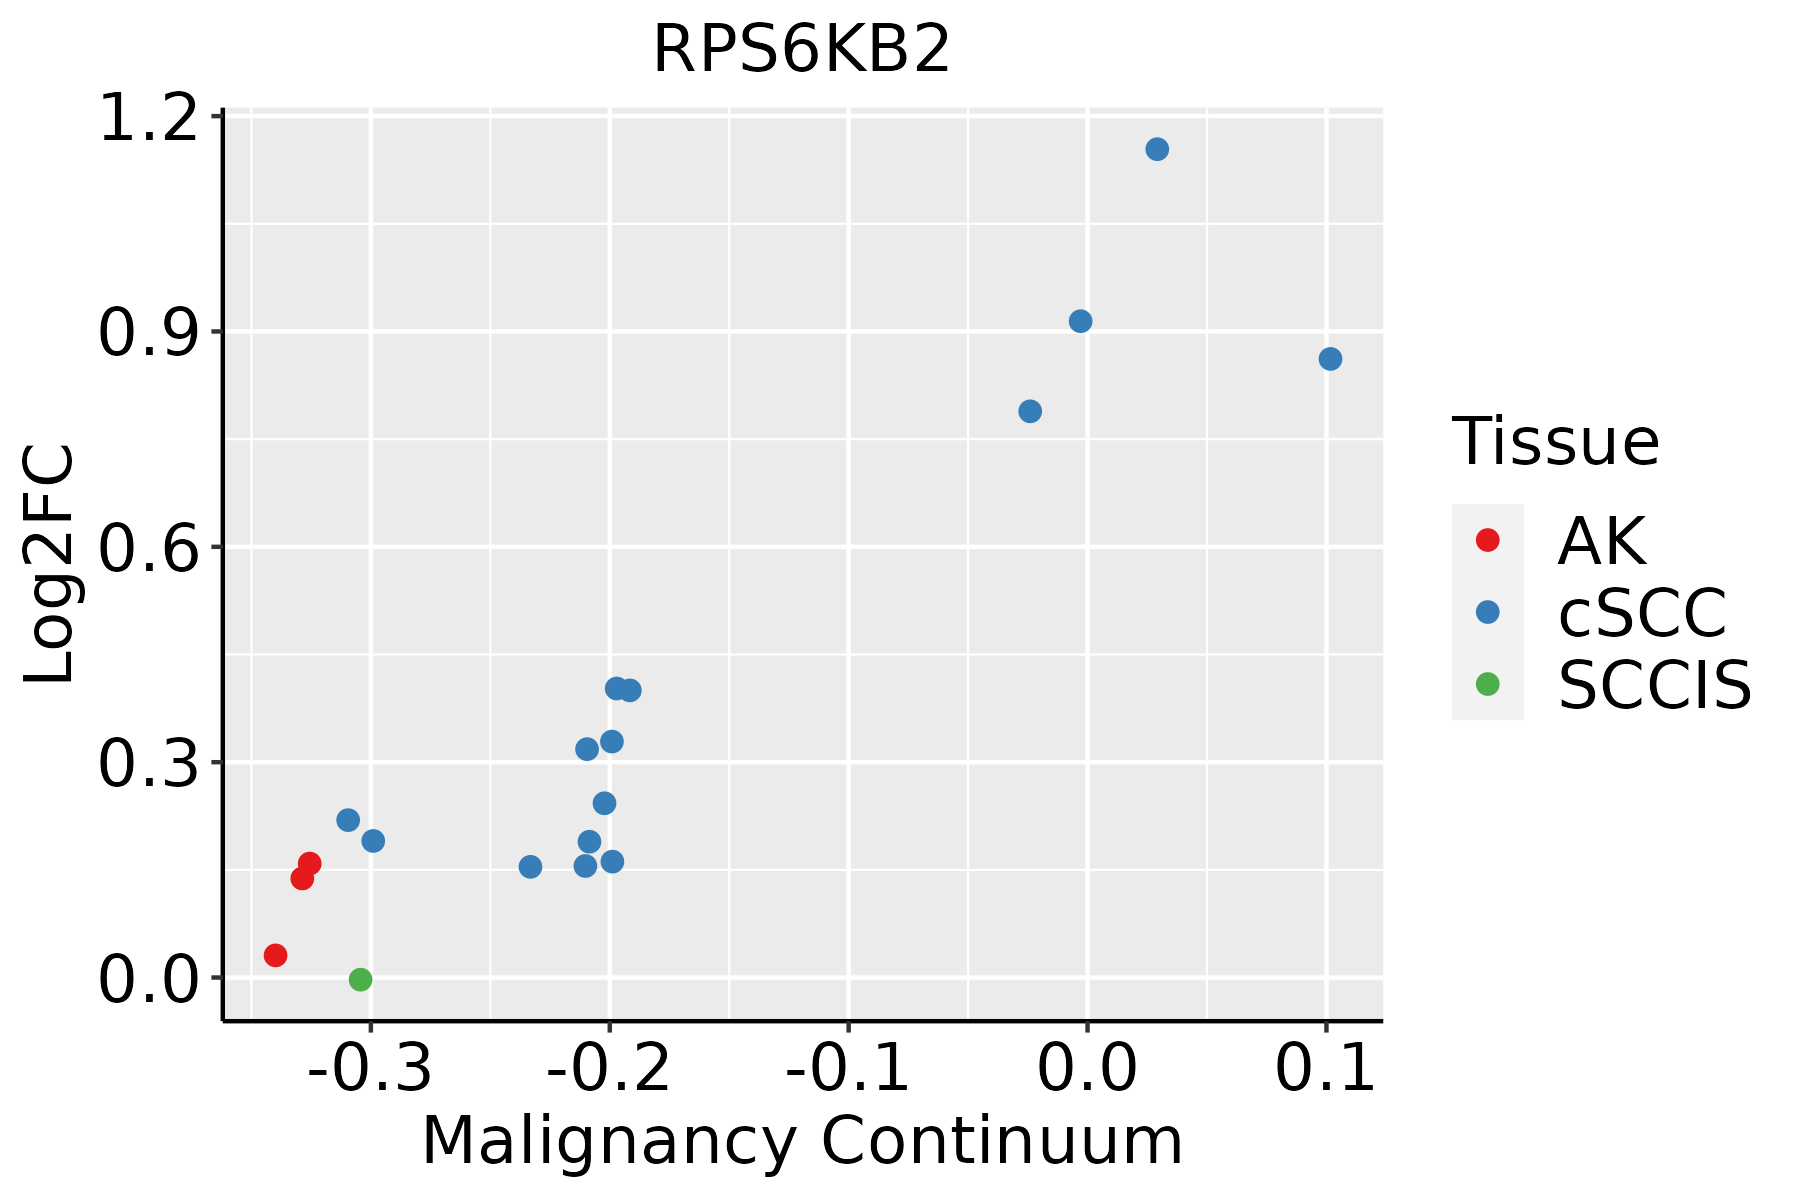 | AK: Actinic keratosis |
| cSCC: Cutaneous squamous cell carcinoma | ||
| SCCIS:squamous cell carcinoma in situ | ||
| Thyroid |  | ATC: Anaplastic thyroid cancer |
| HT: Hashimoto's thyroiditis | ||
| PTC: Papillary thyroid cancer |
| ∗log2FC in expression of this searched gene in stem-like cells from each diseased tissue sample relative to stem-like cells in normal samples in each tissue plotted against the malignancy continuum. Samples are colored based on if they are from different disease stage. |
Top |
Malignant transformation related pathway analysis |
| Find out the enriched GO biological processes and KEGG pathways involved in transition from healthy to precancer to cancer |
| Tissue | Disease Stage | Enriched GO biological Processes |
| Colorectum | AD |  |
| Colorectum | SER |  |
| Colorectum | MSS |  |
| Colorectum | MSI-H |  |
| Colorectum | FAP |  |
| ∗Top 15 enriched GO BP terms are showed in the bar plot of each disease state in each tissue. Each row represents a significant GO biological process which is colored according to the -log10(p.adjust). |
| Page: 1 2 3 4 5 6 7 8 9 |
| GO ID | Tissue | Disease Stage | Description | Gene Ratio | Bg Ratio | pvalue | p.adjust | Count |
| GO:0006413110 | Esophagus | ESCC | translational initiation | 100/8552 | 118/18723 | 1.16e-18 | 1.25e-16 | 100 |
| GO:0006417111 | Esophagus | ESCC | regulation of translation | 304/8552 | 468/18723 | 1.53e-17 | 1.33e-15 | 304 |
| GO:0045727111 | Esophagus | ESCC | positive regulation of translation | 107/8552 | 136/18723 | 2.79e-15 | 1.68e-13 | 107 |
| GO:0034250111 | Esophagus | ESCC | positive regulation of cellular amide metabolic process | 123/8552 | 162/18723 | 3.32e-15 | 1.93e-13 | 123 |
| GO:000644617 | Esophagus | ESCC | regulation of translational initiation | 65/8552 | 79/18723 | 2.04e-11 | 7.07e-10 | 65 |
| GO:00182099 | Esophagus | ESCC | peptidyl-serine modification | 196/8552 | 338/18723 | 3.07e-06 | 3.47e-05 | 196 |
| GO:001810515 | Esophagus | ESCC | peptidyl-serine phosphorylation | 184/8552 | 315/18723 | 3.22e-06 | 3.61e-05 | 184 |
| GO:00319294 | Esophagus | ESCC | TOR signaling | 79/8552 | 126/18723 | 8.57e-05 | 6.21e-04 | 79 |
| GO:00459483 | Esophagus | ESCC | positive regulation of translational initiation | 23/8552 | 30/18723 | 5.47e-04 | 3.00e-03 | 23 |
| GO:000641312 | Liver | Cirrhotic | translational initiation | 76/4634 | 118/18723 | 8.36e-20 | 2.18e-17 | 76 |
| GO:000641712 | Liver | Cirrhotic | regulation of translation | 194/4634 | 468/18723 | 7.28e-16 | 8.79e-14 | 194 |
| GO:00457277 | Liver | Cirrhotic | positive regulation of translation | 71/4634 | 136/18723 | 4.99e-12 | 3.52e-10 | 71 |
| GO:000644612 | Liver | Cirrhotic | regulation of translational initiation | 48/4634 | 79/18723 | 1.14e-11 | 7.14e-10 | 48 |
| GO:003425012 | Liver | Cirrhotic | positive regulation of cellular amide metabolic process | 78/4634 | 162/18723 | 8.62e-11 | 4.66e-09 | 78 |
| GO:0045948 | Liver | Cirrhotic | positive regulation of translational initiation | 15/4634 | 30/18723 | 2.45e-03 | 1.47e-02 | 15 |
| GO:00319292 | Liver | Cirrhotic | TOR signaling | 44/4634 | 126/18723 | 6.69e-03 | 3.30e-02 | 44 |
| GO:000641722 | Liver | HCC | regulation of translation | 287/7958 | 468/18723 | 8.79e-17 | 8.08e-15 | 287 |
| GO:000641322 | Liver | HCC | translational initiation | 94/7958 | 118/18723 | 1.39e-16 | 1.24e-14 | 94 |
| GO:004572712 | Liver | HCC | positive regulation of translation | 97/7958 | 136/18723 | 8.51e-12 | 3.55e-10 | 97 |
| GO:003425022 | Liver | HCC | positive regulation of cellular amide metabolic process | 110/7958 | 162/18723 | 5.14e-11 | 1.92e-09 | 110 |
| Page: 1 2 3 4 |
| Pathway ID | Tissue | Disease Stage | Description | Gene Ratio | Bg Ratio | pvalue | p.adjust | qvalue | Count |
| hsa05131211 | Esophagus | ESCC | Shigellosis | 176/4205 | 247/8465 | 2.27e-12 | 4.01e-11 | 2.05e-11 | 176 |
| hsa04714211 | Esophagus | ESCC | Thermogenesis | 163/4205 | 232/8465 | 9.22e-11 | 1.14e-09 | 5.86e-10 | 163 |
| hsa05170210 | Esophagus | ESCC | Human immunodeficiency virus 1 infection | 147/4205 | 212/8465 | 3.37e-09 | 3.53e-08 | 1.81e-08 | 147 |
| hsa0521020 | Esophagus | ESCC | Colorectal cancer | 69/4205 | 86/8465 | 4.06e-09 | 4.13e-08 | 2.11e-08 | 69 |
| hsa0521216 | Esophagus | ESCC | Pancreatic cancer | 62/4205 | 76/8465 | 7.37e-09 | 6.85e-08 | 3.51e-08 | 62 |
| hsa0516510 | Esophagus | ESCC | Human papillomavirus infection | 215/4205 | 331/8465 | 7.86e-09 | 7.12e-08 | 3.65e-08 | 215 |
| hsa0414010 | Esophagus | ESCC | Autophagy - animal | 101/4205 | 141/8465 | 7.60e-08 | 6.21e-07 | 3.18e-07 | 101 |
| hsa0520529 | Esophagus | ESCC | Proteoglycans in cancer | 138/4205 | 205/8465 | 1.79e-07 | 1.40e-06 | 7.15e-07 | 138 |
| hsa05163210 | Esophagus | ESCC | Human cytomegalovirus infection | 148/4205 | 225/8465 | 5.73e-07 | 4.00e-06 | 2.05e-06 | 148 |
| hsa0406629 | Esophagus | ESCC | HIF-1 signaling pathway | 75/4205 | 109/8465 | 3.66e-05 | 1.68e-04 | 8.60e-05 | 75 |
| hsa0522518 | Esophagus | ESCC | Hepatocellular carcinoma | 109/4205 | 168/8465 | 4.27e-05 | 1.88e-04 | 9.64e-05 | 109 |
| hsa052215 | Esophagus | ESCC | Acute myeloid leukemia | 49/4205 | 67/8465 | 7.43e-05 | 3.07e-04 | 1.57e-04 | 49 |
| hsa0415210 | Esophagus | ESCC | AMPK signaling pathway | 80/4205 | 121/8465 | 1.73e-04 | 6.67e-04 | 3.42e-04 | 80 |
| hsa049109 | Esophagus | ESCC | Insulin signaling pathway | 89/4205 | 137/8465 | 1.97e-04 | 7.32e-04 | 3.75e-04 | 89 |
| hsa0152110 | Esophagus | ESCC | EGFR tyrosine kinase inhibitor resistance | 55/4205 | 79/8465 | 2.44e-04 | 8.78e-04 | 4.50e-04 | 55 |
| hsa041505 | Esophagus | ESCC | mTOR signaling pathway | 98/4205 | 156/8465 | 5.81e-04 | 1.95e-03 | 9.97e-04 | 98 |
| hsa0466620 | Esophagus | ESCC | Fc gamma R-mediated phagocytosis | 63/4205 | 97/8465 | 1.63e-03 | 4.89e-03 | 2.50e-03 | 63 |
| hsa0401218 | Esophagus | ESCC | ErbB signaling pathway | 56/4205 | 85/8465 | 1.78e-03 | 5.24e-03 | 2.68e-03 | 56 |
| hsa043507 | Esophagus | ESCC | TGF-beta signaling pathway | 69/4205 | 108/8465 | 1.92e-03 | 5.54e-03 | 2.84e-03 | 69 |
| hsa049318 | Esophagus | ESCC | Insulin resistance | 69/4205 | 108/8465 | 1.92e-03 | 5.54e-03 | 2.84e-03 | 69 |
| Page: 1 2 3 4 5 6 7 8 9 10 |
Top |
Cell-cell communication analysis |
| Identification of potential cell-cell interactions between two cell types and their ligand-receptor pairs for different disease states |
| Ligand | Receptor | LRpair | Pathway | Tissue | Disease Stage |
| Page: 1 |
Top |
Single-cell gene regulatory network inference analysis |
| Find out the significant the regulons (TFs) and the target genes of each regulon across cell types for different disease states |
| TF | Cell Type | Tissue | Disease Stage | Target Gene | RSS | Regulon Activity |
| ∗The dot plots of a searched regulon are shown for all cell subpopulations in each disease state of each tissue based on the regulon specific score inferred using pySCENIC and by calculating the average expression. |
| Page: 1 |
Top |
Somatic mutation of malignant transformation related genes |
| Annotation of somatic variants for genes involved in malignant transformation |
| Hugo Symbol | Variant Class | Variant Classification | dbSNP RS | HGVSc | HGVSp | HGVSp Short | SWISSPROT | BIOTYPE | SIFT | PolyPhen | Tumor Sample Barcode | Tissue | Histology | Sex | Age | Stage | Therapy Types | Drugs | Outcome |
| RPS6KB2 | SNV | Missense_Mutation | c.1339C>G | p.Leu447Val | p.L447V | Q9UBS0 | protein_coding | tolerated_low_confidence(0.38) | benign(0) | TCGA-A8-A06Q-01 | Breast | breast invasive carcinoma | Female | <65 | III/IV | Unknown | Unknown | SD | |
| RPS6KB2 | SNV | Missense_Mutation | c.840G>C | p.Lys280Asn | p.K280N | Q9UBS0 | protein_coding | deleterious(0.04) | benign(0.348) | TCGA-AC-A23H-01 | Breast | breast invasive carcinoma | Female | >=65 | I/II | Unknown | Unknown | PD | |
| RPS6KB2 | SNV | Missense_Mutation | c.529G>A | p.Glu177Lys | p.E177K | Q9UBS0 | protein_coding | deleterious(0) | probably_damaging(0.999) | TCGA-E2-A1IH-01 | Breast | breast invasive carcinoma | Female | >=65 | I/II | Hormone Therapy | aromasin | SD | |
| RPS6KB2 | insertion | Frame_Shift_Ins | novel | c.300_301insT | p.Leu101SerfsTer19 | p.L101Sfs*19 | Q9UBS0 | protein_coding | TCGA-AQ-A04J-01 | Breast | breast invasive carcinoma | Female | <65 | I/II | Chemotherapy | cytoxan | SD | ||
| RPS6KB2 | insertion | Frame_Shift_Ins | novel | c.302_303insCCAATCGGACTTGAAATCTTCACTGCCCC | p.Arg102GlnfsTer32 | p.R102Qfs*32 | Q9UBS0 | protein_coding | TCGA-AQ-A04J-01 | Breast | breast invasive carcinoma | Female | <65 | I/II | Chemotherapy | cytoxan | SD | ||
| RPS6KB2 | SNV | Missense_Mutation | rs772467031 | c.1018N>T | p.Arg340Cys | p.R340C | Q9UBS0 | protein_coding | deleterious(0) | possibly_damaging(0.696) | TCGA-2W-A8YY-01 | Cervix | cervical & endocervical cancer | Female | <65 | I/II | Chemotherapy | cisplatin | CR |
| RPS6KB2 | SNV | Missense_Mutation | novel | c.944G>A | p.Gly315Asp | p.G315D | Q9UBS0 | protein_coding | deleterious(0.01) | benign(0.279) | TCGA-VS-A9UH-01 | Cervix | cervical & endocervical cancer | Female | <65 | I/II | Chemotherapy | cisplatin | CR |
| RPS6KB2 | SNV | Missense_Mutation | rs777373346 | c.1229N>T | p.Ser410Leu | p.S410L | Q9UBS0 | protein_coding | deleterious(0.03) | benign(0.427) | TCGA-VS-A9UZ-01 | Cervix | cervical & endocervical cancer | Female | <65 | I/II | Unknown | Unknown | SD |
| RPS6KB2 | deletion | Frame_Shift_Del | novel | c.1371_1380delGACCACCGCC | p.Thr458LeufsTer33 | p.T458Lfs*33 | Q9UBS0 | protein_coding | TCGA-DS-A1OB-01 | Cervix | cervical & endocervical cancer | Female | <65 | I/II | Chemotherapy | carboplatin | PD | ||
| RPS6KB2 | deletion | Frame_Shift_Del | novel | c.1371_1380delGACCACCGCC | p.Thr458LeufsTer33 | p.T458Lfs*33 | Q9UBS0 | protein_coding | TCGA-DS-A1OD-01 | Cervix | cervical & endocervical cancer | Female | <65 | I/II | Chemotherapy | cisplatin | SD |
| Page: 1 2 3 4 |
Top |
Related drugs of malignant transformation related genes |
| Identification of chemicals and drugs interact with genes involved in malignant transfromation |
| (DGIdb 4.0) |
| Entrez ID | Symbol | Category | Interaction Types | Drug Claim Name | Drug Name | PMIDs |
| 6199 | RPS6KB2 | DRUGGABLE GENOME, SERINE THREONINE KINASE, ENZYME, KINASE, CLINICALLY ACTIONABLE | inhibitor | CHEMBL3545003 | MSC-2363318A | |
| 6199 | RPS6KB2 | DRUGGABLE GENOME, SERINE THREONINE KINASE, ENZYME, KINASE, CLINICALLY ACTIONABLE | inhibitor | CHEMBL3544935 | XL-418 | |
| 6199 | RPS6KB2 | DRUGGABLE GENOME, SERINE THREONINE KINASE, ENZYME, KINASE, CLINICALLY ACTIONABLE | inhibitor | CHEMBL3545134 | LY-2780301 |
| Page: 1 |

Copyright 2023-Present -The University of Texas Health Science Center at Houston |