
|
|||||
|
 | |
| |
| |
| |
| |
| |
|
Gene: RPS6KA6 |
Gene summary for RPS6KA6 |
| Gene information | Species | Human | Gene symbol | RPS6KA6 | Gene ID | 27330 |
| Gene name | ribosomal protein S6 kinase A6 | |
| Gene Alias | PP90RSK4 | |
| Cytomap | Xq21.1 | |
| Gene Type | protein-coding | GO ID | GO:0000165 | UniProtAcc | Q9UK32 |
Top |
Malignant transformation analysis |
| Identification of the aberrant gene expression in precancerous and cancerous lesions by comparing the gene expression of stem-like cells in diseased tissues with normal stem cells |
| Entrez ID | Symbol | Replicates | Species | Organ | Tissue | Adj P-value | Log2FC | Malignancy |
| 27330 | RPS6KA6 | HCC1 | Human | Liver | HCC | 2.79e-18 | 2.07e+00 | 0.5336 |
| 27330 | RPS6KA6 | HCC2 | Human | Liver | HCC | 1.22e-25 | 2.06e+00 | 0.5341 |
| 27330 | RPS6KA6 | HCC5 | Human | Liver | HCC | 1.26e-41 | 2.03e+00 | 0.4932 |
| Page: 1 |
| Tissue | Expression Dynamics | Abbreviation |
| Liver | 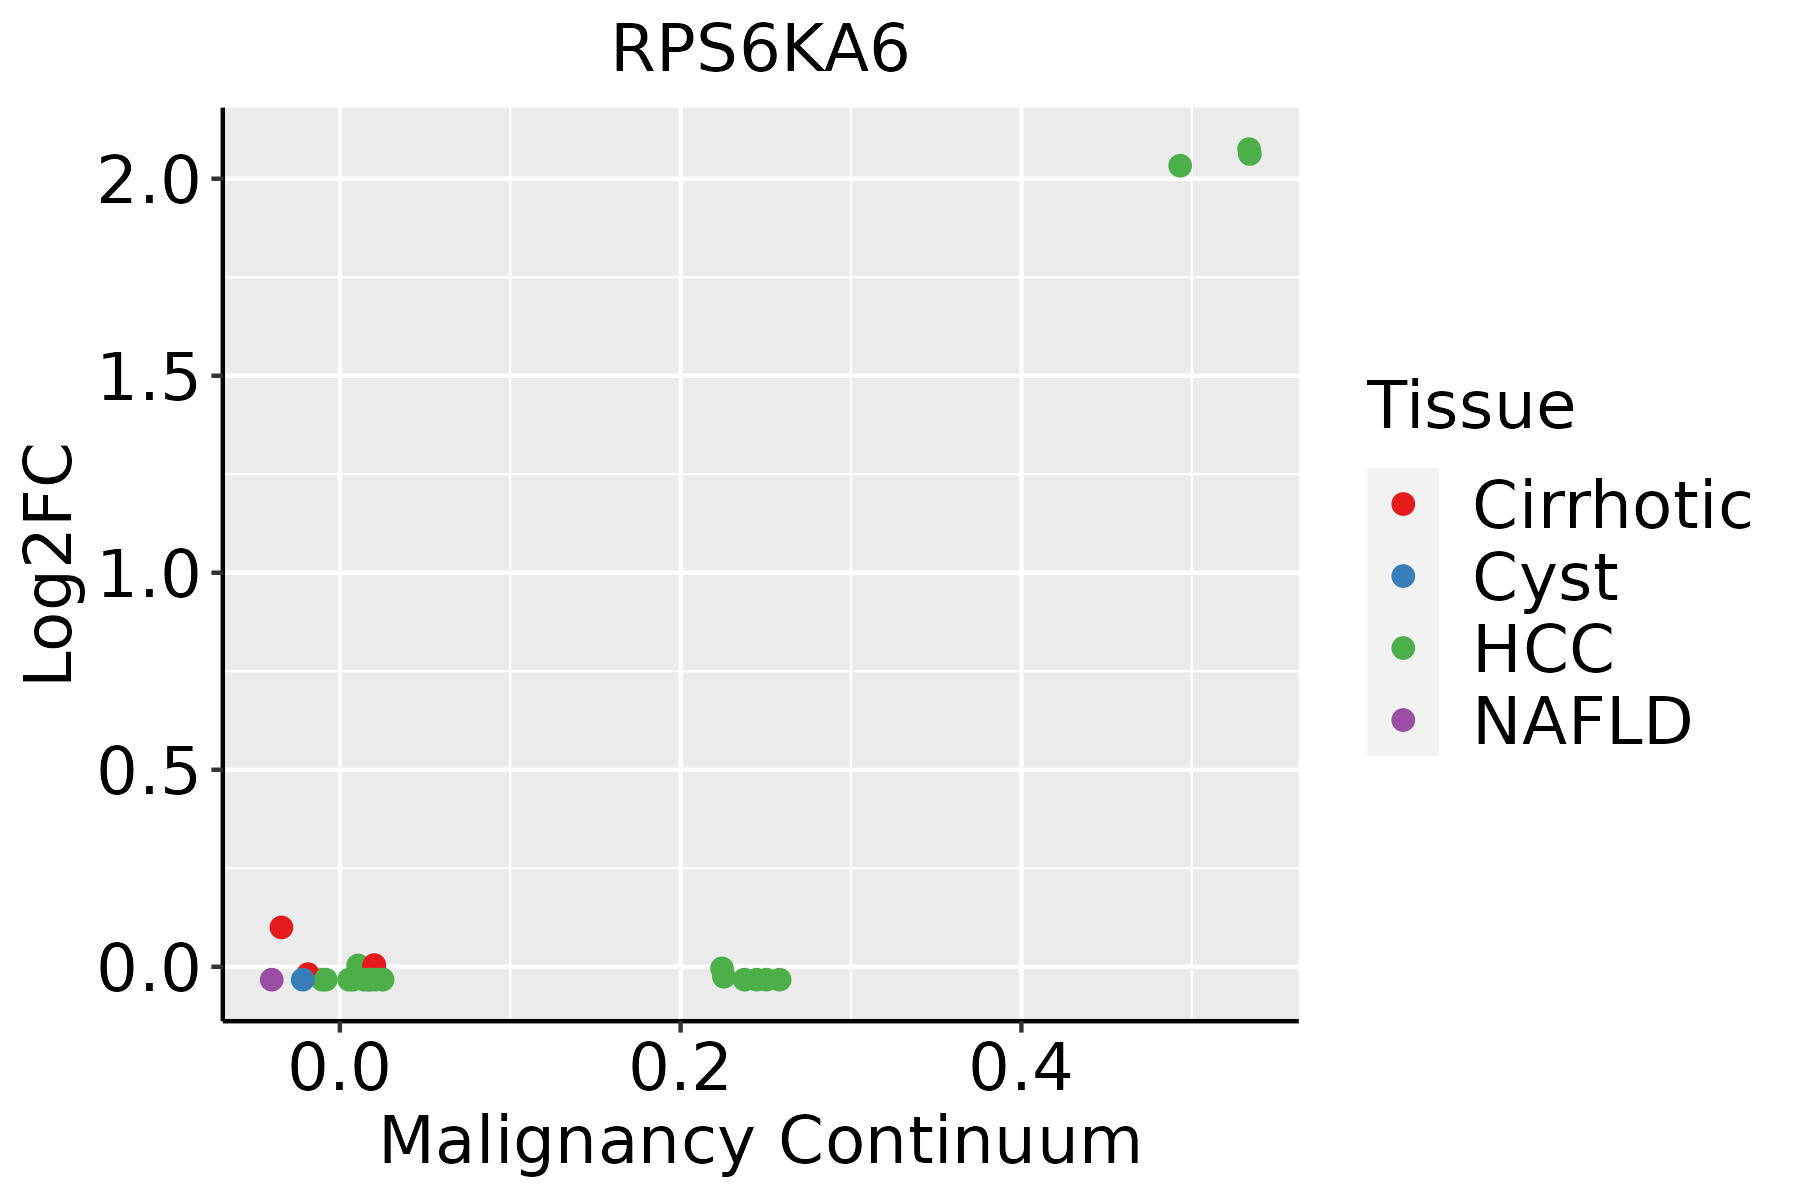 | HCC: Hepatocellular carcinoma |
| NAFLD: Non-alcoholic fatty liver disease |
| ∗log2FC in expression of this searched gene in stem-like cells from each diseased tissue sample relative to stem-like cells in normal samples in each tissue plotted against the malignancy continuum. Samples are colored based on if they are from different disease stage. |
Top |
Malignant transformation related pathway analysis |
| Find out the enriched GO biological processes and KEGG pathways involved in transition from healthy to precancer to cancer |
| Tissue | Disease Stage | Enriched GO biological Processes |
| Colorectum | AD |  |
| Colorectum | SER |  |
| Colorectum | MSS |  |
| Colorectum | MSI-H |  |
| Colorectum | FAP |  |
| ∗Top 15 enriched GO BP terms are showed in the bar plot of each disease state in each tissue. Each row represents a significant GO biological process which is colored according to the -log10(p.adjust). |
| Page: 1 2 3 4 5 6 7 8 9 |
| GO ID | Tissue | Disease Stage | Description | Gene Ratio | Bg Ratio | pvalue | p.adjust | Count |
| GO:007233122 | Liver | HCC | signal transduction by p53 class mediator | 108/7958 | 163/18723 | 7.14e-10 | 2.23e-08 | 108 |
| GO:00427702 | Liver | HCC | signal transduction in response to DNA damage | 103/7958 | 172/18723 | 3.05e-06 | 4.04e-05 | 103 |
| GO:001810511 | Liver | HCC | peptidyl-serine phosphorylation | 169/7958 | 315/18723 | 3.86e-05 | 3.81e-04 | 169 |
| GO:001820911 | Liver | HCC | peptidyl-serine modification | 177/7958 | 338/18723 | 1.45e-04 | 1.17e-03 | 177 |
| GO:003033021 | Liver | HCC | DNA damage response, signal transduction by p53 class mediator | 46/7958 | 72/18723 | 2.02e-04 | 1.56e-03 | 46 |
| GO:00434097 | Liver | HCC | negative regulation of MAPK cascade | 98/7958 | 180/18723 | 7.88e-04 | 4.74e-03 | 98 |
| Page: 1 |
| Pathway ID | Tissue | Disease Stage | Description | Gene Ratio | Bg Ratio | pvalue | p.adjust | qvalue | Count |
| hsa0471422 | Liver | HCC | Thermogenesis | 170/4020 | 232/8465 | 5.36e-16 | 2.25e-14 | 1.25e-14 | 170 |
| hsa0493121 | Liver | HCC | Insulin resistance | 77/4020 | 108/8465 | 3.89e-07 | 4.46e-06 | 2.48e-06 | 77 |
| hsa0513542 | Liver | HCC | Yersinia infection | 92/4020 | 137/8465 | 2.25e-06 | 2.19e-05 | 1.22e-05 | 92 |
| hsa041502 | Liver | HCC | mTOR signaling pathway | 95/4020 | 156/8465 | 4.70e-04 | 1.99e-03 | 1.11e-03 | 95 |
| hsa0471432 | Liver | HCC | Thermogenesis | 170/4020 | 232/8465 | 5.36e-16 | 2.25e-14 | 1.25e-14 | 170 |
| hsa0493131 | Liver | HCC | Insulin resistance | 77/4020 | 108/8465 | 3.89e-07 | 4.46e-06 | 2.48e-06 | 77 |
| hsa0513552 | Liver | HCC | Yersinia infection | 92/4020 | 137/8465 | 2.25e-06 | 2.19e-05 | 1.22e-05 | 92 |
| hsa0415011 | Liver | HCC | mTOR signaling pathway | 95/4020 | 156/8465 | 4.70e-04 | 1.99e-03 | 1.11e-03 | 95 |
| Page: 1 |
Top |
Cell-cell communication analysis |
| Identification of potential cell-cell interactions between two cell types and their ligand-receptor pairs for different disease states |
| Ligand | Receptor | LRpair | Pathway | Tissue | Disease Stage |
| Page: 1 |
Top |
Single-cell gene regulatory network inference analysis |
| Find out the significant the regulons (TFs) and the target genes of each regulon across cell types for different disease states |
| TF | Cell Type | Tissue | Disease Stage | Target Gene | RSS | Regulon Activity |
| ∗The dot plots of a searched regulon are shown for all cell subpopulations in each disease state of each tissue based on the regulon specific score inferred using pySCENIC and by calculating the average expression. |
| Page: 1 |
Top |
Somatic mutation of malignant transformation related genes |
| Annotation of somatic variants for genes involved in malignant transformation |
| Hugo Symbol | Variant Class | Variant Classification | dbSNP RS | HGVSc | HGVSp | HGVSp Short | SWISSPROT | BIOTYPE | SIFT | PolyPhen | Tumor Sample Barcode | Tissue | Histology | Sex | Age | Stage | Therapy Types | Drugs | Outcome |
| RPS6KA6 | SNV | Missense_Mutation | c.196N>A | p.Glu66Lys | p.E66K | Q9UK32 | protein_coding | deleterious(0.01) | benign(0.082) | TCGA-A2-A0CW-01 | Breast | breast invasive carcinoma | Female | >=65 | I/II | Hormone Therapy | anastrozole | SD | |
| RPS6KA6 | SNV | Missense_Mutation | novel | c.355C>T | p.Arg119Trp | p.R119W | Q9UK32 | protein_coding | deleterious(0) | probably_damaging(0.99) | TCGA-AN-A046-01 | Breast | breast invasive carcinoma | Female | >=65 | I/II | Unknown | Unknown | SD |
| RPS6KA6 | SNV | Missense_Mutation | rs771160466 | c.1183N>G | p.Ile395Val | p.I395V | Q9UK32 | protein_coding | tolerated(0.32) | benign(0) | TCGA-BH-A0EE-01 | Breast | breast invasive carcinoma | Female | >=65 | I/II | Chemotherapy | docetaxel | SD |
| RPS6KA6 | SNV | Missense_Mutation | novel | c.2197N>A | p.Gln733Lys | p.Q733K | Q9UK32 | protein_coding | tolerated(0.44) | benign(0.023) | TCGA-C8-A134-01 | Breast | breast invasive carcinoma | Female | <65 | I/II | Chemotherapy | 5-fluorouracil | CR |
| RPS6KA6 | SNV | Missense_Mutation | c.2028N>T | p.Gln676His | p.Q676H | Q9UK32 | protein_coding | deleterious(0.02) | possibly_damaging(0.838) | TCGA-C8-A1HM-01 | Breast | breast invasive carcinoma | Female | >=65 | I/II | Chemotherapy | doxorubicin | CR | |
| RPS6KA6 | SNV | Missense_Mutation | c.629G>A | p.Gly210Glu | p.G210E | Q9UK32 | protein_coding | deleterious(0) | probably_damaging(0.997) | TCGA-PE-A5DE-01 | Breast | breast invasive carcinoma | Female | <65 | I/II | Chemotherapy | taxotere | CR | |
| RPS6KA6 | SNV | Missense_Mutation | novel | c.1993N>T | p.His665Tyr | p.H665Y | Q9UK32 | protein_coding | tolerated(0.13) | benign(0.191) | TCGA-C5-A8XJ-01 | Cervix | cervical & endocervical cancer | Female | >=65 | I/II | Chemotherapy | cisplatin | SD |
| RPS6KA6 | SNV | Missense_Mutation | c.2042C>T | p.Ser681Leu | p.S681L | Q9UK32 | protein_coding | deleterious(0.01) | benign(0.102) | TCGA-EK-A2PG-01 | Cervix | cervical & endocervical cancer | Female | >=65 | I/II | Unknown | Unknown | SD | |
| RPS6KA6 | SNV | Missense_Mutation | c.895N>A | p.Glu299Lys | p.E299K | Q9UK32 | protein_coding | deleterious(0.04) | possibly_damaging(0.542) | TCGA-EK-A3GN-01 | Cervix | cervical & endocervical cancer | Female | <65 | III/IV | Unknown | Unknown | SD | |
| RPS6KA6 | SNV | Missense_Mutation | c.1958N>T | p.Ser653Leu | p.S653L | Q9UK32 | protein_coding | deleterious(0.02) | probably_damaging(0.995) | TCGA-LP-A4AU-01 | Cervix | cervical & endocervical cancer | Female | <65 | III/IV | Chemotherapy | cisplatin | CR |
| Page: 1 2 3 4 5 6 7 8 9 10 11 12 13 14 15 |
Top |
Related drugs of malignant transformation related genes |
| Identification of chemicals and drugs interact with genes involved in malignant transfromation |
| (DGIdb 4.0) |
| Entrez ID | Symbol | Category | Interaction Types | Drug Claim Name | Drug Name | PMIDs |
| 27330 | RPS6KA6 | DRUGGABLE GENOME, SERINE THREONINE KINASE, KINASE, ENZYME | inhibitor | 249565632 | AT-9283 | |
| 27330 | RPS6KA6 | DRUGGABLE GENOME, SERINE THREONINE KINASE, KINASE, ENZYME | inhibitor | 249565718 | CHEMBL573107 | |
| 27330 | RPS6KA6 | DRUGGABLE GENOME, SERINE THREONINE KINASE, KINASE, ENZYME | US10081632, Compound 25 | |||
| 27330 | RPS6KA6 | DRUGGABLE GENOME, SERINE THREONINE KINASE, KINASE, ENZYME | CEP-1347 | CEP-1347 | 24044867 | |
| 27330 | RPS6KA6 | DRUGGABLE GENOME, SERINE THREONINE KINASE, KINASE, ENZYME | inhibitor | 404859044 | ||
| 27330 | RPS6KA6 | DRUGGABLE GENOME, SERINE THREONINE KINASE, KINASE, ENZYME | BI-D1870 | CHEMBL573107 | ||
| 27330 | RPS6KA6 | DRUGGABLE GENOME, SERINE THREONINE KINASE, KINASE, ENZYME | inhibitor | 249565819 | ||
| 27330 | RPS6KA6 | DRUGGABLE GENOME, SERINE THREONINE KINASE, KINASE, ENZYME | CID 138805970 |
| Page: 1 |

Copyright 2023-Present -The University of Texas Health Science Center at Houston |