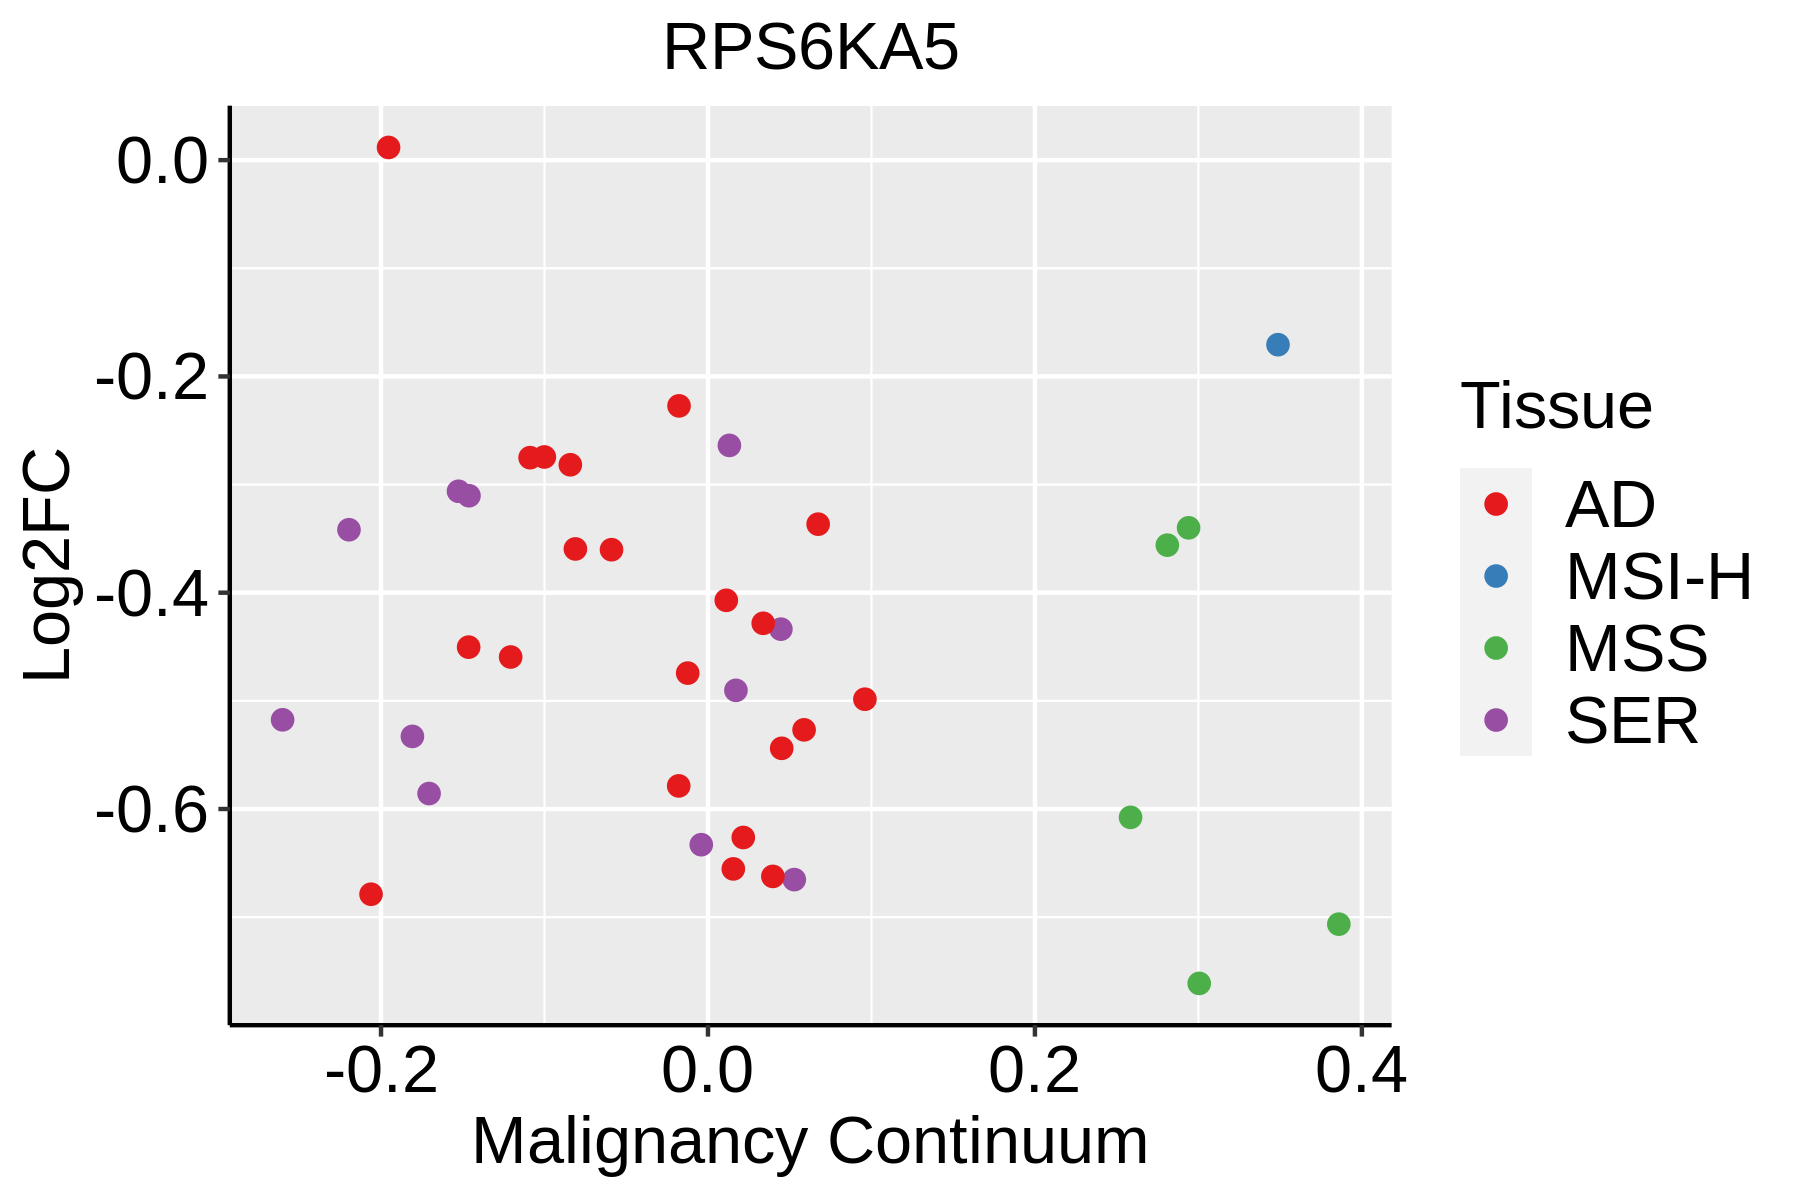
| Tissue | Expression Dynamics | Abbreviation |
| Colorectum (GSE201348) |  | FAP: Familial adenomatous polyposis |
| CRC: Colorectal cancer |
| Colorectum (HTA11) |  | AD: Adenomas |
| SER: Sessile serrated lesions |
| MSI-H: Microsatellite-high colorectal cancer |
| MSS: Microsatellite stable colorectal cancer |
| Endometrium |  | AEH: Atypical endometrial hyperplasia |
| EEC: Endometrioid Cancer |
| Esophagus |  | ESCC: Esophageal squamous cell carcinoma |
| HGIN: High-grade intraepithelial neoplasias |
| LGIN: Low-grade intraepithelial neoplasias |
| Lung |  | AAH: Atypical adenomatous hyperplasia |
| AIS: Adenocarcinoma in situ |
| IAC: Invasive lung adenocarcinoma |
| MIA: Minimally invasive adenocarcinoma |
| GO ID | Tissue | Disease Stage | Description | Gene Ratio | Bg Ratio | pvalue | p.adjust | Count |
| GO:0038127 | Colorectum | AD | ERBB signaling pathway | 55/3918 | 121/18723 | 1.19e-09 | 8.85e-08 | 55 |
| GO:0007173 | Colorectum | AD | epidermal growth factor receptor signaling pathway | 50/3918 | 108/18723 | 3.08e-09 | 2.07e-07 | 50 |
| GO:0007409 | Colorectum | AD | axonogenesis | 122/3918 | 418/18723 | 3.36e-05 | 6.15e-04 | 122 |
| GO:0061564 | Colorectum | AD | axon development | 132/3918 | 467/18723 | 8.40e-05 | 1.31e-03 | 132 |
| GO:0018105 | Colorectum | AD | peptidyl-serine phosphorylation | 88/3918 | 315/18723 | 1.73e-03 | 1.43e-02 | 88 |
| GO:0018209 | Colorectum | AD | peptidyl-serine modification | 92/3918 | 338/18723 | 3.19e-03 | 2.36e-02 | 92 |
| GO:0051091 | Colorectum | AD | positive regulation of DNA-binding transcription factor activity | 73/3918 | 260/18723 | 3.52e-03 | 2.54e-02 | 73 |
| GO:0007411 | Colorectum | AD | axon guidance | 64/3918 | 227/18723 | 5.41e-03 | 3.55e-02 | 64 |
| GO:0097485 | Colorectum | AD | neuron projection guidance | 64/3918 | 228/18723 | 6.02e-03 | 3.78e-02 | 64 |
| GO:0031056 | Colorectum | AD | regulation of histone modification | 45/3918 | 152/18723 | 7.05e-03 | 4.31e-02 | 45 |
| GO:00381271 | Colorectum | SER | ERBB signaling pathway | 35/2897 | 121/18723 | 1.21e-04 | 2.49e-03 | 35 |
| GO:00071731 | Colorectum | SER | epidermal growth factor receptor signaling pathway | 32/2897 | 108/18723 | 1.42e-04 | 2.82e-03 | 32 |
| GO:00310561 | Colorectum | SER | regulation of histone modification | 37/2897 | 152/18723 | 2.80e-03 | 2.50e-02 | 37 |
| GO:00074111 | Colorectum | SER | axon guidance | 51/2897 | 227/18723 | 3.29e-03 | 2.82e-02 | 51 |
| GO:00974851 | Colorectum | SER | neuron projection guidance | 51/2897 | 228/18723 | 3.61e-03 | 3.03e-02 | 51 |
| GO:00615641 | Colorectum | SER | axon development | 94/2897 | 467/18723 | 3.78e-03 | 3.13e-02 | 94 |
| GO:00181051 | Colorectum | SER | peptidyl-serine phosphorylation | 66/2897 | 315/18723 | 5.47e-03 | 4.06e-02 | 66 |
| GO:00510911 | Colorectum | SER | positive regulation of DNA-binding transcription factor activity | 56/2897 | 260/18723 | 5.55e-03 | 4.09e-02 | 56 |
| GO:00074091 | Colorectum | SER | axonogenesis | 84/2897 | 418/18723 | 6.20e-03 | 4.49e-02 | 84 |
| GO:00071732 | Colorectum | MSS | epidermal growth factor receptor signaling pathway | 43/3467 | 108/18723 | 1.92e-07 | 8.31e-06 | 43 |
| Pathway ID | Tissue | Disease Stage | Description | Gene Ratio | Bg Ratio | pvalue | p.adjust | qvalue | Count |
| hsa05131 | Colorectum | AD | Shigellosis | 109/2092 | 247/8465 | 1.09e-11 | 2.44e-10 | 1.55e-10 | 109 |
| hsa04722 | Colorectum | AD | Neurotrophin signaling pathway | 50/2092 | 119/8465 | 2.28e-05 | 2.24e-04 | 1.43e-04 | 50 |
| hsa051311 | Colorectum | AD | Shigellosis | 109/2092 | 247/8465 | 1.09e-11 | 2.44e-10 | 1.55e-10 | 109 |
| hsa047221 | Colorectum | AD | Neurotrophin signaling pathway | 50/2092 | 119/8465 | 2.28e-05 | 2.24e-04 | 1.43e-04 | 50 |
| hsa051312 | Colorectum | SER | Shigellosis | 87/1580 | 247/8465 | 3.07e-10 | 7.27e-09 | 5.28e-09 | 87 |
| hsa047222 | Colorectum | SER | Neurotrophin signaling pathway | 35/1580 | 119/8465 | 2.80e-03 | 2.02e-02 | 1.47e-02 | 35 |
| hsa051313 | Colorectum | SER | Shigellosis | 87/1580 | 247/8465 | 3.07e-10 | 7.27e-09 | 5.28e-09 | 87 |
| hsa047223 | Colorectum | SER | Neurotrophin signaling pathway | 35/1580 | 119/8465 | 2.80e-03 | 2.02e-02 | 1.47e-02 | 35 |
| hsa051314 | Colorectum | MSS | Shigellosis | 94/1875 | 247/8465 | 6.82e-09 | 1.34e-07 | 8.23e-08 | 94 |
| hsa047224 | Colorectum | MSS | Neurotrophin signaling pathway | 45/1875 | 119/8465 | 7.04e-05 | 6.55e-04 | 4.02e-04 | 45 |
| hsa04713 | Colorectum | MSS | Circadian entrainment | 32/1875 | 97/8465 | 8.84e-03 | 3.25e-02 | 1.99e-02 | 32 |
| hsa051315 | Colorectum | MSS | Shigellosis | 94/1875 | 247/8465 | 6.82e-09 | 1.34e-07 | 8.23e-08 | 94 |
| hsa047225 | Colorectum | MSS | Neurotrophin signaling pathway | 45/1875 | 119/8465 | 7.04e-05 | 6.55e-04 | 4.02e-04 | 45 |
| hsa047131 | Colorectum | MSS | Circadian entrainment | 32/1875 | 97/8465 | 8.84e-03 | 3.25e-02 | 1.99e-02 | 32 |
| hsa051318 | Colorectum | FAP | Shigellosis | 76/1404 | 247/8465 | 1.57e-08 | 5.84e-07 | 3.55e-07 | 76 |
| hsa047226 | Colorectum | FAP | Neurotrophin signaling pathway | 38/1404 | 119/8465 | 2.49e-05 | 2.78e-04 | 1.69e-04 | 38 |
| hsa04010 | Colorectum | FAP | MAPK signaling pathway | 68/1404 | 302/8465 | 4.00e-03 | 1.67e-02 | 1.02e-02 | 68 |
| hsa04261 | Colorectum | FAP | Adrenergic signaling in cardiomyocytes | 38/1404 | 154/8465 | 6.16e-03 | 2.34e-02 | 1.42e-02 | 38 |
| hsa051319 | Colorectum | FAP | Shigellosis | 76/1404 | 247/8465 | 1.57e-08 | 5.84e-07 | 3.55e-07 | 76 |
| hsa047227 | Colorectum | FAP | Neurotrophin signaling pathway | 38/1404 | 119/8465 | 2.49e-05 | 2.78e-04 | 1.69e-04 | 38 |
| Hugo Symbol | Variant Class | Variant Classification | dbSNP RS | HGVSc | HGVSp | HGVSp Short | SWISSPROT | BIOTYPE | SIFT | PolyPhen | Tumor Sample Barcode | Tissue | Histology | Sex | Age | Stage | Therapy Types | Drugs | Outcome |
| RPS6KA5 | SNV | Missense_Mutation | novel | c.1642N>A | p.Glu548Lys | p.E548K | O75582 | protein_coding | deleterious(0.01) | probably_damaging(0.998) | TCGA-3C-AALI-01 | Breast | breast invasive carcinoma | Female | <65 | I/II | Unspecific | Poly E | Complete Response |
| RPS6KA5 | SNV | Missense_Mutation | novel | c.885N>A | p.Met295Ile | p.M295I | O75582 | protein_coding | tolerated(0.39) | benign(0) | TCGA-AC-A23H-01 | Breast | breast invasive carcinoma | Female | >=65 | I/II | Unknown | Unknown | PD |
| RPS6KA5 | SNV | Missense_Mutation | rs369503281 | c.1322N>A | p.Arg441Gln | p.R441Q | O75582 | protein_coding | deleterious(0.01) | probably_damaging(0.942) | TCGA-AN-A046-01 | Breast | breast invasive carcinoma | Female | >=65 | I/II | Unknown | Unknown | SD |
| RPS6KA5 | SNV | Missense_Mutation | | c.1575G>T | p.Met525Ile | p.M525I | O75582 | protein_coding | tolerated(0.17) | possibly_damaging(0.519) | TCGA-AR-A250-01 | Breast | breast invasive carcinoma | Female | <65 | I/II | Chemotherapy | doxorubicin | SD |
| RPS6KA5 | SNV | Missense_Mutation | novel | c.560N>T | p.Ser187Phe | p.S187F | O75582 | protein_coding | deleterious(0.01) | probably_damaging(0.95) | TCGA-BH-A0H5-01 | Breast | breast invasive carcinoma | Female | <65 | I/II | Chemotherapy | cytoxan | CR |
| RPS6KA5 | SNV | Missense_Mutation | | c.888A>C | p.Lys296Asn | p.K296N | O75582 | protein_coding | deleterious(0) | probably_damaging(1) | TCGA-BH-A18G-01 | Breast | breast invasive carcinoma | Female | >=65 | I/II | Unknown | Unknown | SD |
| RPS6KA5 | SNV | Missense_Mutation | | c.1718C>T | p.Pro573Leu | p.P573L | O75582 | protein_coding | deleterious(0.02) | possibly_damaging(0.761) | TCGA-BH-A1FM-01 | Breast | breast invasive carcinoma | Female | <65 | III/IV | Unknown | Unknown | SD |
| RPS6KA5 | SNV | Missense_Mutation | | c.1898G>A | p.Ser633Asn | p.S633N | O75582 | protein_coding | tolerated(0.21) | benign(0.031) | TCGA-C8-A12U-01 | Breast | breast invasive carcinoma | Female | <65 | I/II | Unknown | Unknown | SD |
| RPS6KA5 | SNV | Missense_Mutation | | c.2303N>G | p.Ser768Cys | p.S768C | O75582 | protein_coding | deleterious(0.01) | probably_damaging(0.981) | TCGA-E9-A1NC-01 | Breast | breast invasive carcinoma | Female | <65 | I/II | Chemotherapy | doxorubicin | CR |
| RPS6KA5 | insertion | In_Frame_Ins | novel | c.1103_1104insAAGACCAGC | p.Ser368_Glu369insArgProAla | p.S368_E369insRPA | O75582 | protein_coding | | | TCGA-A2-A0CM-01 | Breast | breast invasive carcinoma | Female | <65 | I/II | Chemotherapy | adriamycin | PD |
| Entrez ID | Symbol | Category | Interaction Types | Drug Claim Name | Drug Name | PMIDs |
| 9252 | RPS6KA5 | DRUGGABLE GENOME, ENZYME, KINASE, TRANSCRIPTION FACTOR, SERINE THREONINE KINASE | | PHA-767491 | CHEMBL225519 | |
| 9252 | RPS6KA5 | DRUGGABLE GENOME, ENZYME, KINASE, TRANSCRIPTION FACTOR, SERINE THREONINE KINASE | inhibitor | 249565811 | | |
| 9252 | RPS6KA5 | DRUGGABLE GENOME, ENZYME, KINASE, TRANSCRIPTION FACTOR, SERINE THREONINE KINASE | | GSK-269962A | GSK-269962A | |
| 9252 | RPS6KA5 | DRUGGABLE GENOME, ENZYME, KINASE, TRANSCRIPTION FACTOR, SERINE THREONINE KINASE | | GW843682X | GW843682X | |
| 9252 | RPS6KA5 | DRUGGABLE GENOME, ENZYME, KINASE, TRANSCRIPTION FACTOR, SERINE THREONINE KINASE | | US9365572, 5 | | |
| 9252 | RPS6KA5 | DRUGGABLE GENOME, ENZYME, KINASE, TRANSCRIPTION FACTOR, SERINE THREONINE KINASE | inhibitor | HESPERADIN | HESPERADIN | 19035792 |
| 9252 | RPS6KA5 | DRUGGABLE GENOME, ENZYME, KINASE, TRANSCRIPTION FACTOR, SERINE THREONINE KINASE | inhibitor | 249565810 | CHEMBL188434 | |
| 9252 | RPS6KA5 | DRUGGABLE GENOME, ENZYME, KINASE, TRANSCRIPTION FACTOR, SERINE THREONINE KINASE | | ILORASERTIB | ILORASERTIB | |
| 9252 | RPS6KA5 | DRUGGABLE GENOME, ENZYME, KINASE, TRANSCRIPTION FACTOR, SERINE THREONINE KINASE | | LINIFANIB | LINIFANIB | |
| 9252 | RPS6KA5 | DRUGGABLE GENOME, ENZYME, KINASE, TRANSCRIPTION FACTOR, SERINE THREONINE KINASE | | DOVITINIB | DOVITINIB | |


 Identification of the aberrant gene expression in precancerous and cancerous lesions by comparing the gene expression of stem-like cells in diseased tissues with normal stem cells
 Find out the enriched GO biological processes and KEGG pathways involved in transition from healthy to precancer to cancer


 Identification of potential cell-cell interactions between two cell types and their ligand-receptor pairs for different disease states
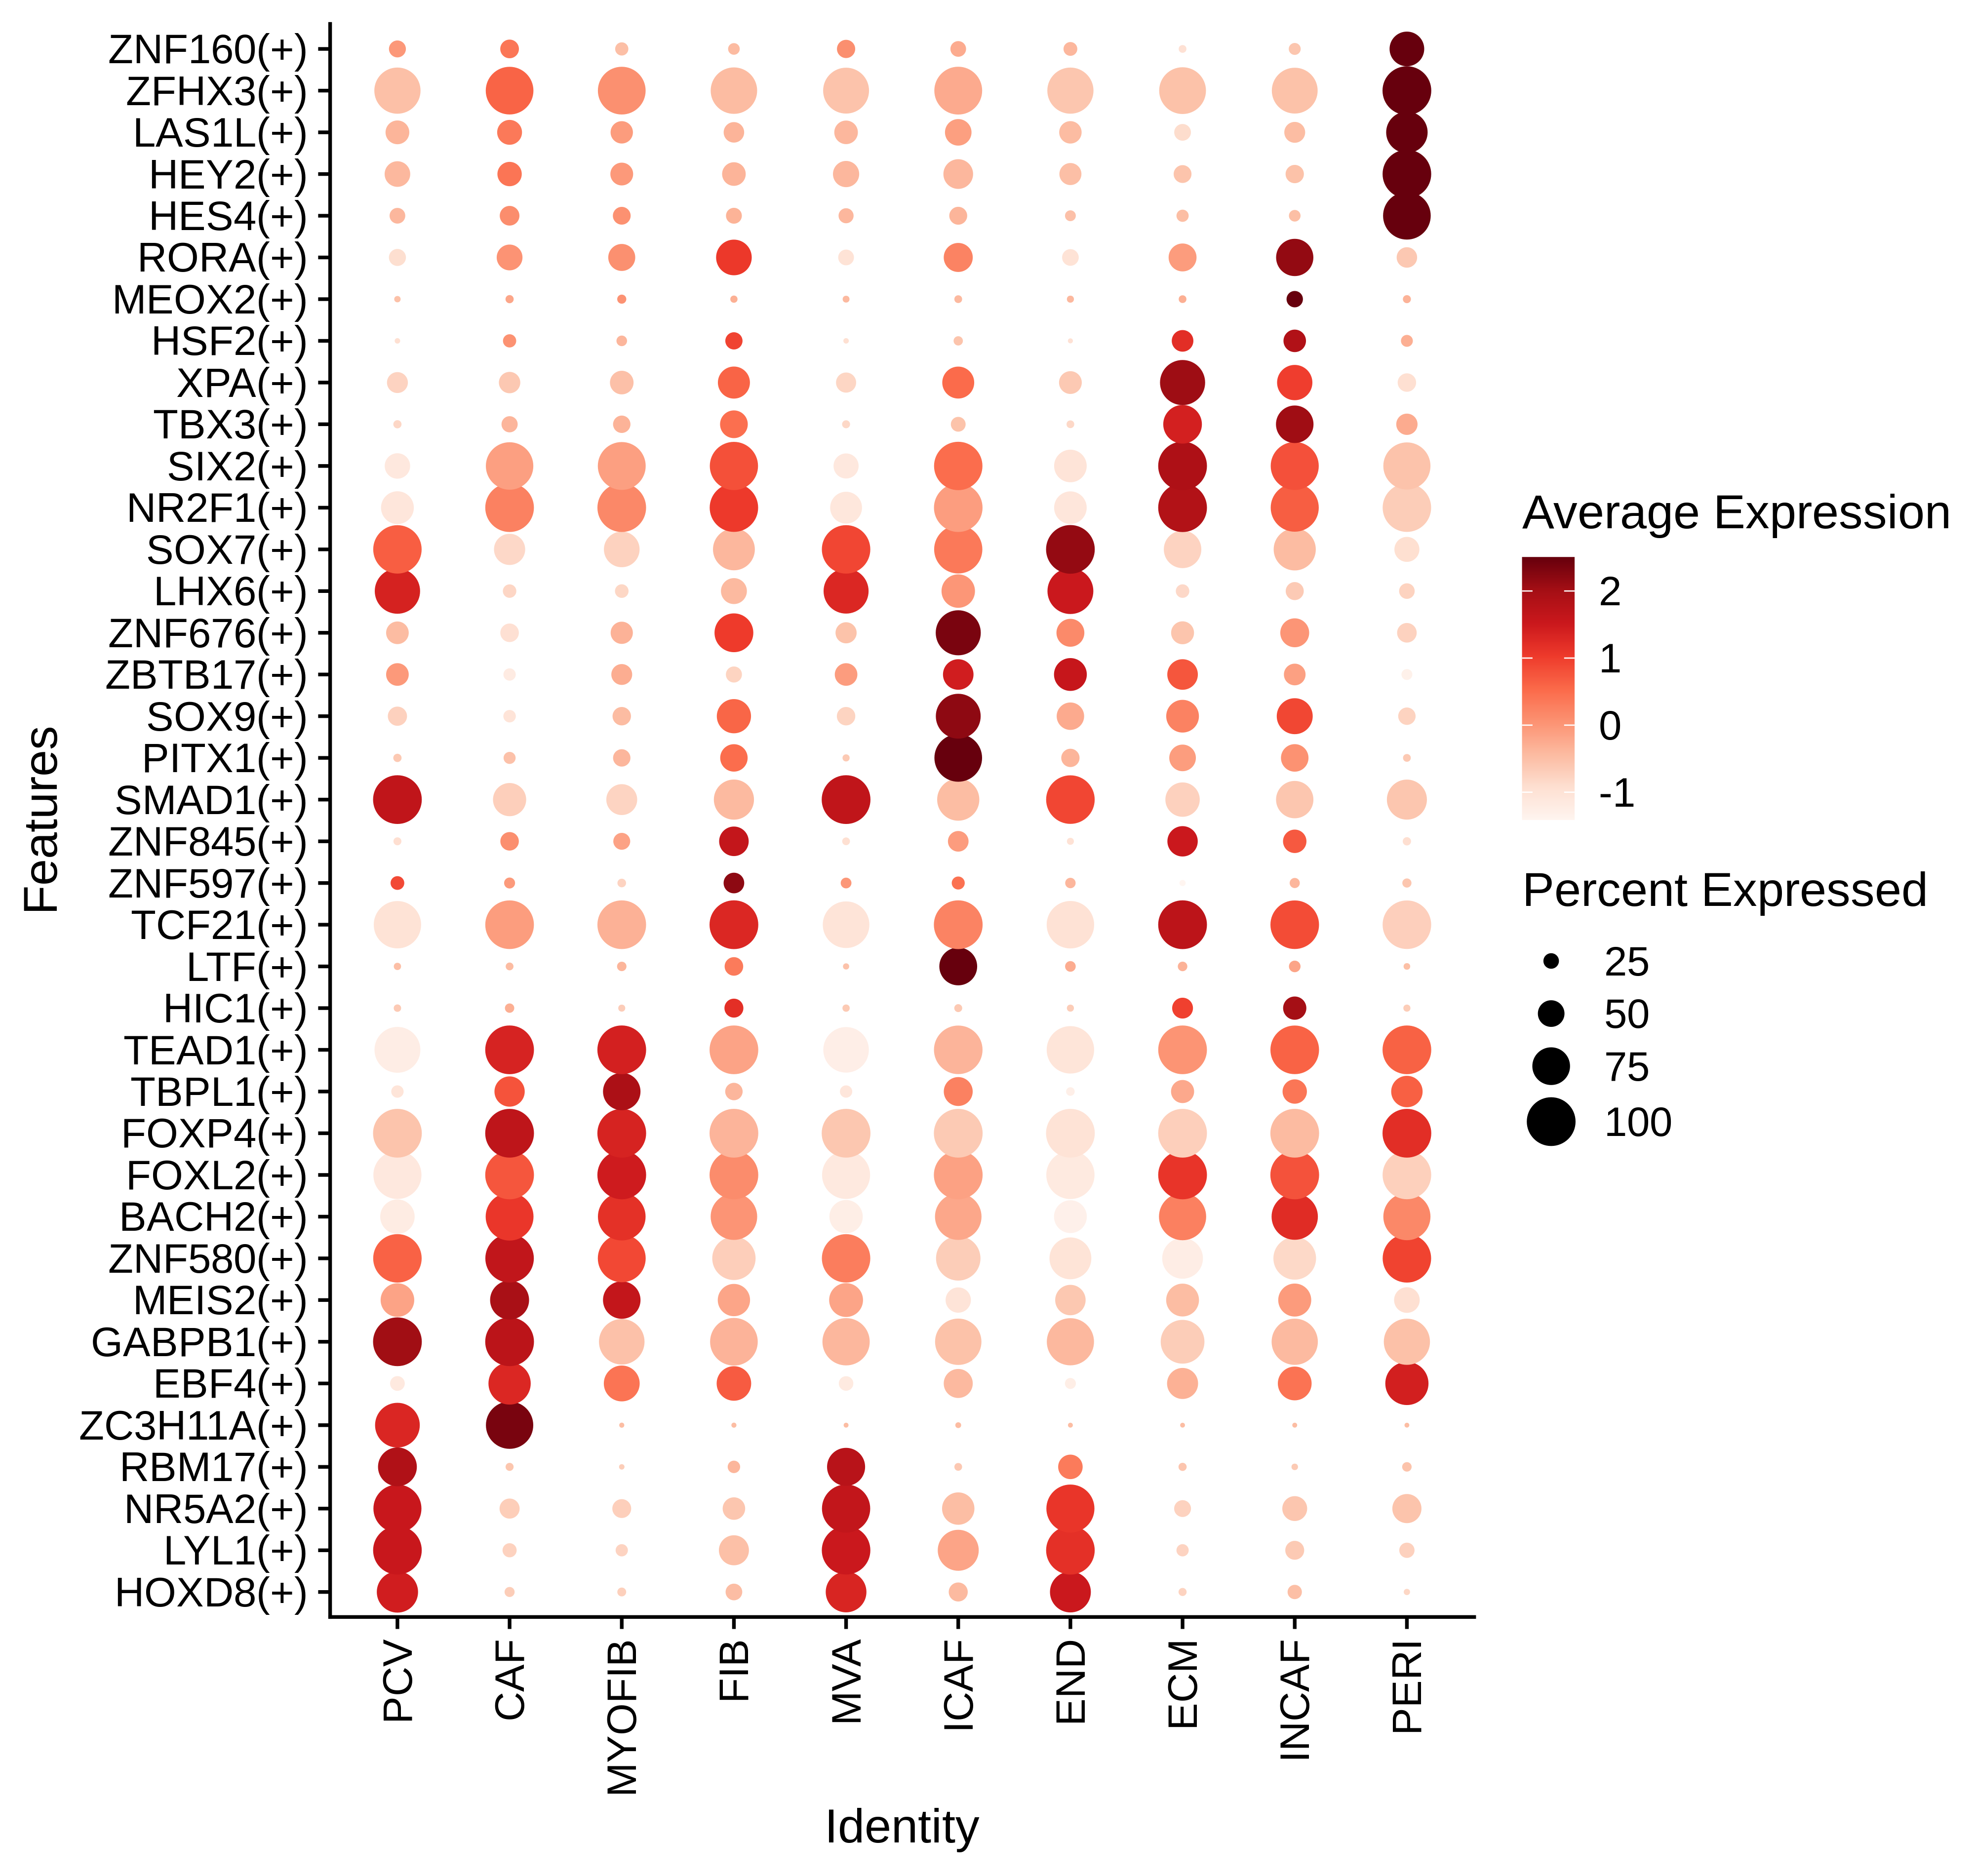
 Find out the significant the regulons (TFs) and the target genes of each regulon across cell types for different disease states
 Annotation of somatic variants for genes involved in malignant transformation
 Identification of chemicals and drugs interact with genes involved in malignant transfromation


