
|
|||||
|
 | |
| |
| |
| |
| |
| |
|
Gene: RPS6KA2 |
Gene summary for RPS6KA2 |
| Gene information | Species | Human | Gene symbol | RPS6KA2 | Gene ID | 6196 |
| Gene name | ribosomal protein S6 kinase A2 | |
| Gene Alias | HU-2 | |
| Cytomap | 6q27 | |
| Gene Type | protein-coding | GO ID | GO:0000003 | UniProtAcc | Q15349 |
Top |
Malignant transformation analysis |
| Identification of the aberrant gene expression in precancerous and cancerous lesions by comparing the gene expression of stem-like cells in diseased tissues with normal stem cells |
| Entrez ID | Symbol | Replicates | Species | Organ | Tissue | Adj P-value | Log2FC | Malignancy |
| 6196 | RPS6KA2 | AEH-subject1 | Human | Endometrium | AEH | 4.89e-08 | 3.73e-01 | -0.3059 |
| 6196 | RPS6KA2 | AEH-subject2 | Human | Endometrium | AEH | 1.43e-14 | 4.59e-01 | -0.2525 |
| 6196 | RPS6KA2 | AEH-subject3 | Human | Endometrium | AEH | 1.17e-05 | 2.97e-01 | -0.2576 |
| 6196 | RPS6KA2 | AEH-subject4 | Human | Endometrium | AEH | 3.17e-07 | 3.56e-01 | -0.2657 |
| 6196 | RPS6KA2 | AEH-subject5 | Human | Endometrium | AEH | 8.46e-24 | 6.26e-01 | -0.2953 |
| 6196 | RPS6KA2 | EEC-subject1 | Human | Endometrium | EEC | 1.21e-04 | 2.78e-01 | -0.2682 |
| 6196 | RPS6KA2 | EEC-subject2 | Human | Endometrium | EEC | 4.30e-15 | 4.37e-01 | -0.2607 |
| 6196 | RPS6KA2 | EEC-subject4 | Human | Endometrium | EEC | 2.45e-07 | 3.23e-01 | -0.2571 |
| 6196 | RPS6KA2 | EEC-subject5 | Human | Endometrium | EEC | 5.74e-07 | 3.53e-01 | -0.249 |
| 6196 | RPS6KA2 | GSM6177622_NYU_UCEC3_lib1_lib1 | Human | Endometrium | EEC | 3.35e-04 | 3.27e-02 | -0.1917 |
| 6196 | RPS6KA2 | P2T-E | Human | Esophagus | ESCC | 2.31e-08 | 1.13e-01 | 0.1177 |
| 6196 | RPS6KA2 | P8T-E | Human | Esophagus | ESCC | 3.41e-04 | 2.46e-02 | 0.0889 |
| 6196 | RPS6KA2 | P10T-E | Human | Esophagus | ESCC | 7.72e-14 | 2.71e-01 | 0.116 |
| 6196 | RPS6KA2 | P12T-E | Human | Esophagus | ESCC | 2.63e-04 | 1.40e-01 | 0.1122 |
| 6196 | RPS6KA2 | P15T-E | Human | Esophagus | ESCC | 5.08e-04 | 1.88e-01 | 0.1149 |
| 6196 | RPS6KA2 | P16T-E | Human | Esophagus | ESCC | 1.34e-12 | 1.76e-01 | 0.1153 |
| 6196 | RPS6KA2 | P21T-E | Human | Esophagus | ESCC | 1.72e-13 | 2.81e-01 | 0.1617 |
| 6196 | RPS6KA2 | P22T-E | Human | Esophagus | ESCC | 8.68e-09 | 1.24e-01 | 0.1236 |
| 6196 | RPS6KA2 | P23T-E | Human | Esophagus | ESCC | 3.54e-03 | 1.60e-01 | 0.108 |
| 6196 | RPS6KA2 | P26T-E | Human | Esophagus | ESCC | 4.47e-09 | 1.29e-01 | 0.1276 |
| Page: 1 2 3 4 |
| Tissue | Expression Dynamics | Abbreviation |
| Endometrium |  | AEH: Atypical endometrial hyperplasia |
| EEC: Endometrioid Cancer | ||
| Esophagus | 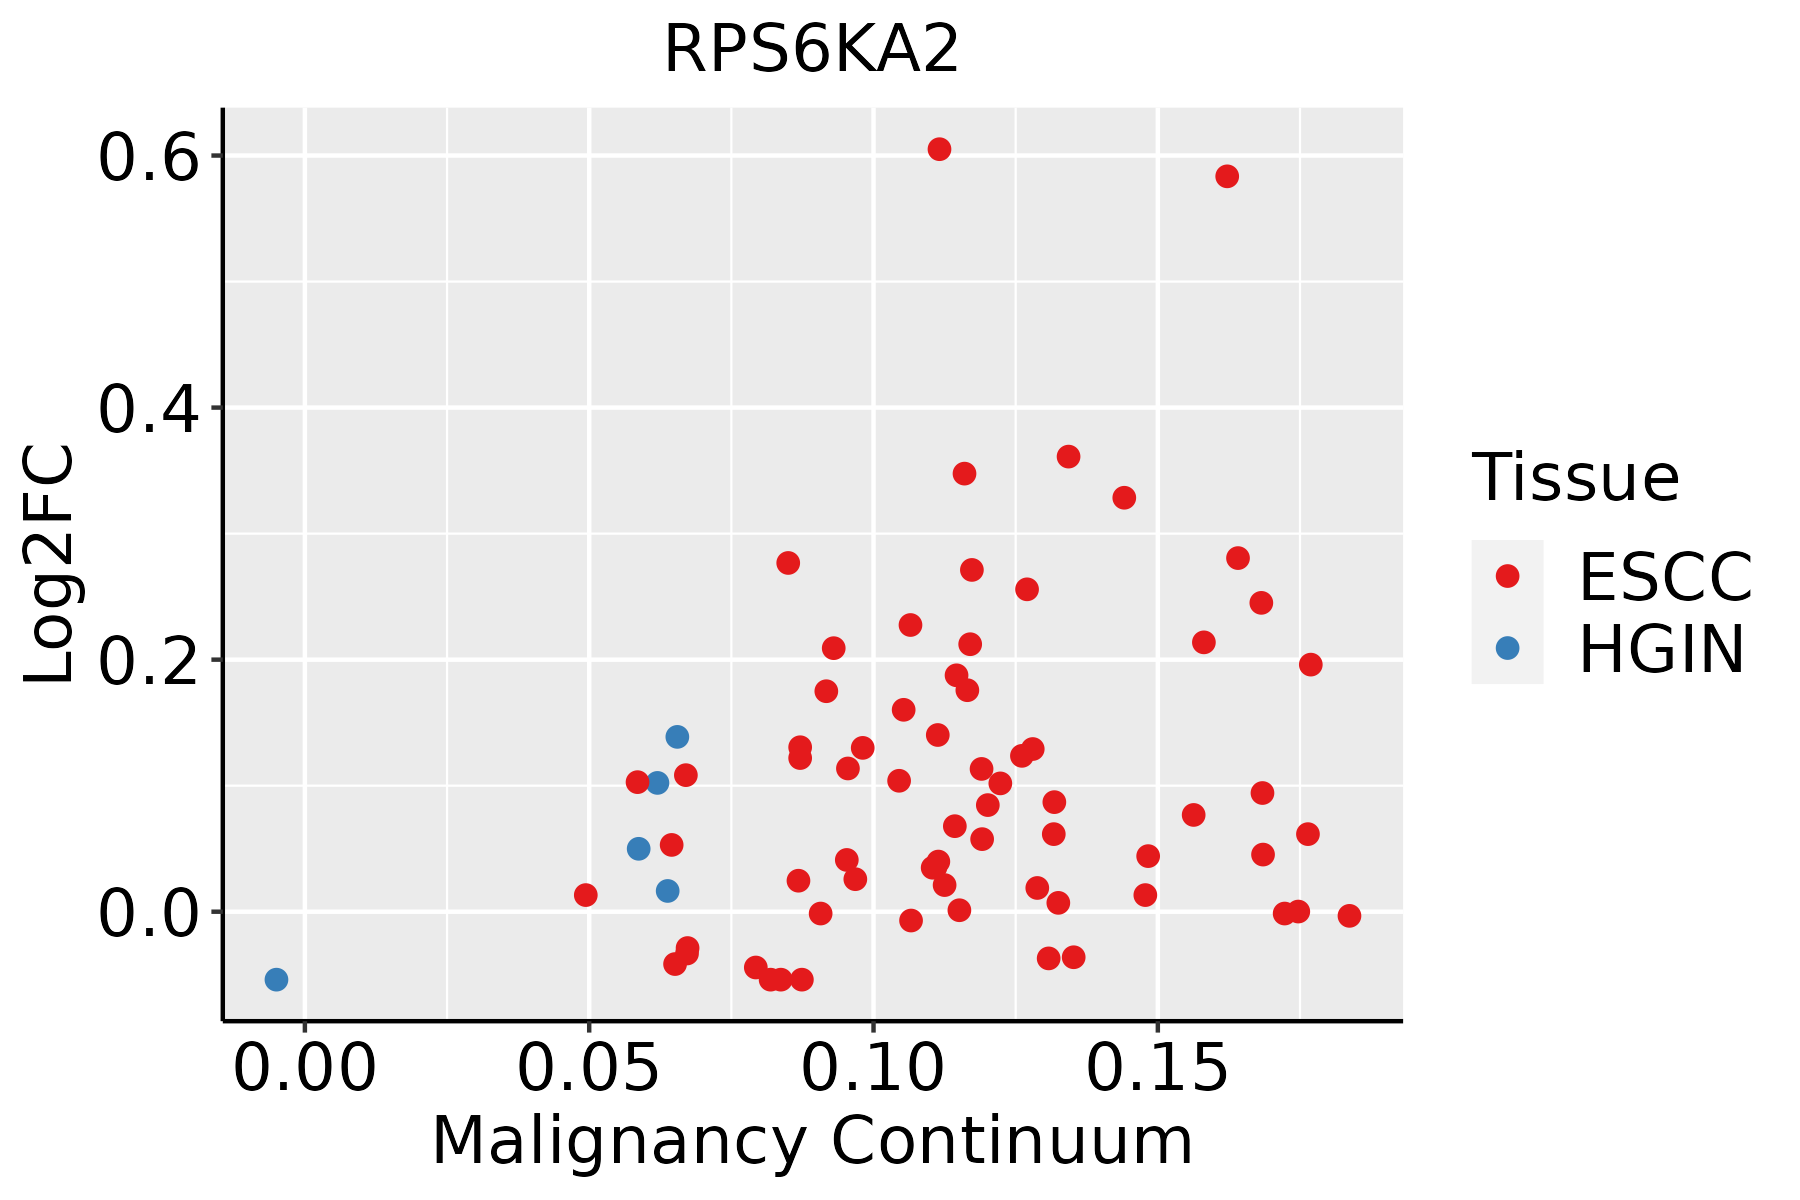 | ESCC: Esophageal squamous cell carcinoma |
| HGIN: High-grade intraepithelial neoplasias | ||
| LGIN: Low-grade intraepithelial neoplasias | ||
| Lung | 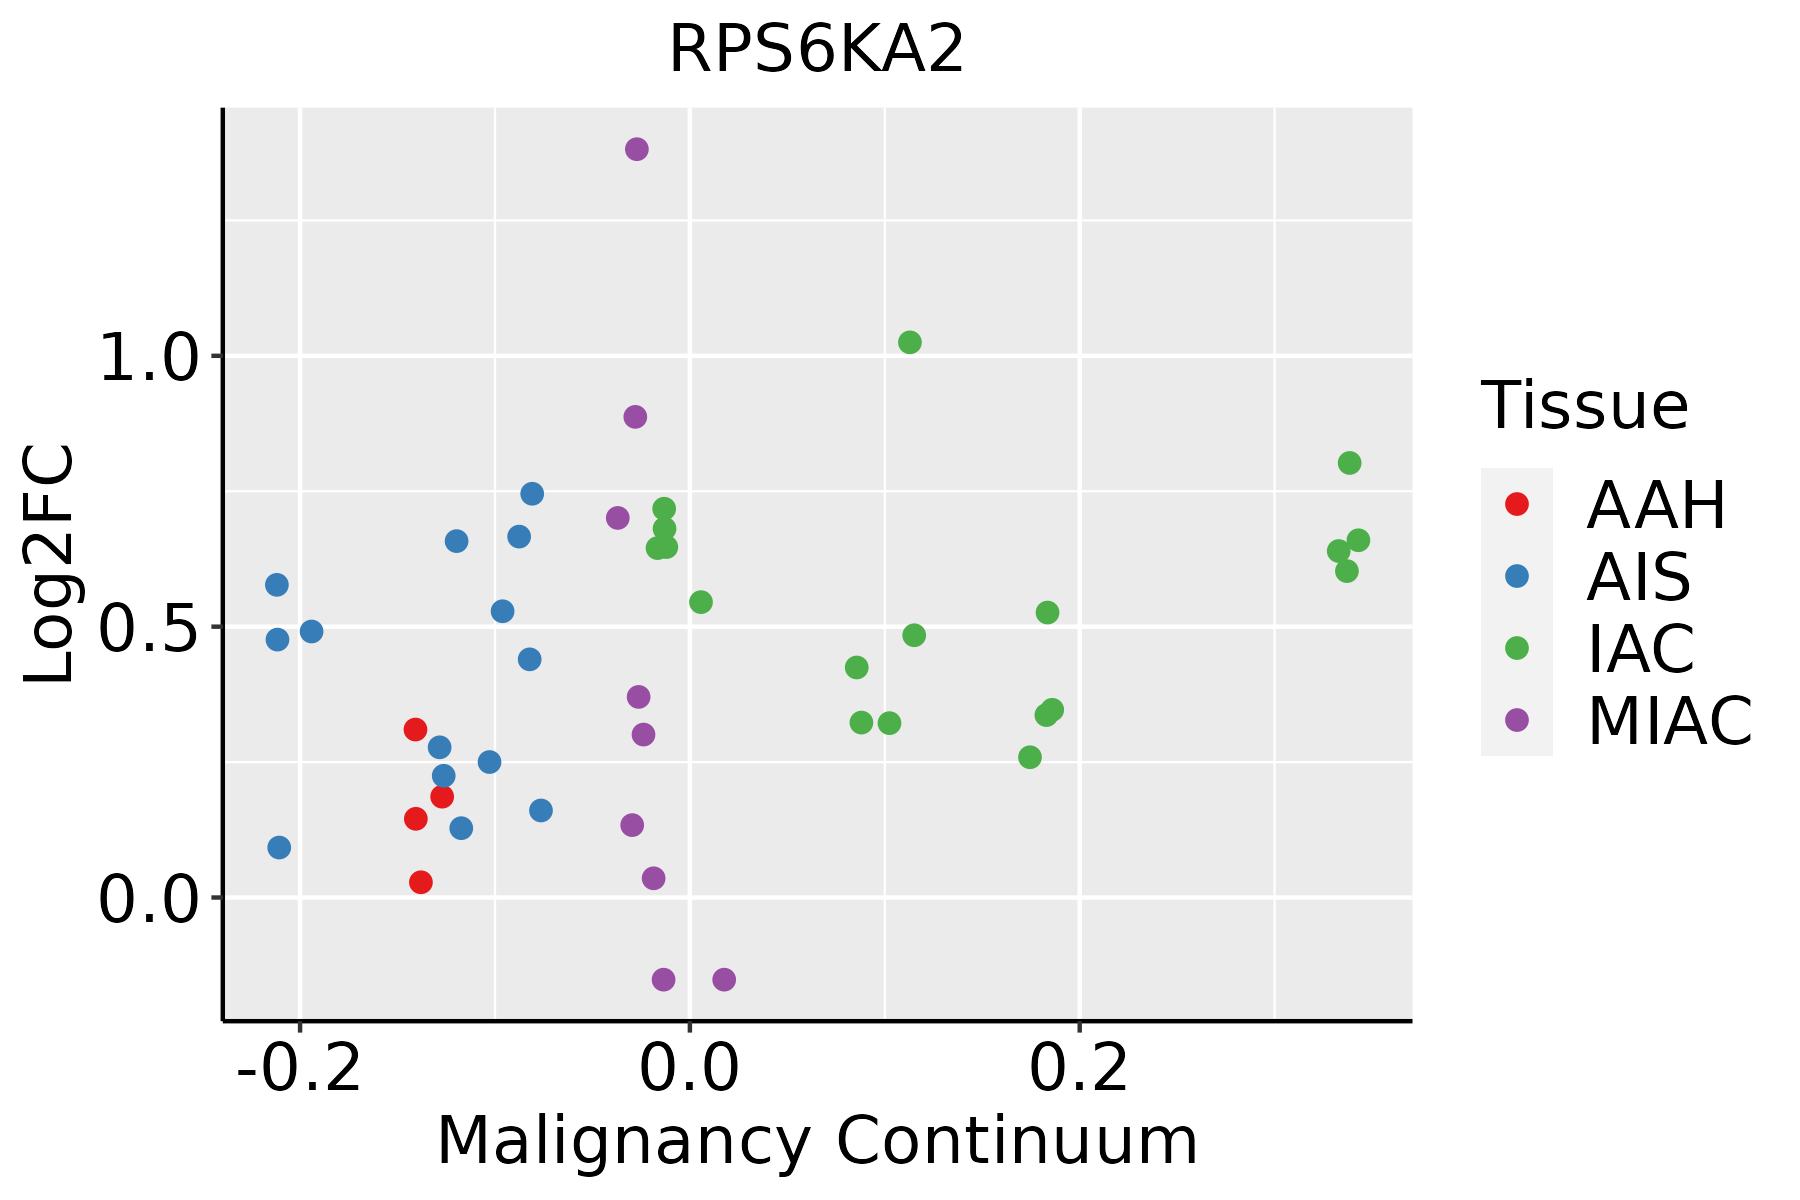 | AAH: Atypical adenomatous hyperplasia |
| AIS: Adenocarcinoma in situ | ||
| IAC: Invasive lung adenocarcinoma | ||
| MIA: Minimally invasive adenocarcinoma | ||
| Thyroid | 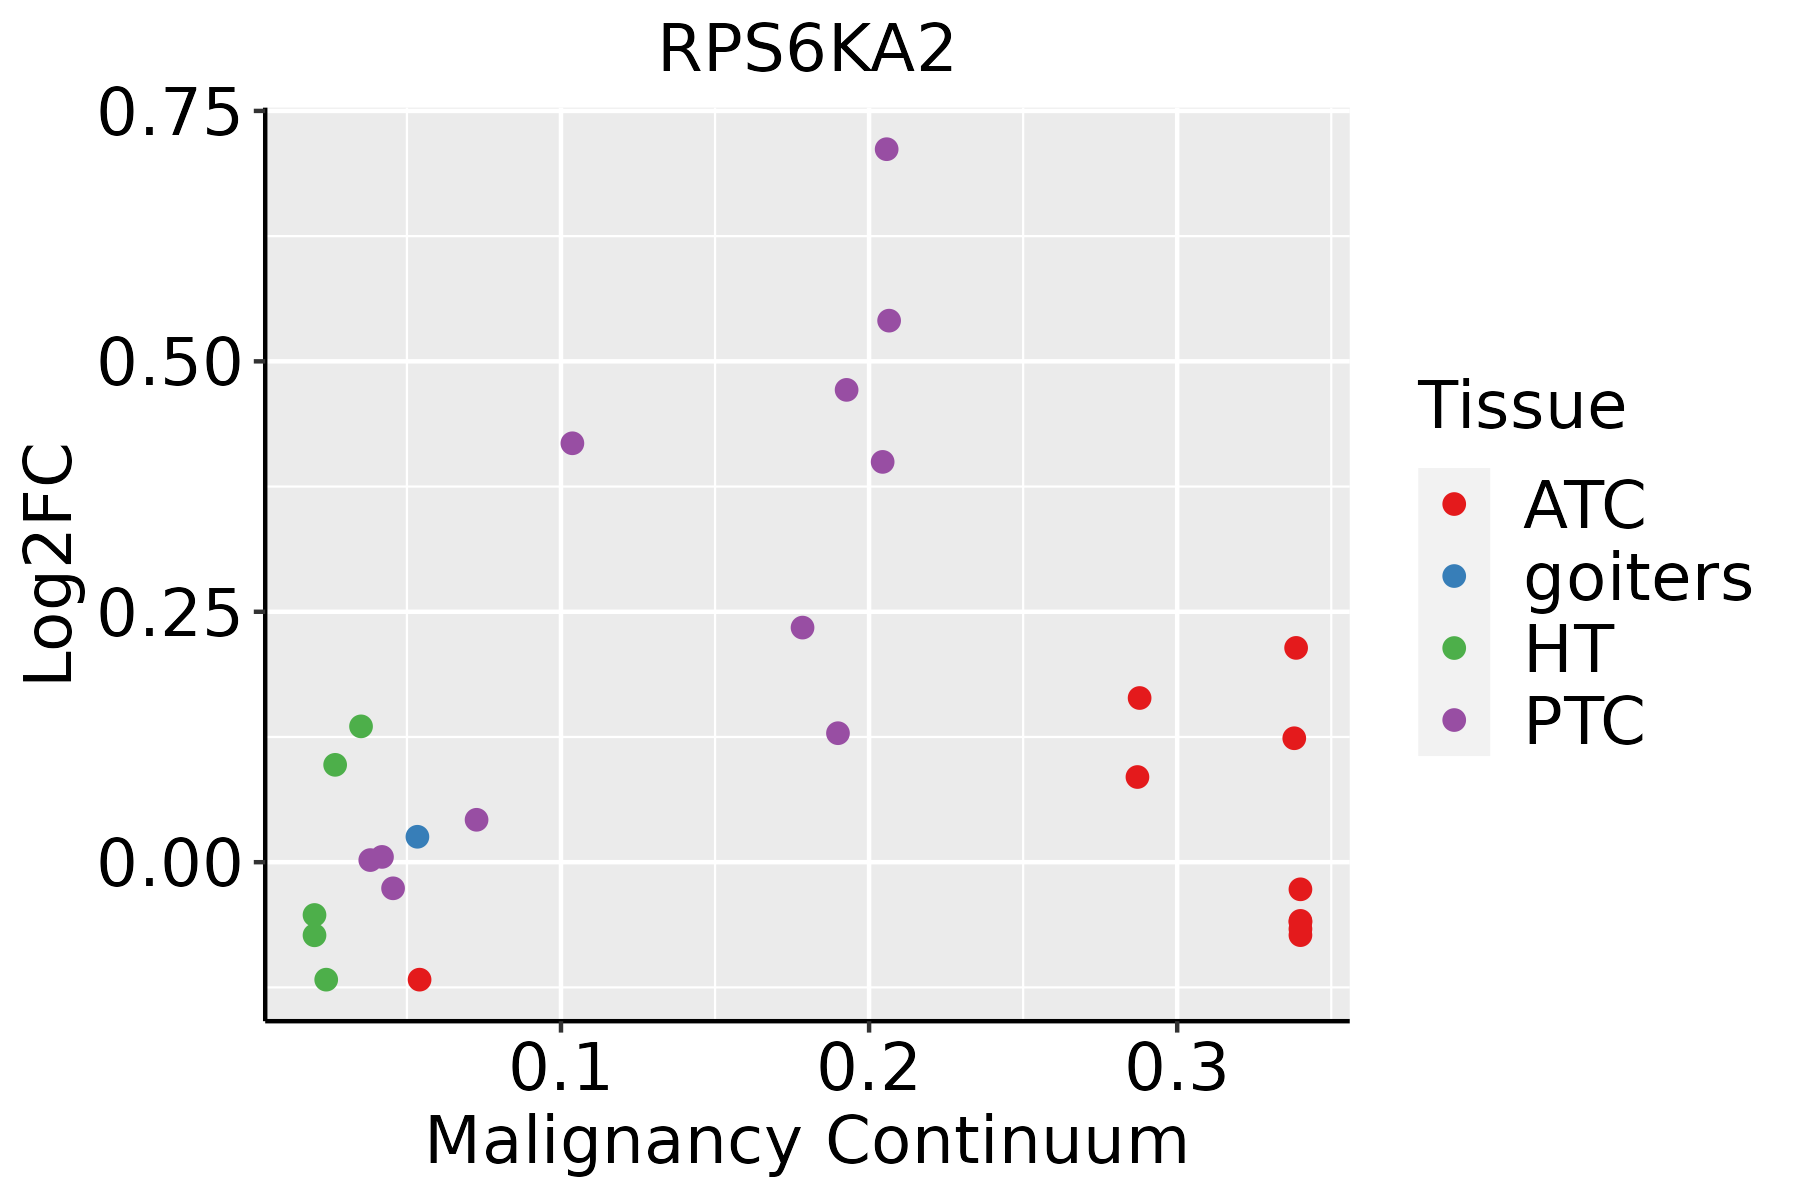 | ATC: Anaplastic thyroid cancer |
| HT: Hashimoto's thyroiditis | ||
| PTC: Papillary thyroid cancer |
| ∗log2FC in expression of this searched gene in stem-like cells from each diseased tissue sample relative to stem-like cells in normal samples in each tissue plotted against the malignancy continuum. Samples are colored based on if they are from different disease stage. |
Top |
Malignant transformation related pathway analysis |
| Find out the enriched GO biological processes and KEGG pathways involved in transition from healthy to precancer to cancer |
| Tissue | Disease Stage | Enriched GO biological Processes |
| Colorectum | AD |  |
| Colorectum | SER |  |
| Colorectum | MSS |  |
| Colorectum | MSI-H |  |
| Colorectum | FAP |  |
| ∗Top 15 enriched GO BP terms are showed in the bar plot of each disease state in each tissue. Each row represents a significant GO biological process which is colored according to the -log10(p.adjust). |
| Page: 1 2 3 4 5 6 7 8 9 |
| GO ID | Tissue | Disease Stage | Description | Gene Ratio | Bg Ratio | pvalue | p.adjust | Count |
| GO:000974316 | Endometrium | AEH | response to carbohydrate | 62/2100 | 253/18723 | 1.76e-09 | 1.51e-07 | 62 |
| GO:007132210 | Endometrium | AEH | cellular response to carbohydrate stimulus | 41/2100 | 163/18723 | 4.55e-07 | 1.87e-05 | 41 |
| GO:001063910 | Endometrium | AEH | negative regulation of organelle organization | 61/2100 | 348/18723 | 2.65e-04 | 3.09e-03 | 61 |
| GO:00181058 | Endometrium | AEH | peptidyl-serine phosphorylation | 50/2100 | 315/18723 | 7.20e-03 | 4.13e-02 | 50 |
| GO:000974317 | Endometrium | EEC | response to carbohydrate | 64/2168 | 253/18723 | 8.81e-10 | 7.89e-08 | 64 |
| GO:007132214 | Endometrium | EEC | cellular response to carbohydrate stimulus | 43/2168 | 163/18723 | 1.39e-07 | 6.56e-06 | 43 |
| GO:001063915 | Endometrium | EEC | negative regulation of organelle organization | 64/2168 | 348/18723 | 1.15e-04 | 1.55e-03 | 64 |
| GO:00482853 | Esophagus | ESCC | organelle fission | 301/8552 | 488/18723 | 4.64e-13 | 2.12e-11 | 301 |
| GO:00002802 | Esophagus | ESCC | nuclear division | 270/8552 | 439/18723 | 1.17e-11 | 4.24e-10 | 270 |
| GO:005160418 | Esophagus | ESCC | protein maturation | 189/8552 | 294/18723 | 7.64e-11 | 2.39e-09 | 189 |
| GO:00457865 | Esophagus | ESCC | negative regulation of cell cycle | 236/8552 | 385/18723 | 3.62e-10 | 9.93e-09 | 236 |
| GO:0010639110 | Esophagus | ESCC | negative regulation of organelle organization | 215/8552 | 348/18723 | 8.20e-10 | 2.01e-08 | 215 |
| GO:00109484 | Esophagus | ESCC | negative regulation of cell cycle process | 177/8552 | 294/18723 | 3.26e-07 | 4.59e-06 | 177 |
| GO:00182099 | Esophagus | ESCC | peptidyl-serine modification | 196/8552 | 338/18723 | 3.07e-06 | 3.47e-05 | 196 |
| GO:001810515 | Esophagus | ESCC | peptidyl-serine phosphorylation | 184/8552 | 315/18723 | 3.22e-06 | 3.61e-05 | 184 |
| GO:00517831 | Esophagus | ESCC | regulation of nuclear division | 90/8552 | 139/18723 | 4.30e-06 | 4.60e-05 | 90 |
| GO:001648514 | Esophagus | ESCC | protein processing | 134/8552 | 225/18723 | 1.81e-05 | 1.60e-04 | 134 |
| GO:00517843 | Esophagus | ESCC | negative regulation of nuclear division | 41/8552 | 56/18723 | 2.64e-05 | 2.21e-04 | 41 |
| GO:0009743111 | Esophagus | ESCC | response to carbohydrate | 135/8552 | 253/18723 | 8.16e-03 | 2.89e-02 | 135 |
| GO:00181056 | Lung | IAC | peptidyl-serine phosphorylation | 69/2061 | 315/18723 | 1.48e-08 | 1.87e-06 | 69 |
| Page: 1 2 3 4 |
| Pathway ID | Tissue | Disease Stage | Description | Gene Ratio | Bg Ratio | pvalue | p.adjust | qvalue | Count |
| hsa0471426 | Endometrium | AEH | Thermogenesis | 85/1197 | 232/8465 | 3.44e-18 | 9.33e-17 | 6.83e-17 | 85 |
| hsa0472216 | Endometrium | AEH | Neurotrophin signaling pathway | 31/1197 | 119/8465 | 4.07e-04 | 3.07e-03 | 2.25e-03 | 31 |
| hsa04714111 | Endometrium | AEH | Thermogenesis | 85/1197 | 232/8465 | 3.44e-18 | 9.33e-17 | 6.83e-17 | 85 |
| hsa0472217 | Endometrium | AEH | Neurotrophin signaling pathway | 31/1197 | 119/8465 | 4.07e-04 | 3.07e-03 | 2.25e-03 | 31 |
| hsa0471427 | Endometrium | EEC | Thermogenesis | 85/1237 | 232/8465 | 2.79e-17 | 7.05e-16 | 5.26e-16 | 85 |
| hsa0472222 | Endometrium | EEC | Neurotrophin signaling pathway | 30/1237 | 119/8465 | 1.54e-03 | 9.55e-03 | 7.12e-03 | 30 |
| hsa0471436 | Endometrium | EEC | Thermogenesis | 85/1237 | 232/8465 | 2.79e-17 | 7.05e-16 | 5.26e-16 | 85 |
| hsa0472232 | Endometrium | EEC | Neurotrophin signaling pathway | 30/1237 | 119/8465 | 1.54e-03 | 9.55e-03 | 7.12e-03 | 30 |
| hsa04714211 | Esophagus | ESCC | Thermogenesis | 163/4205 | 232/8465 | 9.22e-11 | 1.14e-09 | 5.86e-10 | 163 |
| hsa0513526 | Esophagus | ESCC | Yersinia infection | 100/4205 | 137/8465 | 1.80e-08 | 1.59e-07 | 8.12e-08 | 100 |
| hsa041505 | Esophagus | ESCC | mTOR signaling pathway | 98/4205 | 156/8465 | 5.81e-04 | 1.95e-03 | 9.97e-04 | 98 |
| hsa049318 | Esophagus | ESCC | Insulin resistance | 69/4205 | 108/8465 | 1.92e-03 | 5.54e-03 | 2.84e-03 | 69 |
| hsa04714310 | Esophagus | ESCC | Thermogenesis | 163/4205 | 232/8465 | 9.22e-11 | 1.14e-09 | 5.86e-10 | 163 |
| hsa05135111 | Esophagus | ESCC | Yersinia infection | 100/4205 | 137/8465 | 1.80e-08 | 1.59e-07 | 8.12e-08 | 100 |
| hsa0415013 | Esophagus | ESCC | mTOR signaling pathway | 98/4205 | 156/8465 | 5.81e-04 | 1.95e-03 | 9.97e-04 | 98 |
| hsa0493113 | Esophagus | ESCC | Insulin resistance | 69/4205 | 108/8465 | 1.92e-03 | 5.54e-03 | 2.84e-03 | 69 |
| hsa040108 | Lung | IAC | MAPK signaling pathway | 62/1053 | 302/8465 | 3.54e-05 | 6.38e-04 | 4.24e-04 | 62 |
| hsa0472212 | Lung | IAC | Neurotrophin signaling pathway | 29/1053 | 119/8465 | 2.34e-04 | 2.54e-03 | 1.68e-03 | 29 |
| hsa0513514 | Lung | IAC | Yersinia infection | 32/1053 | 137/8465 | 2.63e-04 | 2.76e-03 | 1.83e-03 | 32 |
| hsa0471416 | Lung | IAC | Thermogenesis | 46/1053 | 232/8465 | 7.85e-04 | 6.38e-03 | 4.23e-03 | 46 |
| Page: 1 2 3 |
Top |
Cell-cell communication analysis |
| Identification of potential cell-cell interactions between two cell types and their ligand-receptor pairs for different disease states |
| Ligand | Receptor | LRpair | Pathway | Tissue | Disease Stage |
| Page: 1 |
Top |
Single-cell gene regulatory network inference analysis |
| Find out the significant the regulons (TFs) and the target genes of each regulon across cell types for different disease states |
| TF | Cell Type | Tissue | Disease Stage | Target Gene | RSS | Regulon Activity |
| ∗The dot plots of a searched regulon are shown for all cell subpopulations in each disease state of each tissue based on the regulon specific score inferred using pySCENIC and by calculating the average expression. |
| Page: 1 |
Top |
Somatic mutation of malignant transformation related genes |
| Annotation of somatic variants for genes involved in malignant transformation |
| Hugo Symbol | Variant Class | Variant Classification | dbSNP RS | HGVSc | HGVSp | HGVSp Short | SWISSPROT | BIOTYPE | SIFT | PolyPhen | Tumor Sample Barcode | Tissue | Histology | Sex | Age | Stage | Therapy Types | Drugs | Outcome |
| RPS6KA2 | SNV | Missense_Mutation | c.543C>G | p.Phe181Leu | p.F181L | protein_coding | deleterious(0) | probably_damaging(0.986) | TCGA-A7-A13D-01 | Breast | breast invasive carcinoma | Female | <65 | I/II | Chemotherapy | cytoxan | SD | ||
| RPS6KA2 | SNV | Missense_Mutation | c.1992C>A | p.Asp664Glu | p.D664E | protein_coding | tolerated(0.3) | benign(0.033) | TCGA-AR-A24H-01 | Breast | breast invasive carcinoma | Female | >=65 | I/II | Hormone Therapy | tamoxiphen | SD | ||
| RPS6KA2 | SNV | Missense_Mutation | novel | c.550N>A | p.Glu184Lys | p.E184K | protein_coding | deleterious(0.03) | benign(0.344) | TCGA-B6-A0RQ-01 | Breast | breast invasive carcinoma | Female | >=65 | I/II | Unknown | Unknown | SD | |
| RPS6KA2 | SNV | Missense_Mutation | rs751151339 | c.740N>T | p.Thr247Met | p.T247M | protein_coding | deleterious(0) | probably_damaging(0.995) | TCGA-BH-A0C3-01 | Breast | breast invasive carcinoma | Female | <65 | I/II | Chemotherapy | adriamycin | PD | |
| RPS6KA2 | SNV | Missense_Mutation | novel | c.1876T>G | p.Leu626Val | p.L626V | protein_coding | deleterious(0) | benign(0.291) | TCGA-C8-A1HJ-01 | Breast | breast invasive carcinoma | Female | <65 | I/II | Unknown | Unknown | SD | |
| RPS6KA2 | insertion | Frame_Shift_Ins | novel | c.795_796insTCGCTGGTCCTTTGCCACTTGGGTCACTG | p.Asp266SerfsTer89 | p.D266Sfs*89 | protein_coding | TCGA-A2-A04Y-01 | Breast | breast invasive carcinoma | Female | <65 | I/II | Chemotherapy | cytoxan | SD | |||
| RPS6KA2 | insertion | Frame_Shift_Ins | novel | c.1171_1172insTGATCTCACGTGG | p.Ser391MetfsTer13 | p.S391Mfs*13 | protein_coding | TCGA-A2-A0EX-01 | Breast | breast invasive carcinoma | Female | <65 | I/II | Hormone Therapy | tamoxiphen | SD | |||
| RPS6KA2 | insertion | Frame_Shift_Ins | novel | c.1555_1556insCTAGCCAACATGGTGAAACCCTGTCTCTACTAAAAATAACA | p.Leu519ProfsTer54 | p.L519Pfs*54 | protein_coding | TCGA-A8-A097-01 | Breast | breast invasive carcinoma | Female | >=65 | I/II | Hormone Therapy | tamoxiphen | SD | |||
| RPS6KA2 | deletion | Frame_Shift_Del | novel | c.993delN | p.Ile331MetfsTer14 | p.I331Mfs*14 | protein_coding | TCGA-D8-A27V-01 | Breast | breast invasive carcinoma | Female | <65 | I/II | Hormone Therapy | tamoxiphen | SD | |||
| RPS6KA2 | SNV | Missense_Mutation | rs759240466 | c.1016G>A | p.Arg339His | p.R339H | protein_coding | deleterious(0) | benign(0.306) | TCGA-2W-A8YY-01 | Cervix | cervical & endocervical cancer | Female | <65 | I/II | Chemotherapy | cisplatin | CR |
| Page: 1 2 3 4 5 6 7 8 9 10 11 12 |
Top |
Related drugs of malignant transformation related genes |
| Identification of chemicals and drugs interact with genes involved in malignant transfromation |
| (DGIdb 4.0) |
| Entrez ID | Symbol | Category | Interaction Types | Drug Claim Name | Drug Name | PMIDs |
| 6196 | RPS6KA2 | TRANSCRIPTION FACTOR, KINASE, SERINE THREONINE KINASE, ENZYME, DRUGGABLE GENOME | BI-D1870 | CHEMBL573107 | ||
| 6196 | RPS6KA2 | TRANSCRIPTION FACTOR, KINASE, SERINE THREONINE KINASE, ENZYME, DRUGGABLE GENOME | inhibitor | 249565819 | ||
| 6196 | RPS6KA2 | TRANSCRIPTION FACTOR, KINASE, SERINE THREONINE KINASE, ENZYME, DRUGGABLE GENOME | inhibitor | 249565718 | CHEMBL573107 |
| Page: 1 |

Copyright 2023-Present -The University of Texas Health Science Center at Houston |