
|
|||||
|
 | |
| |
| |
| |
| |
| |
|
Gene: RPS6KA1 |
Gene summary for RPS6KA1 |
| Gene information | Species | Human | Gene symbol | RPS6KA1 | Gene ID | 6195 |
| Gene name | ribosomal protein S6 kinase A1 | |
| Gene Alias | HU-1 | |
| Cytomap | 1p36.11 | |
| Gene Type | protein-coding | GO ID | GO:0001558 | UniProtAcc | Q15418 |
Top |
Malignant transformation analysis |
| Identification of the aberrant gene expression in precancerous and cancerous lesions by comparing the gene expression of stem-like cells in diseased tissues with normal stem cells |
| Entrez ID | Symbol | Replicates | Species | Organ | Tissue | Adj P-value | Log2FC | Malignancy |
| 6195 | RPS6KA1 | HTA11_2487_2000001011 | Human | Colorectum | SER | 4.60e-03 | 4.38e-01 | -0.1808 |
| 6195 | RPS6KA1 | HTA11_347_2000001011 | Human | Colorectum | AD | 2.67e-12 | 4.34e-01 | -0.1954 |
| 6195 | RPS6KA1 | HTA11_2112_2000001011 | Human | Colorectum | SER | 4.54e-05 | 8.47e-01 | -0.2196 |
| 6195 | RPS6KA1 | HTA11_3361_2000001011 | Human | Colorectum | AD | 3.20e-03 | 4.04e-01 | -0.1207 |
| 6195 | RPS6KA1 | HTA11_83_2000001011 | Human | Colorectum | SER | 9.79e-04 | 3.31e-01 | -0.1526 |
| 6195 | RPS6KA1 | HTA11_696_2000001011 | Human | Colorectum | AD | 2.41e-04 | 4.25e-01 | -0.1464 |
| 6195 | RPS6KA1 | HTA11_866_2000001011 | Human | Colorectum | AD | 2.96e-04 | 3.66e-01 | -0.1001 |
| 6195 | RPS6KA1 | HTA11_1391_2000001011 | Human | Colorectum | AD | 2.42e-07 | 6.00e-01 | -0.059 |
| 6195 | RPS6KA1 | HTA11_2992_2000001011 | Human | Colorectum | SER | 4.97e-02 | 4.67e-01 | -0.1706 |
| 6195 | RPS6KA1 | A015-C-203 | Human | Colorectum | FAP | 8.53e-07 | -4.26e-02 | -0.1294 |
| 6195 | RPS6KA1 | A001-C-108 | Human | Colorectum | FAP | 7.06e-03 | -8.09e-02 | -0.0272 |
| 6195 | RPS6KA1 | A002-C-205 | Human | Colorectum | FAP | 4.50e-04 | -1.97e-01 | -0.1236 |
| 6195 | RPS6KA1 | A015-C-104 | Human | Colorectum | FAP | 8.30e-08 | -6.52e-02 | -0.1899 |
| 6195 | RPS6KA1 | A001-C-014 | Human | Colorectum | FAP | 6.85e-03 | -8.23e-02 | 0.0135 |
| 6195 | RPS6KA1 | A002-C-016 | Human | Colorectum | FAP | 6.74e-06 | -1.31e-01 | 0.0521 |
| 6195 | RPS6KA1 | A002-C-116 | Human | Colorectum | FAP | 3.21e-09 | -1.99e-01 | -0.0452 |
| 6195 | RPS6KA1 | A018-E-020 | Human | Colorectum | FAP | 8.93e-03 | -4.09e-02 | -0.2034 |
| 6195 | RPS6KA1 | F034 | Human | Colorectum | FAP | 6.15e-05 | -1.31e-01 | -0.0665 |
| 6195 | RPS6KA1 | CRC-1-8810 | Human | Colorectum | CRC | 1.74e-04 | -1.95e-01 | 0.6257 |
| 6195 | RPS6KA1 | CRC-3-11773 | Human | Colorectum | CRC | 4.34e-04 | -9.93e-02 | 0.2564 |
| Page: 1 2 3 |
| Tissue | Expression Dynamics | Abbreviation |
| Colorectum (GSE201348) |  | FAP: Familial adenomatous polyposis |
| CRC: Colorectal cancer | ||
| Colorectum (HTA11) | 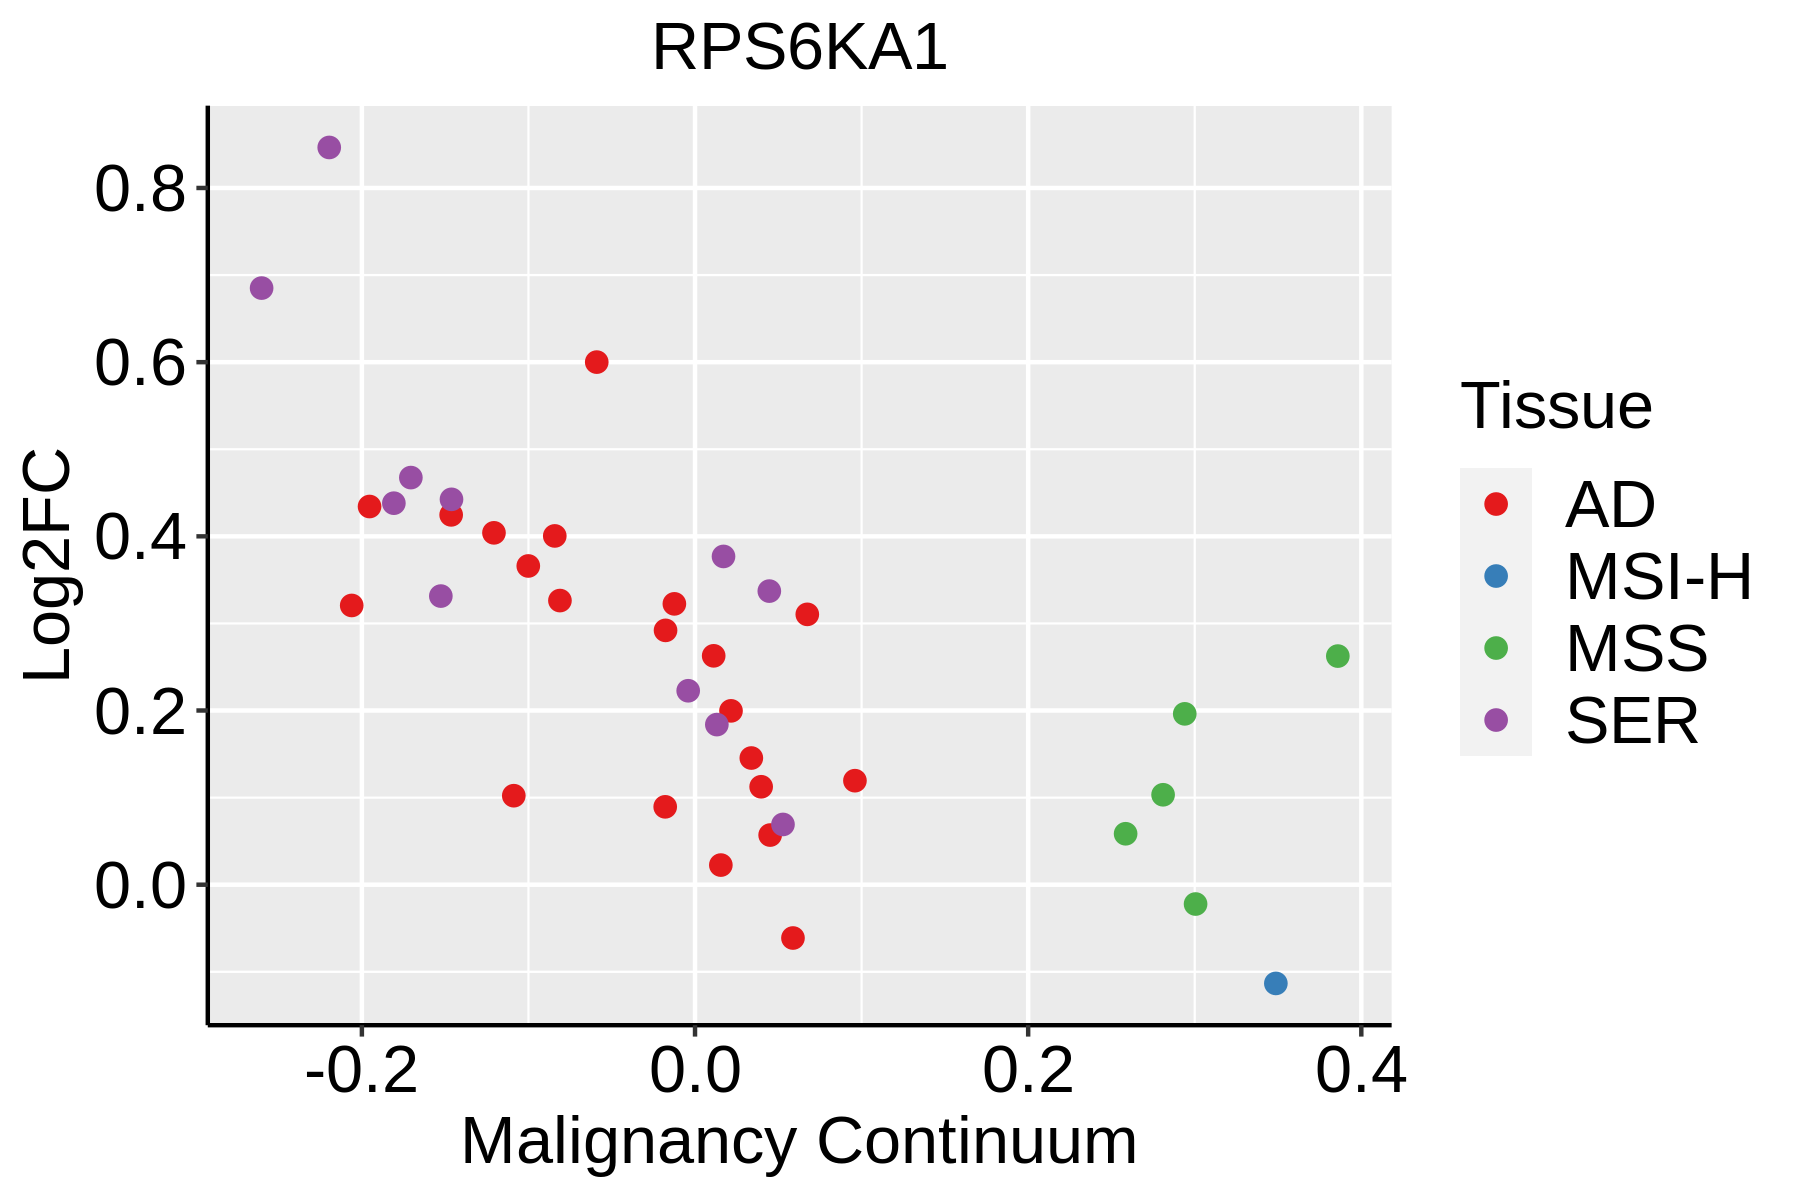 | AD: Adenomas |
| SER: Sessile serrated lesions | ||
| MSI-H: Microsatellite-high colorectal cancer | ||
| MSS: Microsatellite stable colorectal cancer | ||
| Liver | 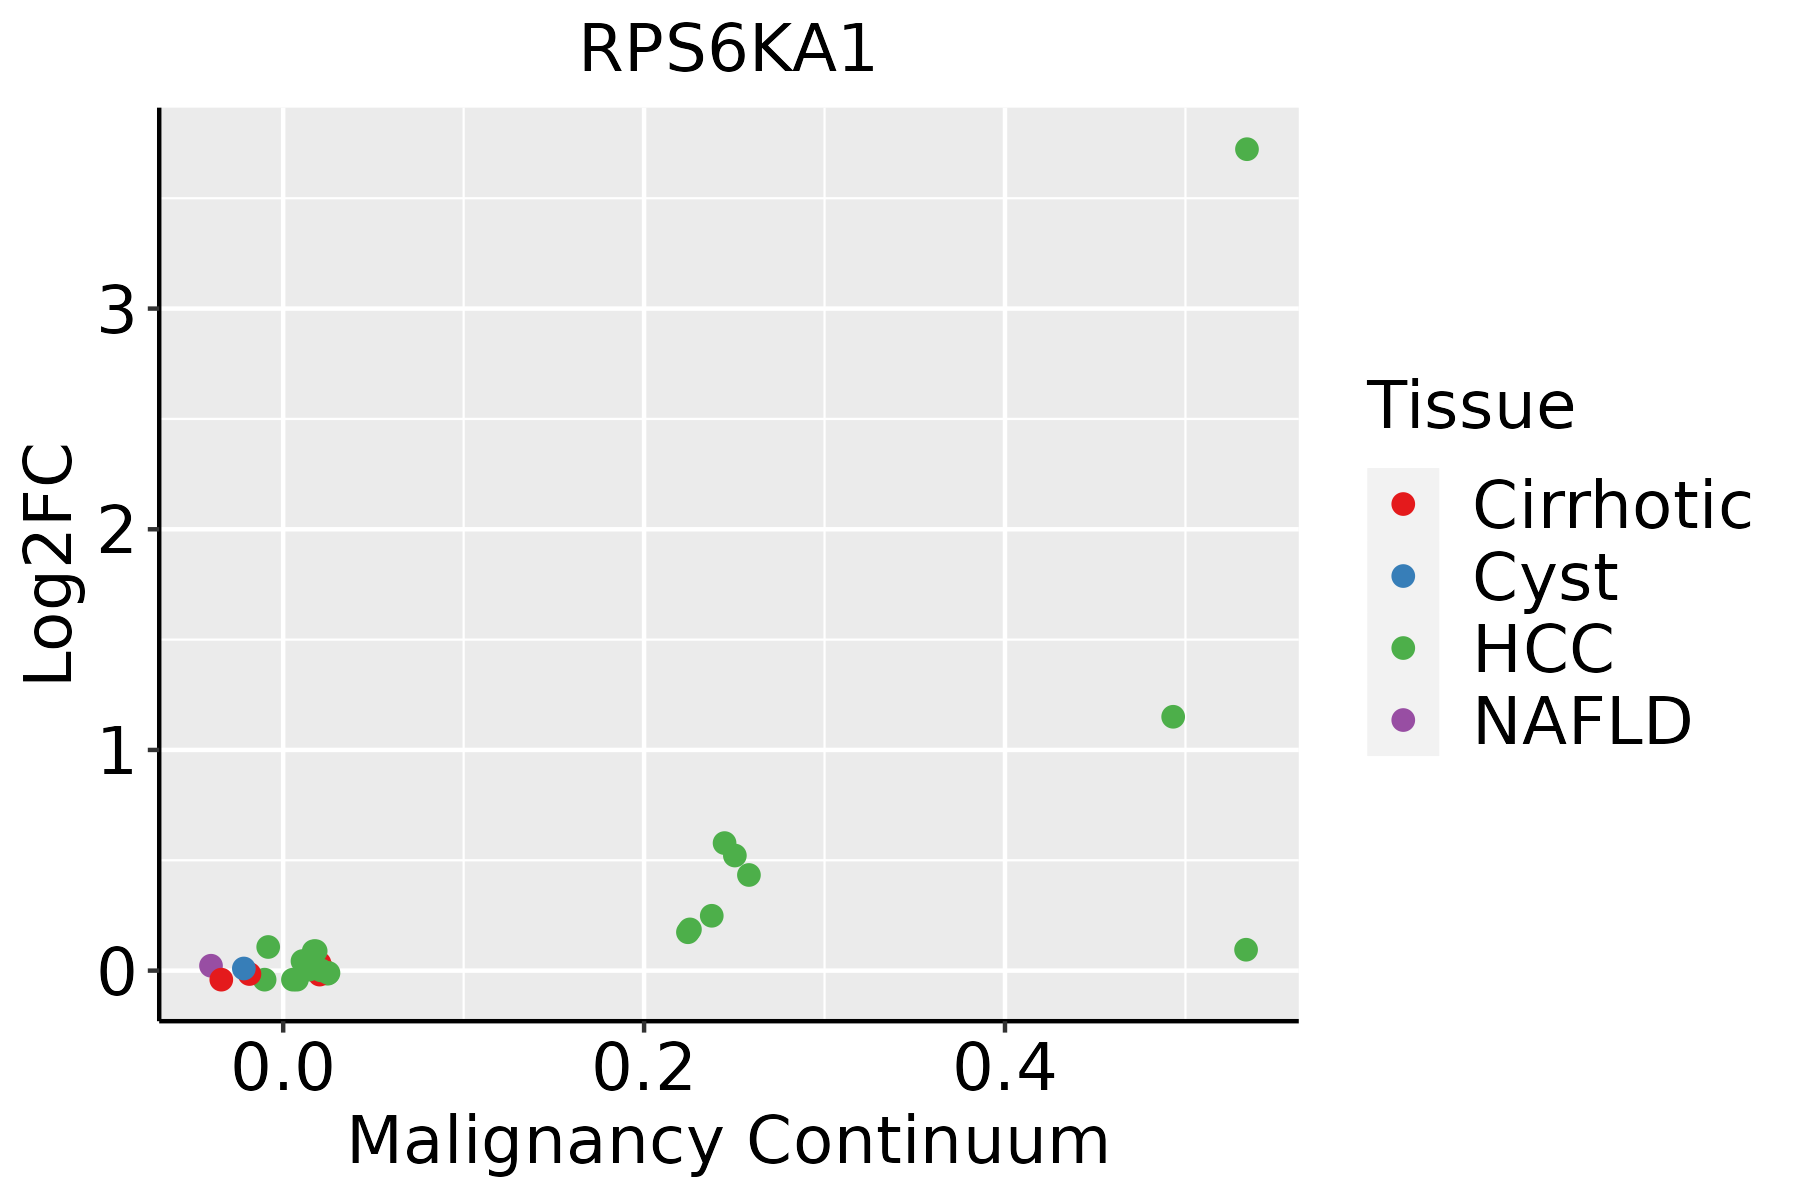 | HCC: Hepatocellular carcinoma |
| NAFLD: Non-alcoholic fatty liver disease | ||
| Oral Cavity | 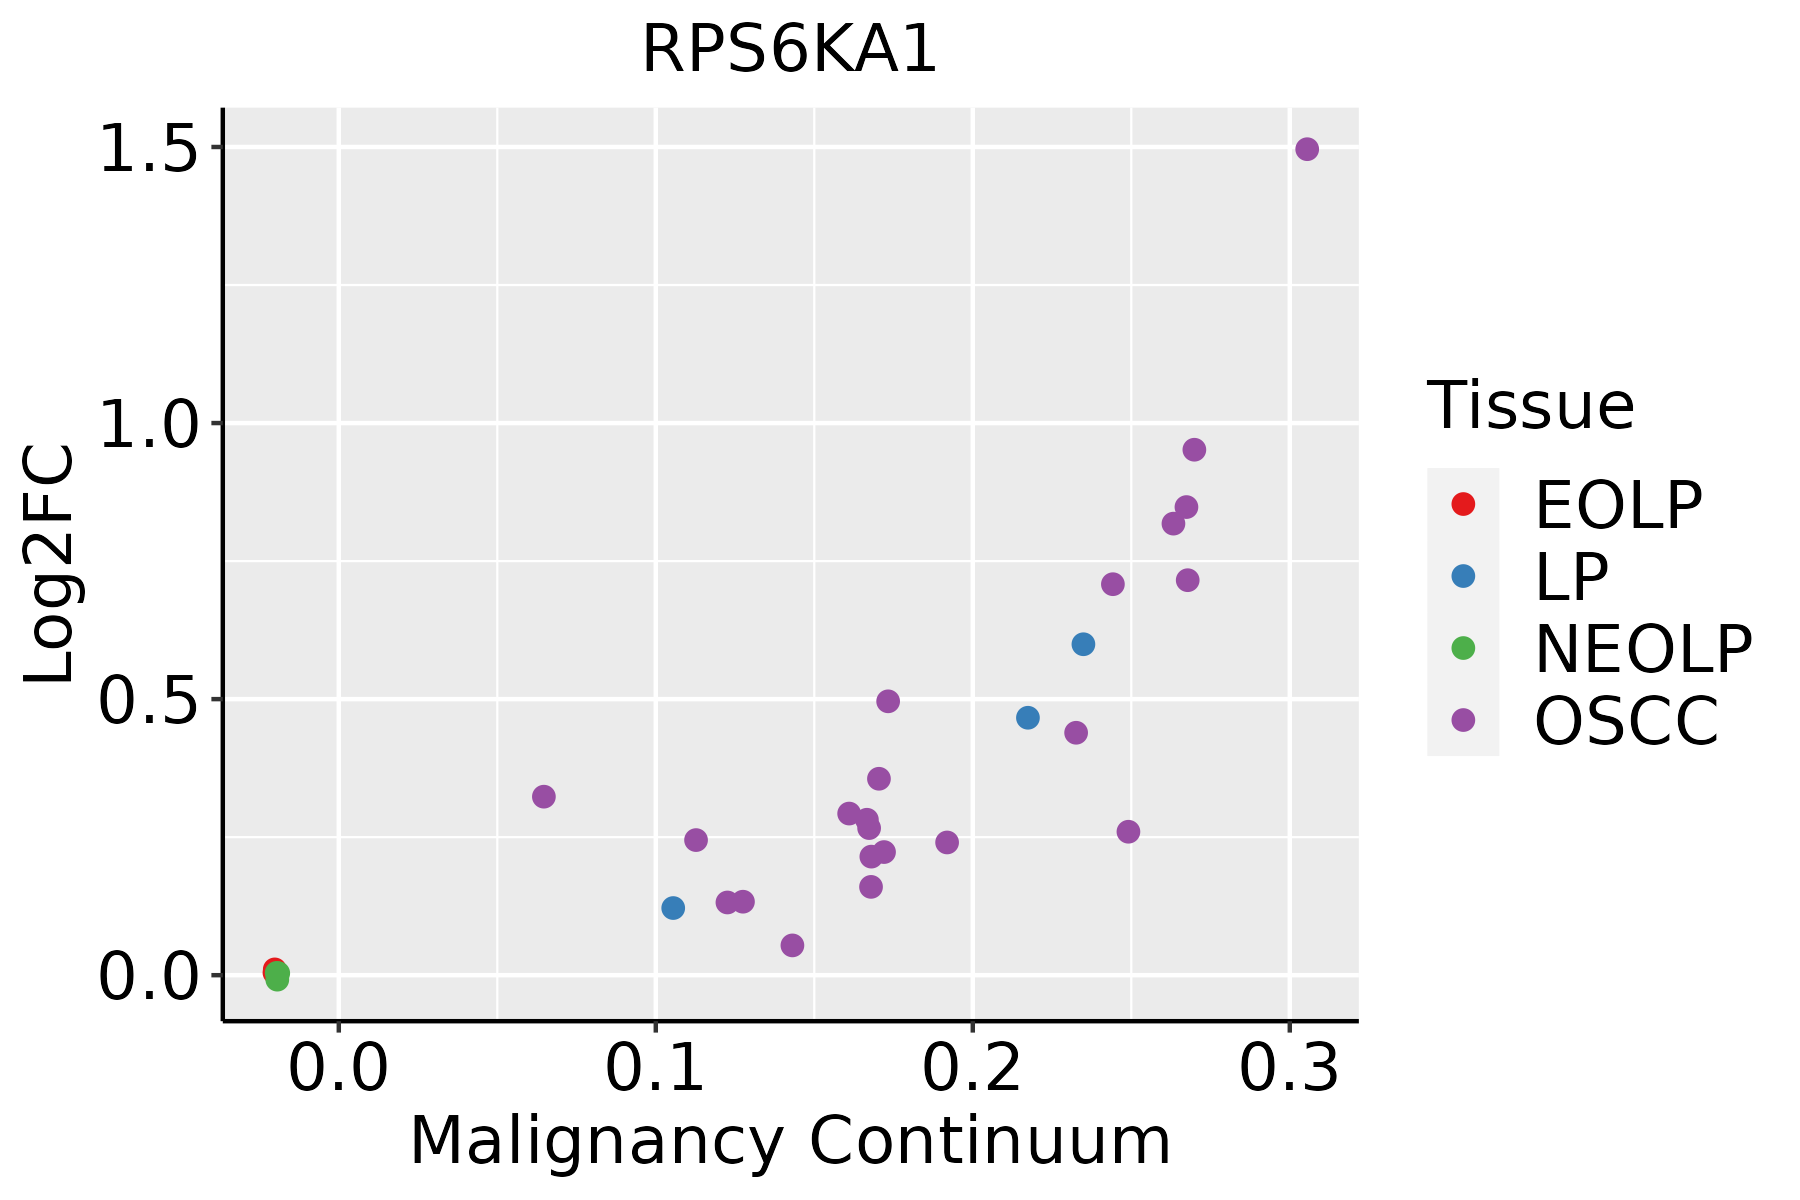 | EOLP: Erosive Oral lichen planus |
| LP: leukoplakia | ||
| NEOLP: Non-erosive oral lichen planus | ||
| OSCC: Oral squamous cell carcinoma | ||
| Skin | 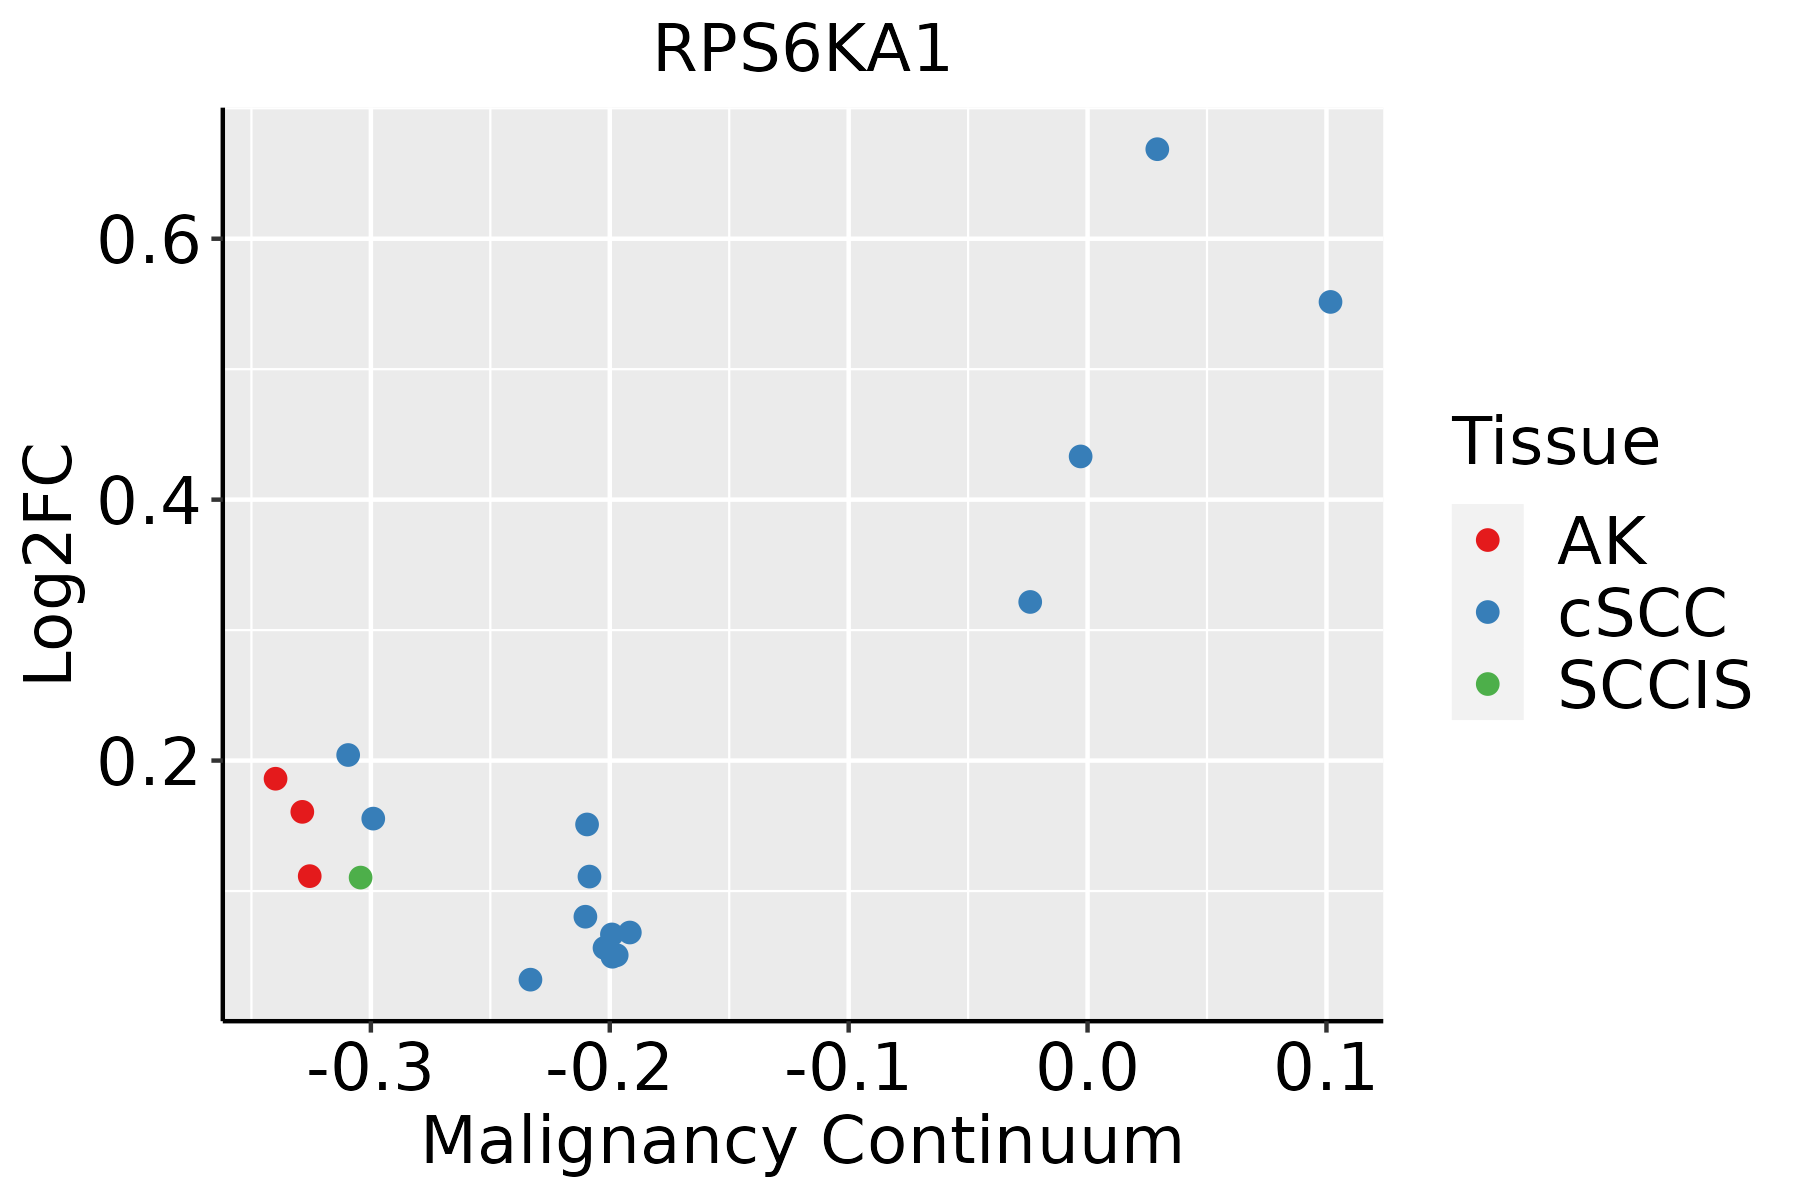 | AK: Actinic keratosis |
| cSCC: Cutaneous squamous cell carcinoma | ||
| SCCIS:squamous cell carcinoma in situ |
| ∗log2FC in expression of this searched gene in stem-like cells from each diseased tissue sample relative to stem-like cells in normal samples in each tissue plotted against the malignancy continuum. Samples are colored based on if they are from different disease stage. |
Top |
Malignant transformation related pathway analysis |
| Find out the enriched GO biological processes and KEGG pathways involved in transition from healthy to precancer to cancer |
| Tissue | Disease Stage | Enriched GO biological Processes |
| Colorectum | AD |  |
| Colorectum | SER |  |
| Colorectum | MSS |  |
| Colorectum | MSI-H |  |
| Colorectum | FAP |  |
| ∗Top 15 enriched GO BP terms are showed in the bar plot of each disease state in each tissue. Each row represents a significant GO biological process which is colored according to the -log10(p.adjust). |
| Page: 1 2 3 4 5 6 7 8 9 |
| GO ID | Tissue | Disease Stage | Description | Gene Ratio | Bg Ratio | pvalue | p.adjust | Count |
| GO:0048732 | Colorectum | AD | gland development | 149/3918 | 436/18723 | 6.07e-11 | 6.33e-09 | 149 |
| GO:0006417 | Colorectum | AD | regulation of translation | 141/3918 | 468/18723 | 1.32e-06 | 4.22e-05 | 141 |
| GO:0016049 | Colorectum | AD | cell growth | 143/3918 | 482/18723 | 2.83e-06 | 8.09e-05 | 143 |
| GO:0043281 | Colorectum | AD | regulation of cysteine-type endopeptidase activity involved in apoptotic process | 72/3918 | 209/18723 | 3.70e-06 | 1.03e-04 | 72 |
| GO:2000116 | Colorectum | AD | regulation of cysteine-type endopeptidase activity | 79/3918 | 235/18723 | 3.74e-06 | 1.03e-04 | 79 |
| GO:0052547 | Colorectum | AD | regulation of peptidase activity | 137/3918 | 461/18723 | 4.12e-06 | 1.12e-04 | 137 |
| GO:0061008 | Colorectum | AD | hepaticobiliary system development | 55/3918 | 150/18723 | 6.34e-06 | 1.59e-04 | 55 |
| GO:0001889 | Colorectum | AD | liver development | 54/3918 | 147/18723 | 7.20e-06 | 1.77e-04 | 54 |
| GO:0001558 | Colorectum | AD | regulation of cell growth | 124/3918 | 414/18723 | 7.67e-06 | 1.86e-04 | 124 |
| GO:0045861 | Colorectum | AD | negative regulation of proteolysis | 106/3918 | 351/18723 | 2.33e-05 | 4.57e-04 | 106 |
| GO:0052548 | Colorectum | AD | regulation of endopeptidase activity | 124/3918 | 432/18723 | 6.58e-05 | 1.07e-03 | 124 |
| GO:0022612 | Colorectum | AD | gland morphogenesis | 42/3918 | 118/18723 | 1.62e-04 | 2.23e-03 | 42 |
| GO:0043620 | Colorectum | AD | regulation of DNA-templated transcription in response to stress | 23/3918 | 53/18723 | 1.86e-04 | 2.49e-03 | 23 |
| GO:0043154 | Colorectum | AD | negative regulation of cysteine-type endopeptidase activity involved in apoptotic process | 30/3918 | 78/18723 | 2.95e-04 | 3.59e-03 | 30 |
| GO:0030307 | Colorectum | AD | positive regulation of cell growth | 54/3918 | 166/18723 | 3.08e-04 | 3.69e-03 | 54 |
| GO:0045927 | Colorectum | AD | positive regulation of growth | 77/3918 | 259/18723 | 4.82e-04 | 5.27e-03 | 77 |
| GO:2000117 | Colorectum | AD | negative regulation of cysteine-type endopeptidase activity | 31/3918 | 86/18723 | 8.67e-04 | 8.45e-03 | 31 |
| GO:0050673 | Colorectum | AD | epithelial cell proliferation | 119/3918 | 437/18723 | 8.75e-04 | 8.51e-03 | 119 |
| GO:0018105 | Colorectum | AD | peptidyl-serine phosphorylation | 88/3918 | 315/18723 | 1.73e-03 | 1.43e-02 | 88 |
| GO:0018209 | Colorectum | AD | peptidyl-serine modification | 92/3918 | 338/18723 | 3.19e-03 | 2.36e-02 | 92 |
| Page: 1 2 3 4 5 6 7 8 9 10 |
| Pathway ID | Tissue | Disease Stage | Description | Gene Ratio | Bg Ratio | pvalue | p.adjust | qvalue | Count |
| hsa04714 | Colorectum | AD | Thermogenesis | 120/2092 | 232/8465 | 2.76e-19 | 1.16e-17 | 7.37e-18 | 120 |
| hsa05135 | Colorectum | AD | Yersinia infection | 58/2092 | 137/8465 | 3.90e-06 | 4.35e-05 | 2.78e-05 | 58 |
| hsa04722 | Colorectum | AD | Neurotrophin signaling pathway | 50/2092 | 119/8465 | 2.28e-05 | 2.24e-04 | 1.43e-04 | 50 |
| hsa047141 | Colorectum | AD | Thermogenesis | 120/2092 | 232/8465 | 2.76e-19 | 1.16e-17 | 7.37e-18 | 120 |
| hsa051351 | Colorectum | AD | Yersinia infection | 58/2092 | 137/8465 | 3.90e-06 | 4.35e-05 | 2.78e-05 | 58 |
| hsa047221 | Colorectum | AD | Neurotrophin signaling pathway | 50/2092 | 119/8465 | 2.28e-05 | 2.24e-04 | 1.43e-04 | 50 |
| hsa047142 | Colorectum | SER | Thermogenesis | 106/1580 | 232/8465 | 1.15e-21 | 6.34e-20 | 4.61e-20 | 106 |
| hsa051352 | Colorectum | SER | Yersinia infection | 43/1580 | 137/8465 | 2.15e-04 | 2.10e-03 | 1.52e-03 | 43 |
| hsa047222 | Colorectum | SER | Neurotrophin signaling pathway | 35/1580 | 119/8465 | 2.80e-03 | 2.02e-02 | 1.47e-02 | 35 |
| hsa047202 | Colorectum | SER | Long-term potentiation | 21/1580 | 67/8465 | 8.52e-03 | 4.26e-02 | 3.09e-02 | 21 |
| hsa047143 | Colorectum | SER | Thermogenesis | 106/1580 | 232/8465 | 1.15e-21 | 6.34e-20 | 4.61e-20 | 106 |
| hsa051353 | Colorectum | SER | Yersinia infection | 43/1580 | 137/8465 | 2.15e-04 | 2.10e-03 | 1.52e-03 | 43 |
| hsa047223 | Colorectum | SER | Neurotrophin signaling pathway | 35/1580 | 119/8465 | 2.80e-03 | 2.02e-02 | 1.47e-02 | 35 |
| hsa047203 | Colorectum | SER | Long-term potentiation | 21/1580 | 67/8465 | 8.52e-03 | 4.26e-02 | 3.09e-02 | 21 |
| hsa047148 | Colorectum | FAP | Thermogenesis | 70/1404 | 232/8465 | 1.38e-07 | 3.08e-06 | 1.87e-06 | 70 |
| hsa051356 | Colorectum | FAP | Yersinia infection | 43/1404 | 137/8465 | 1.21e-05 | 1.62e-04 | 9.86e-05 | 43 |
| hsa047226 | Colorectum | FAP | Neurotrophin signaling pathway | 38/1404 | 119/8465 | 2.49e-05 | 2.78e-04 | 1.69e-04 | 38 |
| hsa049312 | Colorectum | FAP | Insulin resistance | 32/1404 | 108/8465 | 4.90e-04 | 3.56e-03 | 2.16e-03 | 32 |
| hsa04010 | Colorectum | FAP | MAPK signaling pathway | 68/1404 | 302/8465 | 4.00e-03 | 1.67e-02 | 1.02e-02 | 68 |
| hsa047206 | Colorectum | FAP | Long-term potentiation | 20/1404 | 67/8465 | 4.82e-03 | 1.91e-02 | 1.16e-02 | 20 |
| Page: 1 2 3 4 |
Top |
Cell-cell communication analysis |
| Identification of potential cell-cell interactions between two cell types and their ligand-receptor pairs for different disease states |
| Ligand | Receptor | LRpair | Pathway | Tissue | Disease Stage |
| Page: 1 |
Top |
Single-cell gene regulatory network inference analysis |
| Find out the significant the regulons (TFs) and the target genes of each regulon across cell types for different disease states |
| TF | Cell Type | Tissue | Disease Stage | Target Gene | RSS | Regulon Activity |
| ∗The dot plots of a searched regulon are shown for all cell subpopulations in each disease state of each tissue based on the regulon specific score inferred using pySCENIC and by calculating the average expression. |
| Page: 1 |
Top |
Somatic mutation of malignant transformation related genes |
| Annotation of somatic variants for genes involved in malignant transformation |
| Hugo Symbol | Variant Class | Variant Classification | dbSNP RS | HGVSc | HGVSp | HGVSp Short | SWISSPROT | BIOTYPE | SIFT | PolyPhen | Tumor Sample Barcode | Tissue | Histology | Sex | Age | Stage | Therapy Types | Drugs | Outcome |
| RPS6KA1 | SNV | Missense_Mutation | novel | c.107G>T | p.Gly36Val | p.G36V | Q15418 | protein_coding | tolerated(0.19) | benign(0.015) | TCGA-A2-A0D2-01 | Breast | breast invasive carcinoma | Female | <65 | I/II | Chemotherapy | adriamycin | SD |
| RPS6KA1 | SNV | Missense_Mutation | novel | c.732C>A | p.Asn244Lys | p.N244K | Q15418 | protein_coding | tolerated(0.11) | benign(0.113) | TCGA-A8-A082-01 | Breast | breast invasive carcinoma | Female | <65 | I/II | Chemotherapy | 5-fluorouracil | CR |
| RPS6KA1 | SNV | Missense_Mutation | rs768720668 | c.1195N>A | p.Asp399Asn | p.D399N | Q15418 | protein_coding | tolerated(0.34) | benign(0.001) | TCGA-BH-A0AY-01 | Breast | breast invasive carcinoma | Female | <65 | I/II | Chemotherapy | SD | |
| RPS6KA1 | SNV | Missense_Mutation | c.908N>A | p.Arg303Gln | p.R303Q | Q15418 | protein_coding | tolerated(0.17) | benign(0.179) | TCGA-EW-A1IY-01 | Breast | breast invasive carcinoma | Female | <65 | I/II | Chemotherapy | taxotere | SD | |
| RPS6KA1 | SNV | Missense_Mutation | rs766116930 | c.1397N>T | p.Ser466Leu | p.S466L | Q15418 | protein_coding | deleterious(0.01) | benign(0.199) | TCGA-GM-A3XL-01 | Breast | breast invasive carcinoma | Female | <65 | I/II | Chemotherapy | fluorouracil | CR |
| RPS6KA1 | insertion | Frame_Shift_Ins | novel | c.988_989insGTTTC | p.Tyr330CysfsTer68 | p.Y330Cfs*68 | Q15418 | protein_coding | TCGA-BH-A0EE-01 | Breast | breast invasive carcinoma | Female | >=65 | I/II | Chemotherapy | docetaxel | SD | ||
| RPS6KA1 | insertion | Nonsense_Mutation | novel | c.989_990insGGGCGAAGCTAGGCATGCCCCAGTTT | p.Tyr330Ter | p.Y330* | Q15418 | protein_coding | TCGA-BH-A0EE-01 | Breast | breast invasive carcinoma | Female | >=65 | I/II | Chemotherapy | docetaxel | SD | ||
| RPS6KA1 | SNV | Missense_Mutation | novel | c.154G>A | p.Glu52Lys | p.E52K | Q15418 | protein_coding | deleterious(0.01) | probably_damaging(0.959) | TCGA-C5-A7UI-01 | Cervix | cervical & endocervical cancer | Female | <65 | I/II | Unknown | Unknown | SD |
| RPS6KA1 | SNV | Missense_Mutation | rs779751417 | c.1207N>T | p.Arg403Cys | p.R403C | Q15418 | protein_coding | tolerated(0.06) | benign(0) | TCGA-A6-6780-01 | Colorectum | colon adenocarcinoma | Male | >=65 | I/II | Unknown | Unknown | SD |
| RPS6KA1 | SNV | Missense_Mutation | novel | c.1016N>G | p.Tyr339Cys | p.Y339C | Q15418 | protein_coding | tolerated(0.06) | benign(0.054) | TCGA-AA-3950-01 | Colorectum | colon adenocarcinoma | Female | >=65 | I/II | Unknown | Unknown | SD |
| Page: 1 2 3 4 5 6 7 |
Top |
Related drugs of malignant transformation related genes |
| Identification of chemicals and drugs interact with genes involved in malignant transfromation |
| (DGIdb 4.0) |
| Entrez ID | Symbol | Category | Interaction Types | Drug Claim Name | Drug Name | PMIDs |
| 6195 | RPS6KA1 | SERINE THREONINE KINASE, KINASE, ENZYME, DRUGGABLE GENOME, TRANSCRIPTION FACTOR | 1,6-diazanaphthalenes and pyrido[2,3-d] pyrimidine derivative 1 | |||
| 6195 | RPS6KA1 | SERINE THREONINE KINASE, KINASE, ENZYME, DRUGGABLE GENOME, TRANSCRIPTION FACTOR | inhibitor | 385612197 | ||
| 6195 | RPS6KA1 | SERINE THREONINE KINASE, KINASE, ENZYME, DRUGGABLE GENOME, TRANSCRIPTION FACTOR | 1,6-diazanaphthalenes and pyrido[2,3-d] pyrimidine derivative 2 | |||
| 6195 | RPS6KA1 | SERINE THREONINE KINASE, KINASE, ENZYME, DRUGGABLE GENOME, TRANSCRIPTION FACTOR | inhibitor | 249565718 | CHEMBL573107 | |
| 6195 | RPS6KA1 | SERINE THREONINE KINASE, KINASE, ENZYME, DRUGGABLE GENOME, TRANSCRIPTION FACTOR | inhibitor | 178101606 | DORSOMORPHIN | |
| 6195 | RPS6KA1 | SERINE THREONINE KINASE, KINASE, ENZYME, DRUGGABLE GENOME, TRANSCRIPTION FACTOR | inhibitor | 249565843 | ||
| 6195 | RPS6KA1 | SERINE THREONINE KINASE, KINASE, ENZYME, DRUGGABLE GENOME, TRANSCRIPTION FACTOR | inhibitor | HESPERADIN | HESPERADIN | 19035792 |
| 6195 | RPS6KA1 | SERINE THREONINE KINASE, KINASE, ENZYME, DRUGGABLE GENOME, TRANSCRIPTION FACTOR | Pyrrolo[2,3-d]pyrimidine derivative 2 | |||
| 6195 | RPS6KA1 | SERINE THREONINE KINASE, KINASE, ENZYME, DRUGGABLE GENOME, TRANSCRIPTION FACTOR | BI-D1870 | CHEMBL573107 | ||
| 6195 | RPS6KA1 | SERINE THREONINE KINASE, KINASE, ENZYME, DRUGGABLE GENOME, TRANSCRIPTION FACTOR | Pyrrolo[2,3-d]pyrimidine derivative 1 |
| Page: 1 2 |

Copyright 2023-Present -The University of Texas Health Science Center at Houston |