
|
|||||
|
 | |
| |
| |
| |
| |
| |
|
Gene: RPS6 |
Gene summary for RPS6 |
| Gene information | Species | Human | Gene symbol | RPS6 | Gene ID | 6194 |
| Gene name | ribosomal protein S6 | |
| Gene Alias | S6 | |
| Cytomap | 9p22.1 | |
| Gene Type | protein-coding | GO ID | GO:0000003 | UniProtAcc | A2A3R6 |
Top |
Malignant transformation analysis |
| Identification of the aberrant gene expression in precancerous and cancerous lesions by comparing the gene expression of stem-like cells in diseased tissues with normal stem cells |
| Entrez ID | Symbol | Replicates | Species | Organ | Tissue | Adj P-value | Log2FC | Malignancy |
| 6194 | RPS6 | GSM4909280 | Human | Breast | Precancer | 7.49e-05 | -3.79e-01 | 0.0305 |
| 6194 | RPS6 | GSM4909281 | Human | Breast | IDC | 4.24e-17 | -1.50e-01 | 0.21 |
| 6194 | RPS6 | GSM4909286 | Human | Breast | IDC | 3.94e-25 | 1.60e-01 | 0.1081 |
| 6194 | RPS6 | GSM4909287 | Human | Breast | IDC | 1.42e-84 | -6.29e-01 | 0.2057 |
| 6194 | RPS6 | GSM4909290 | Human | Breast | IDC | 7.14e-13 | 1.40e-01 | 0.2096 |
| 6194 | RPS6 | GSM4909291 | Human | Breast | IDC | 1.84e-09 | -1.73e-01 | 0.1753 |
| 6194 | RPS6 | GSM4909292 | Human | Breast | IDC | 1.88e-11 | -4.59e-01 | 0.1236 |
| 6194 | RPS6 | GSM4909293 | Human | Breast | IDC | 2.71e-08 | -8.06e-02 | 0.1581 |
| 6194 | RPS6 | GSM4909294 | Human | Breast | IDC | 3.50e-18 | -1.87e-01 | 0.2022 |
| 6194 | RPS6 | GSM4909295 | Human | Breast | IDC | 2.81e-03 | -1.68e-01 | 0.0898 |
| 6194 | RPS6 | GSM4909297 | Human | Breast | IDC | 1.10e-09 | -1.58e-01 | 0.1517 |
| 6194 | RPS6 | GSM4909298 | Human | Breast | IDC | 3.21e-28 | -1.58e-01 | 0.1551 |
| 6194 | RPS6 | GSM4909301 | Human | Breast | IDC | 3.68e-55 | -3.12e-01 | 0.1577 |
| 6194 | RPS6 | GSM4909303 | Human | Breast | IDC | 2.51e-05 | -2.46e-01 | 0.0438 |
| 6194 | RPS6 | GSM4909304 | Human | Breast | IDC | 1.05e-91 | -3.68e-01 | 0.1636 |
| 6194 | RPS6 | GSM4909306 | Human | Breast | IDC | 4.03e-16 | -1.44e-01 | 0.1564 |
| 6194 | RPS6 | GSM4909311 | Human | Breast | IDC | 1.12e-03 | -1.13e-01 | 0.1534 |
| 6194 | RPS6 | GSM4909315 | Human | Breast | IDC | 3.54e-99 | -5.93e-01 | 0.21 |
| 6194 | RPS6 | GSM4909316 | Human | Breast | IDC | 3.56e-56 | -9.90e-01 | 0.21 |
| 6194 | RPS6 | GSM4909317 | Human | Breast | IDC | 3.17e-66 | -4.72e-01 | 0.1355 |
| Page: 1 2 3 4 5 6 7 8 9 10 11 12 13 14 15 16 17 18 19 20 |
| Tissue | Expression Dynamics | Abbreviation |
| Breast | 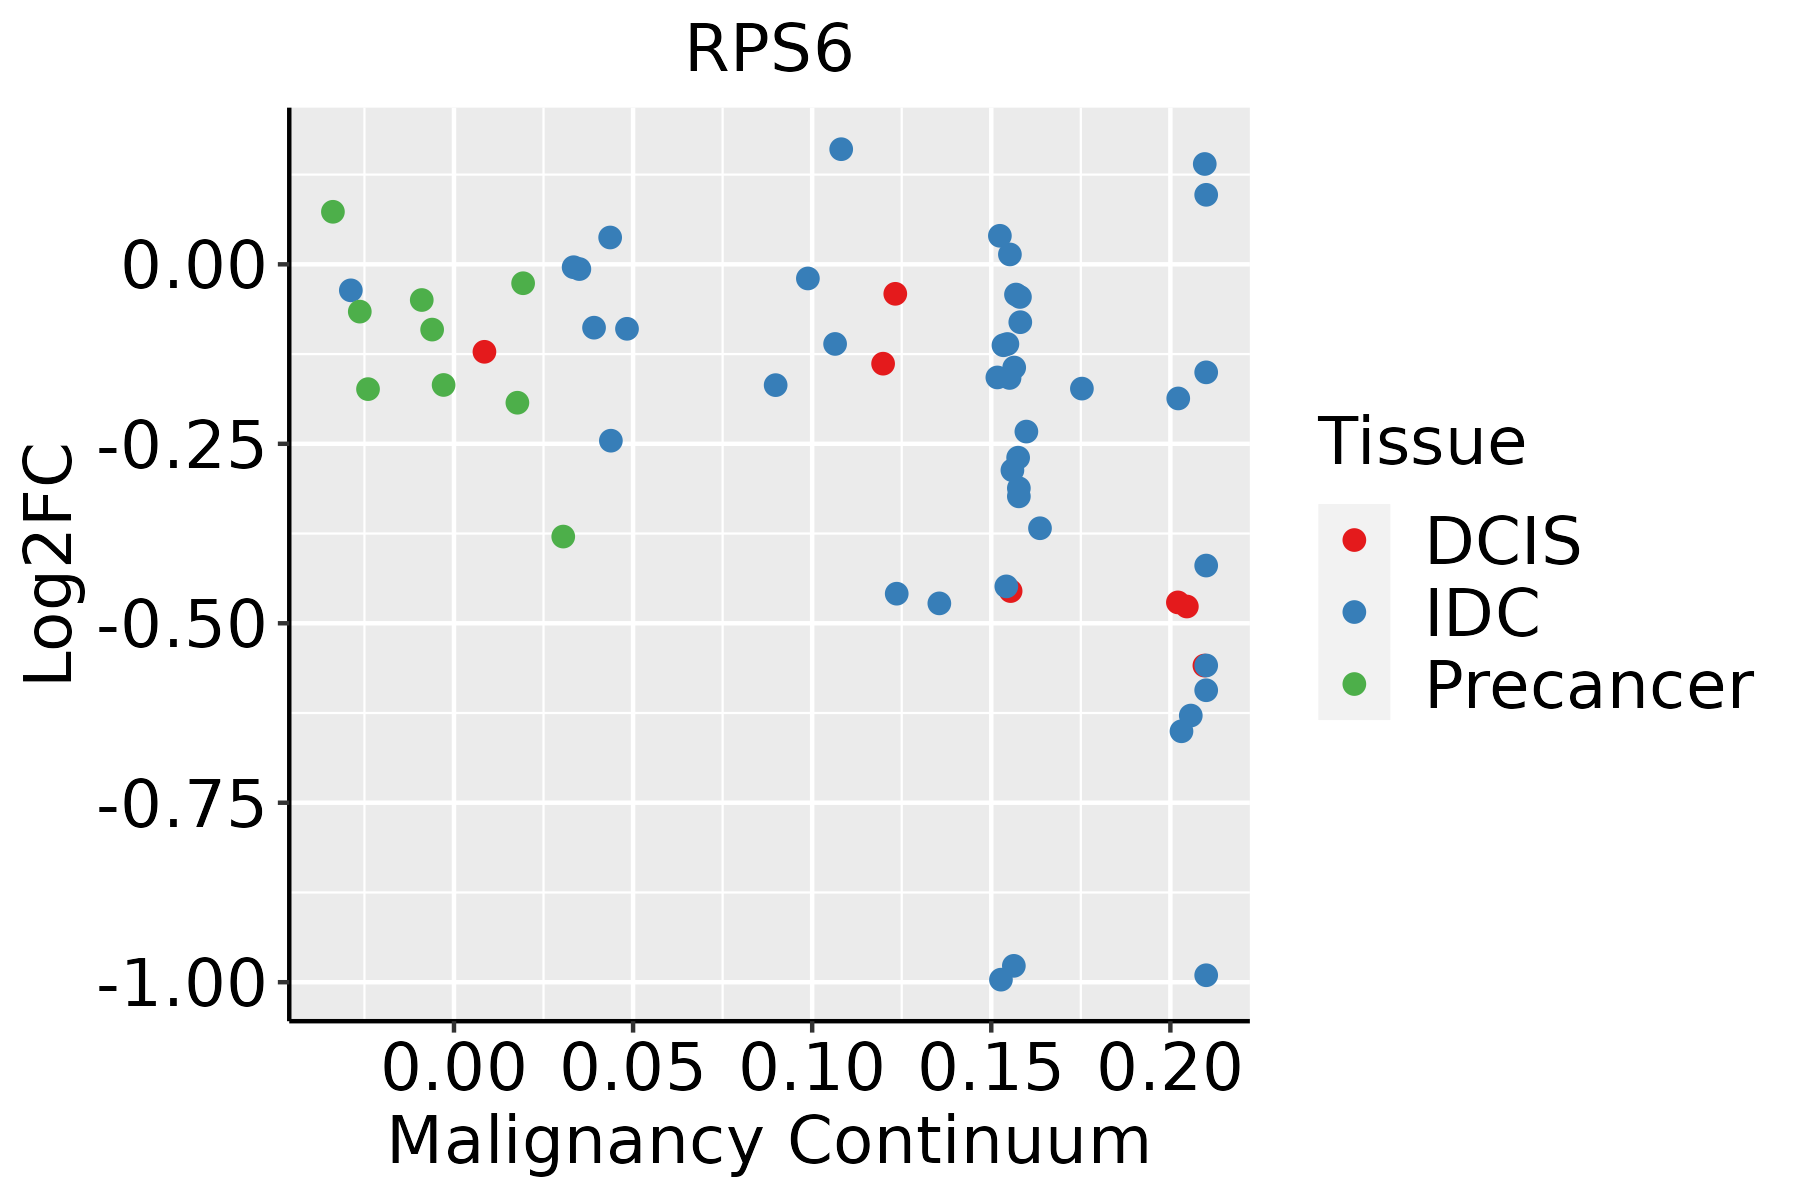 | IDC: Invasive ductal carcinoma |
| DCIS: Ductal carcinoma in situ | ||
| Precancer(BRCA1-mut): Precancerous lesion from BRCA1 mutation carriers | ||
| Cervix | 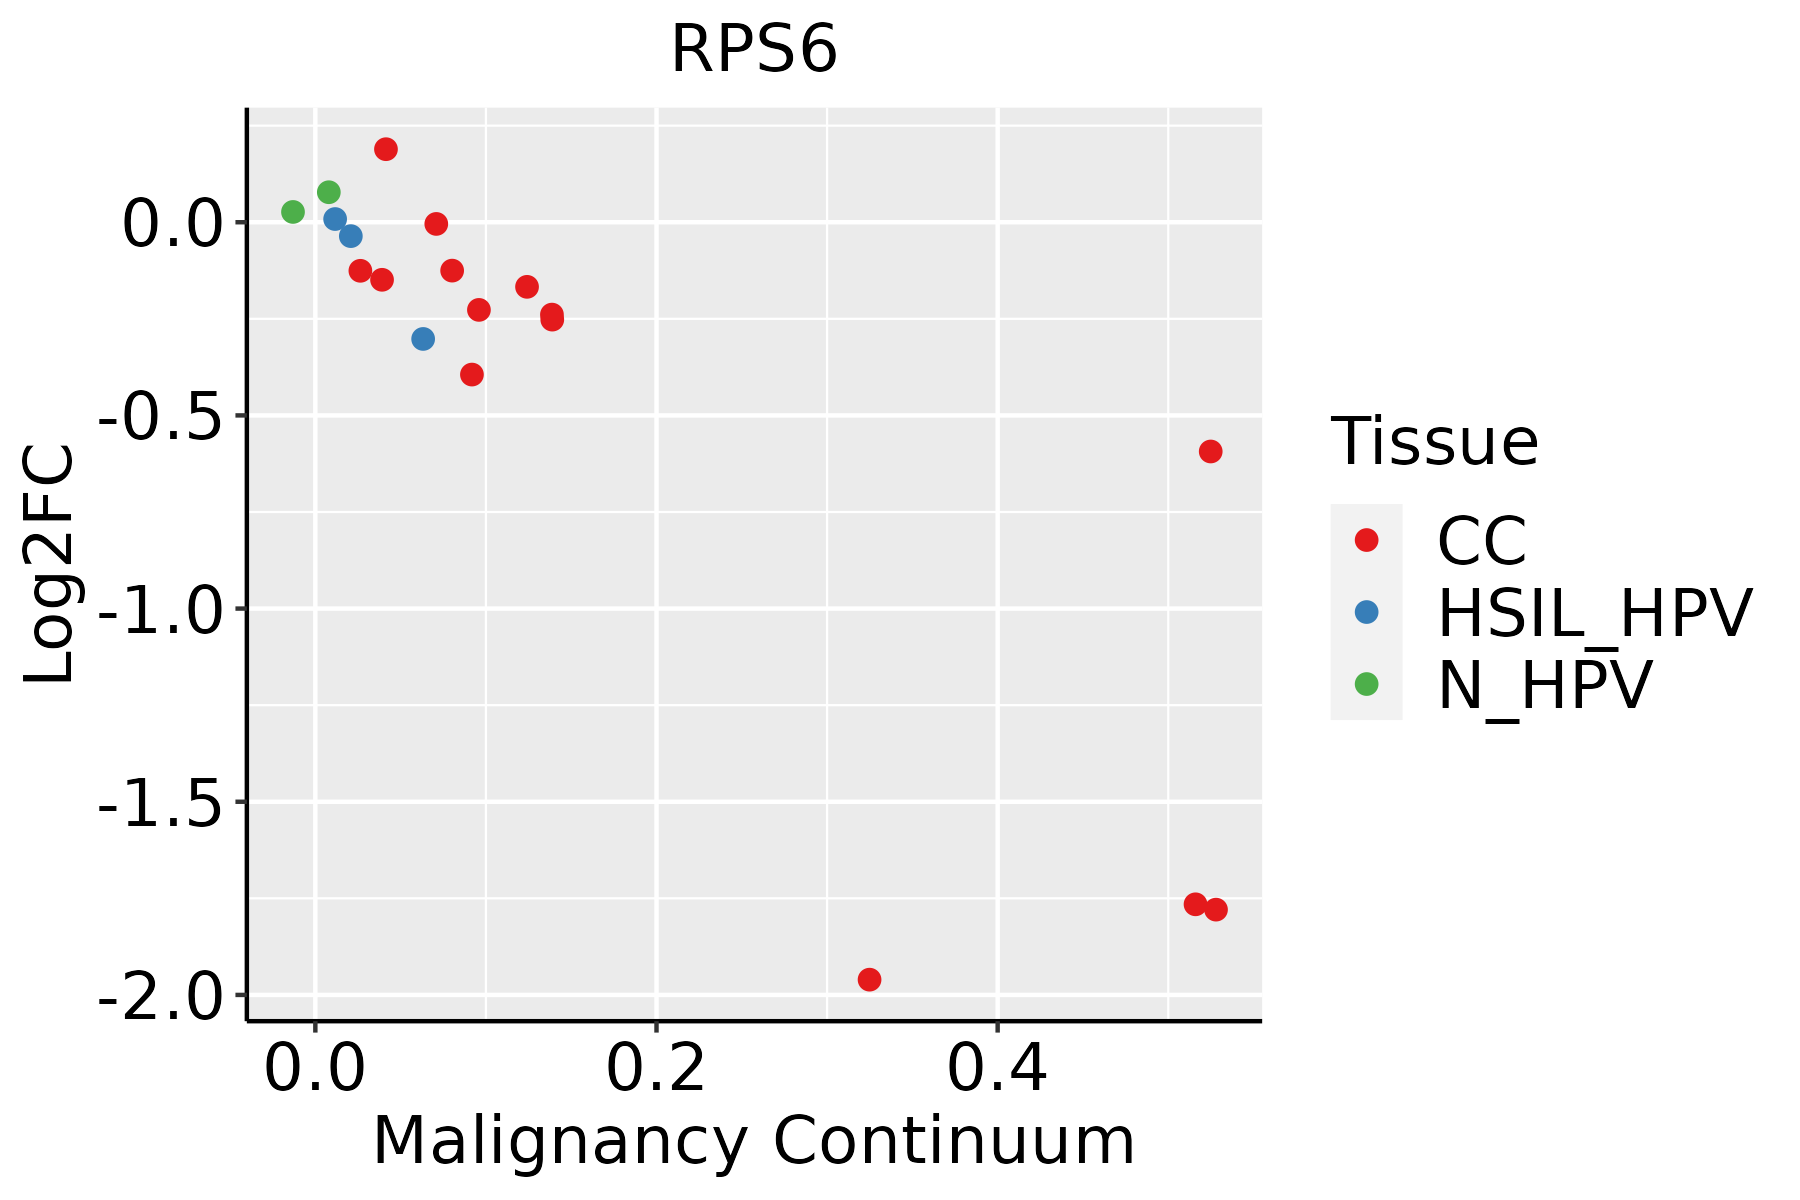 | CC: Cervix cancer |
| HSIL_HPV: HPV-infected high-grade squamous intraepithelial lesions | ||
| N_HPV: HPV-infected normal cervix | ||
| Colorectum (GSE201348) |  | FAP: Familial adenomatous polyposis |
| CRC: Colorectal cancer | ||
| Colorectum (HTA11) |  | AD: Adenomas |
| SER: Sessile serrated lesions | ||
| MSI-H: Microsatellite-high colorectal cancer | ||
| MSS: Microsatellite stable colorectal cancer | ||
| Endometrium |  | AEH: Atypical endometrial hyperplasia |
| EEC: Endometrioid Cancer | ||
| Esophagus | 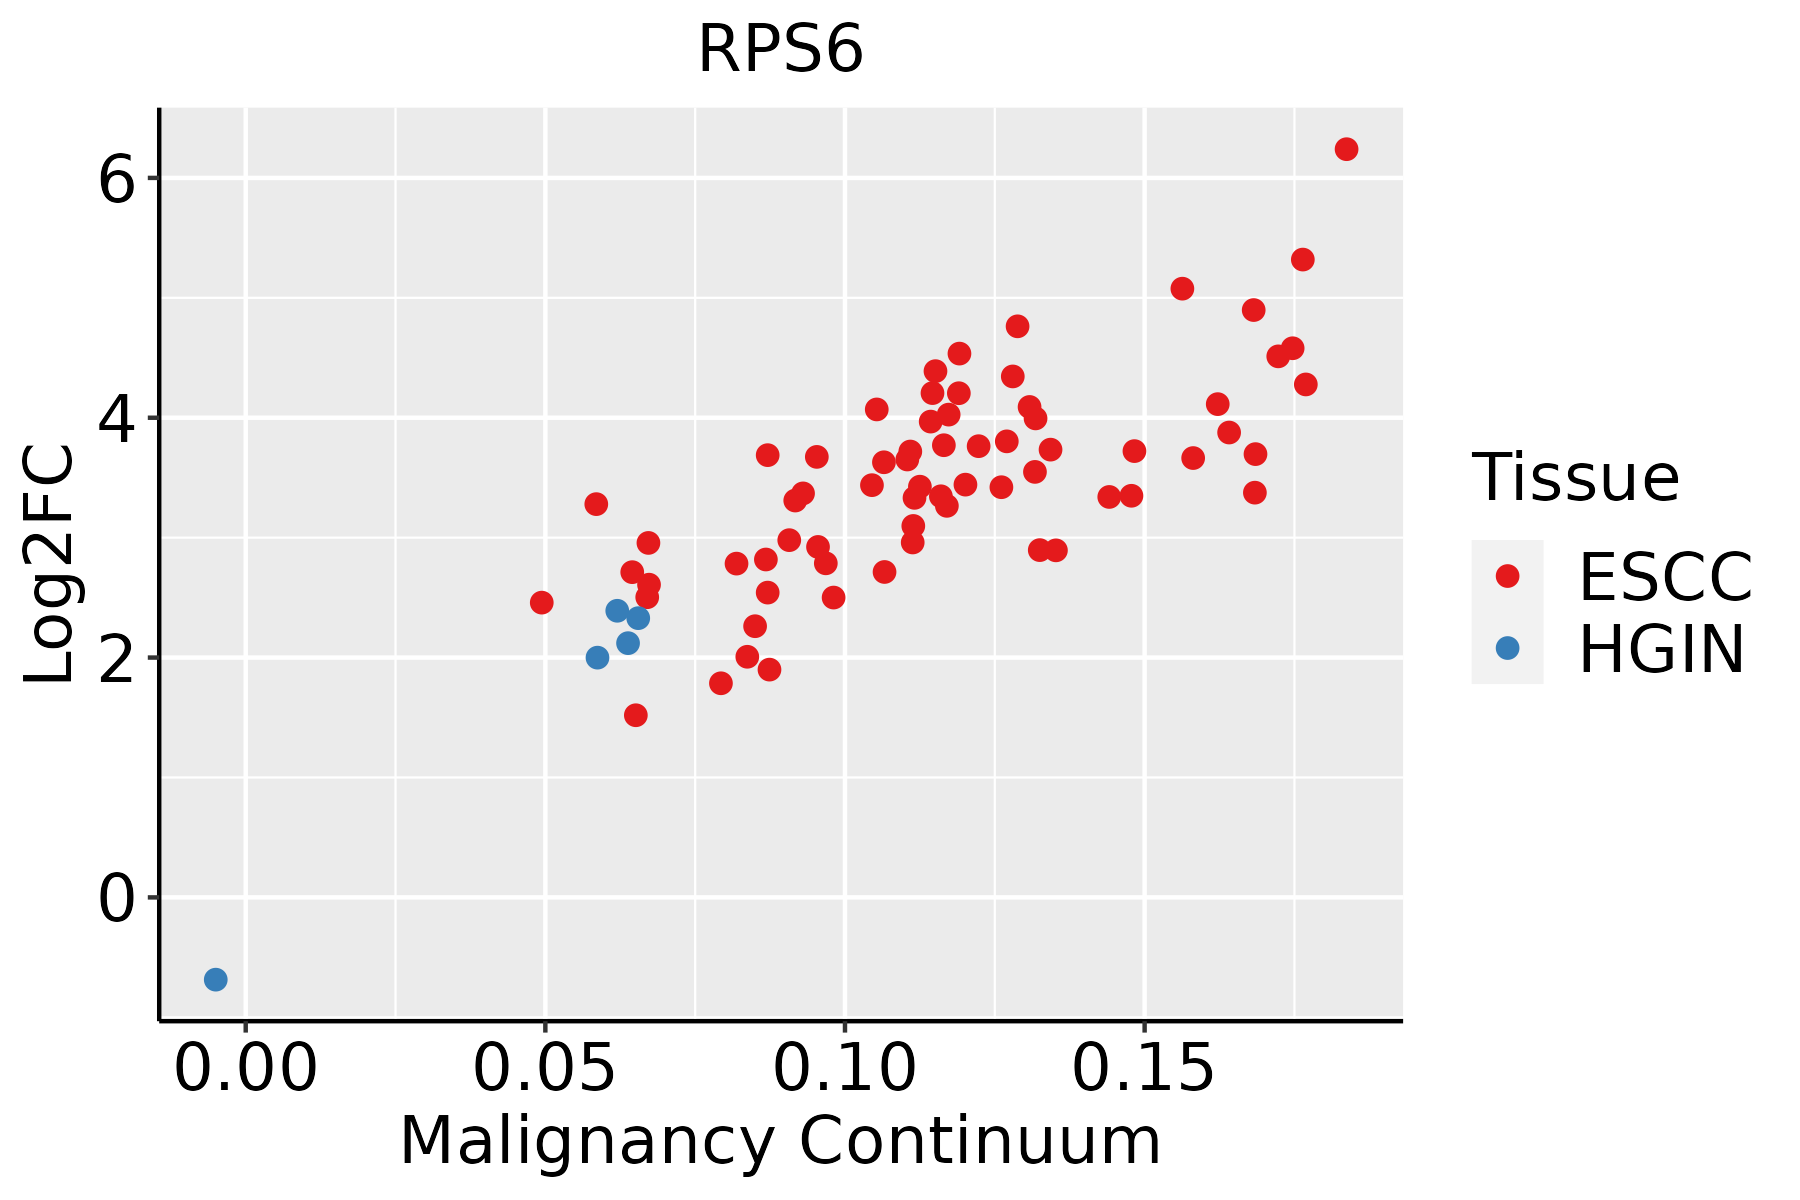 | ESCC: Esophageal squamous cell carcinoma |
| HGIN: High-grade intraepithelial neoplasias | ||
| LGIN: Low-grade intraepithelial neoplasias | ||
| GC | 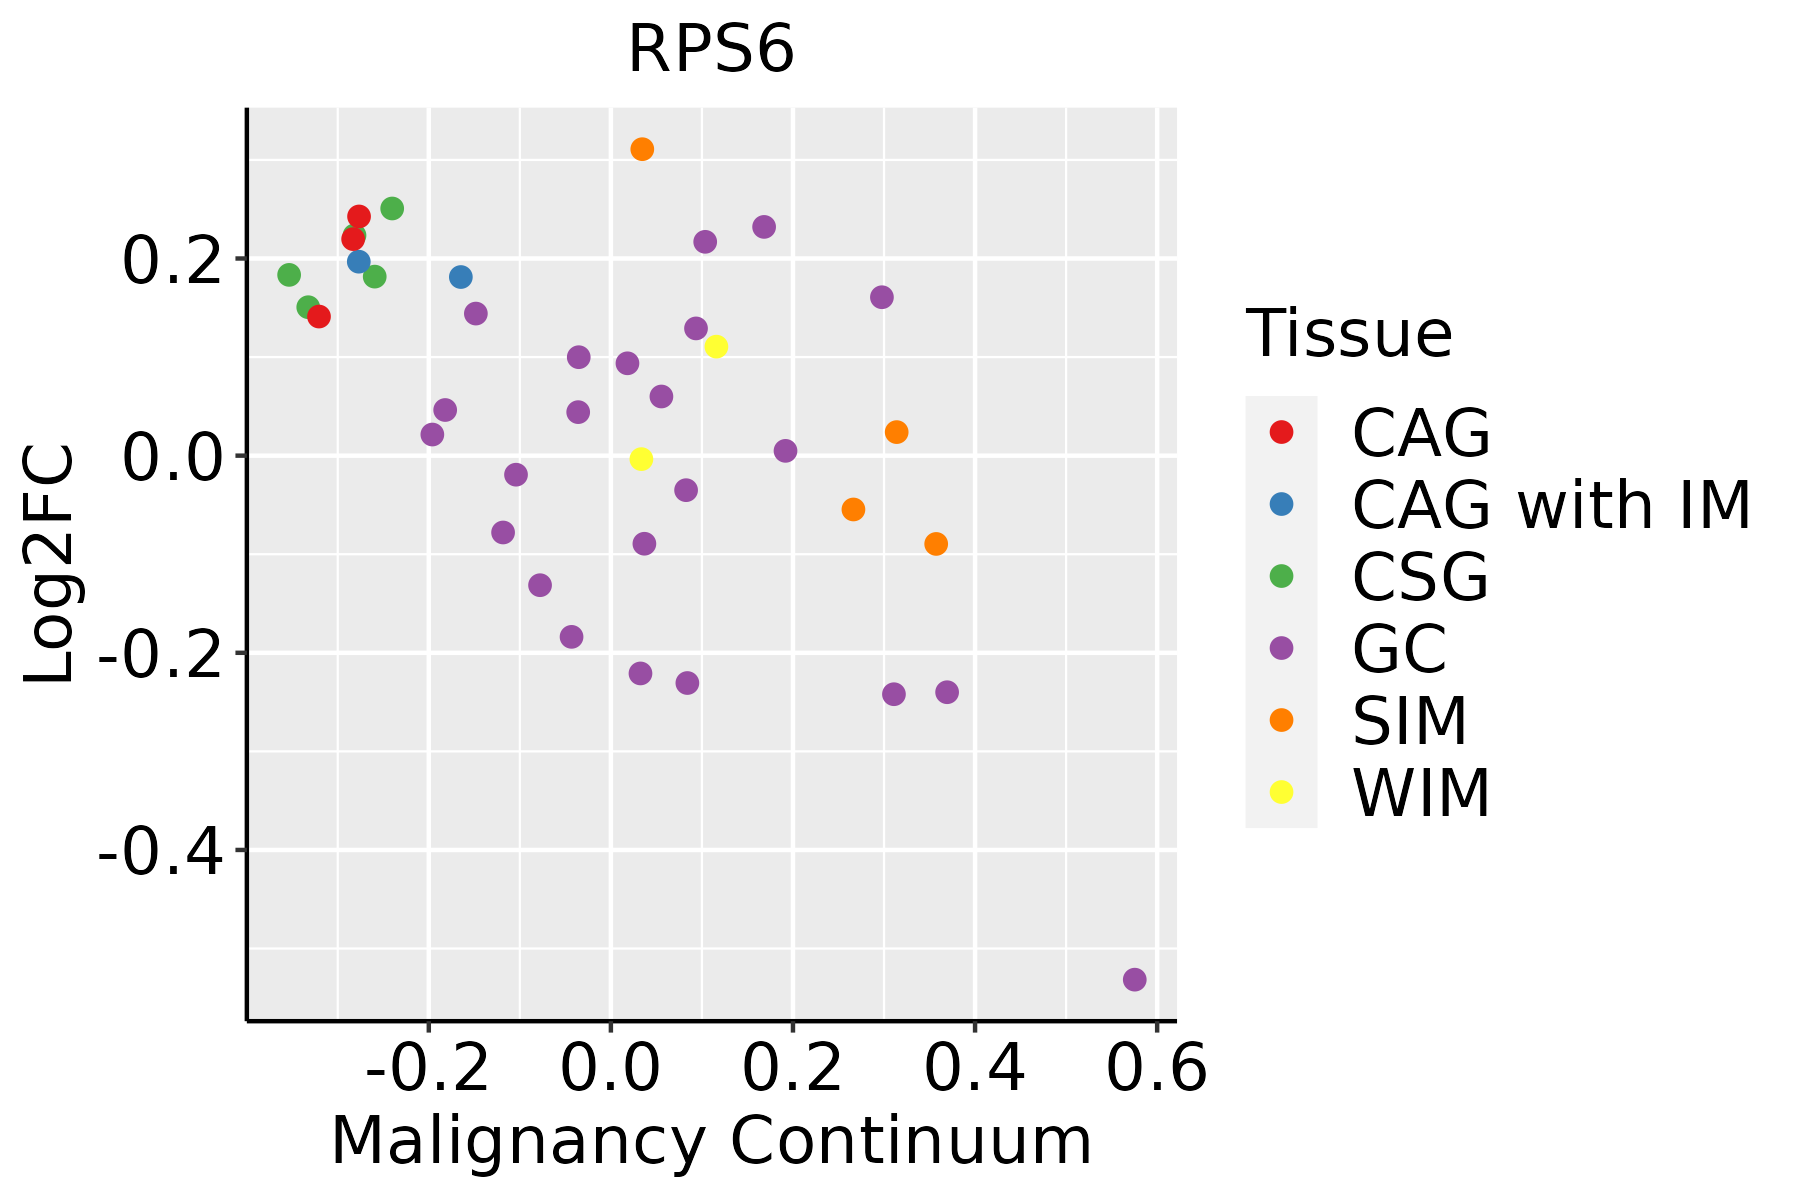 | CAG: Chronic atrophic gastritis |
| CAG with IM: Chronic atrophic gastritis with intestinal metaplasia | ||
| CSG: Chronic superficial gastritis | ||
| GC: Gastric cancer | ||
| SIM: Severe intestinal metaplasia | ||
| WIM: Wild intestinal metaplasia | ||
| Liver | 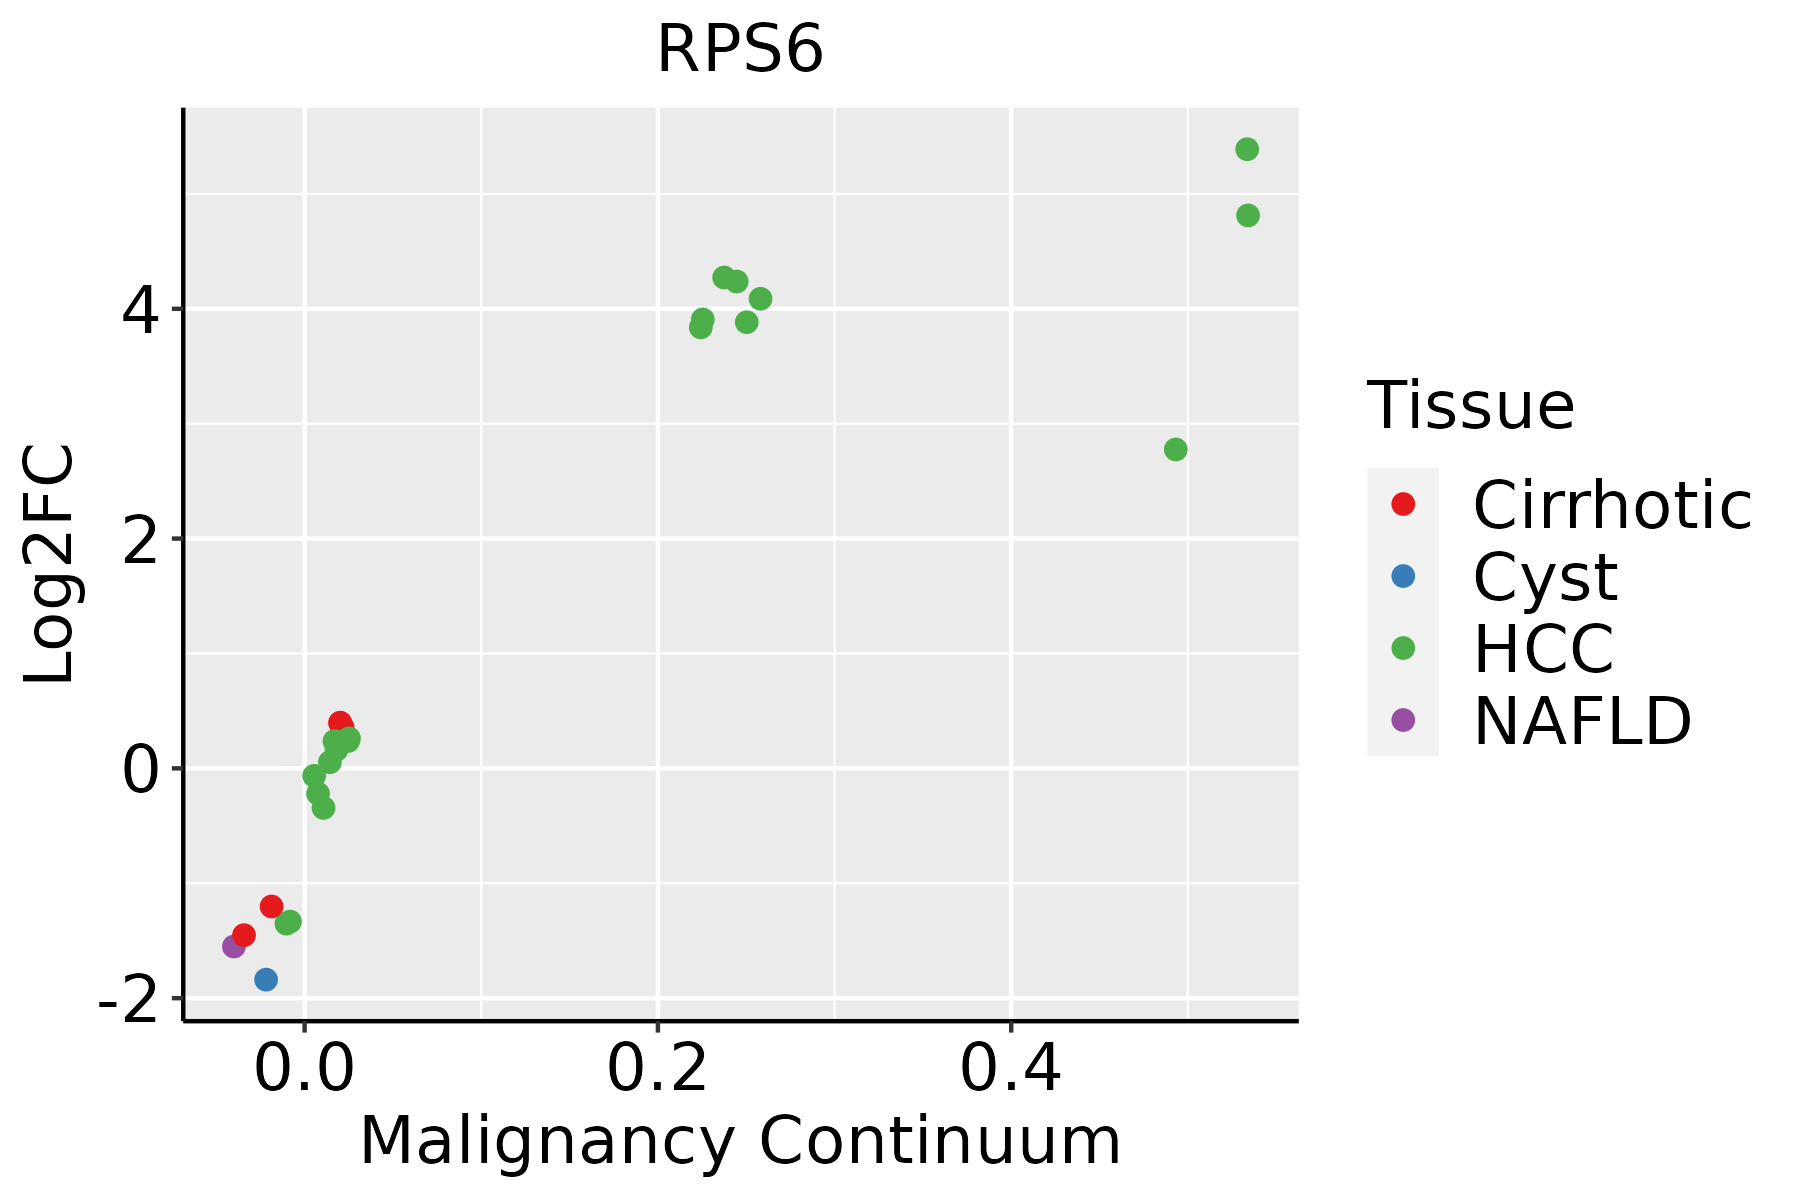 | HCC: Hepatocellular carcinoma |
| NAFLD: Non-alcoholic fatty liver disease | ||
| Lung | 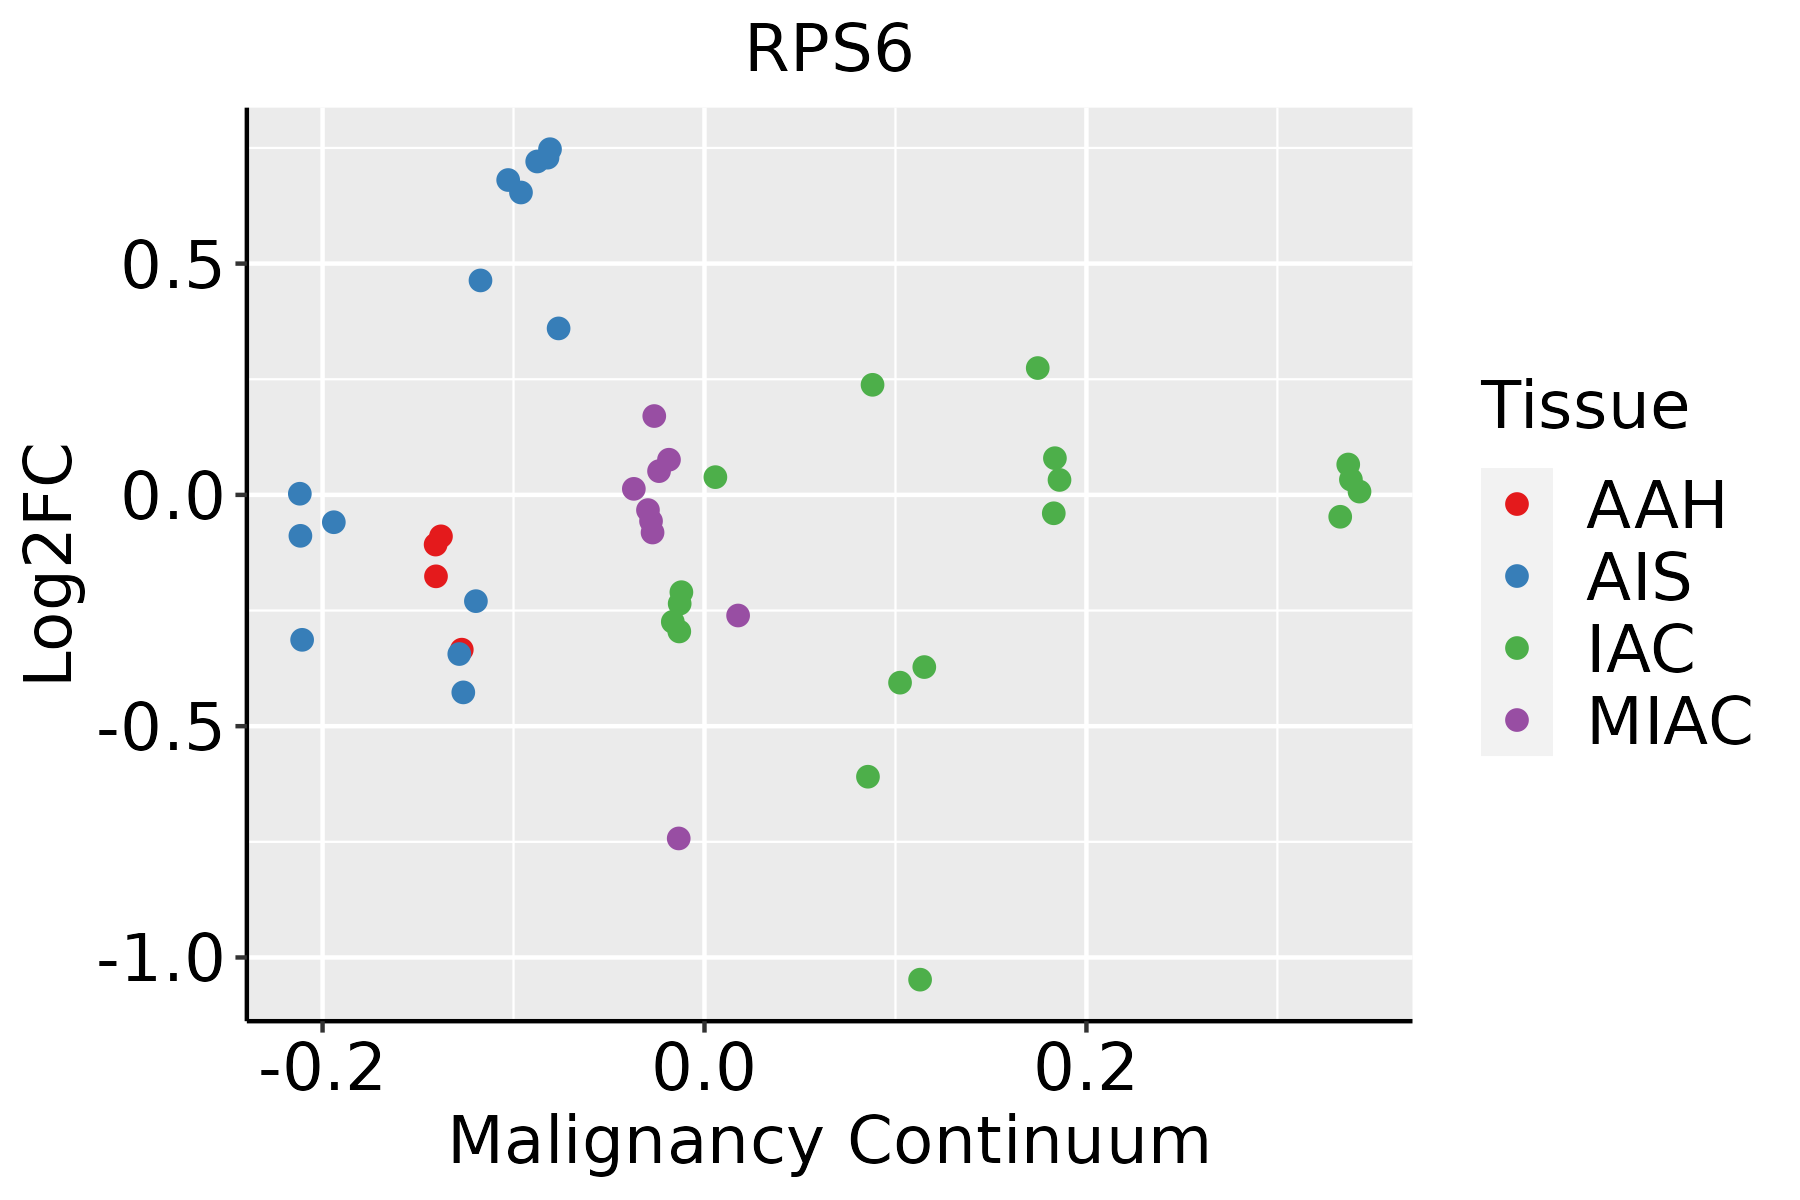 | AAH: Atypical adenomatous hyperplasia |
| AIS: Adenocarcinoma in situ | ||
| IAC: Invasive lung adenocarcinoma | ||
| MIA: Minimally invasive adenocarcinoma | ||
| Oral Cavity |  | EOLP: Erosive Oral lichen planus |
| LP: leukoplakia | ||
| NEOLP: Non-erosive oral lichen planus | ||
| OSCC: Oral squamous cell carcinoma | ||
| Prostate | 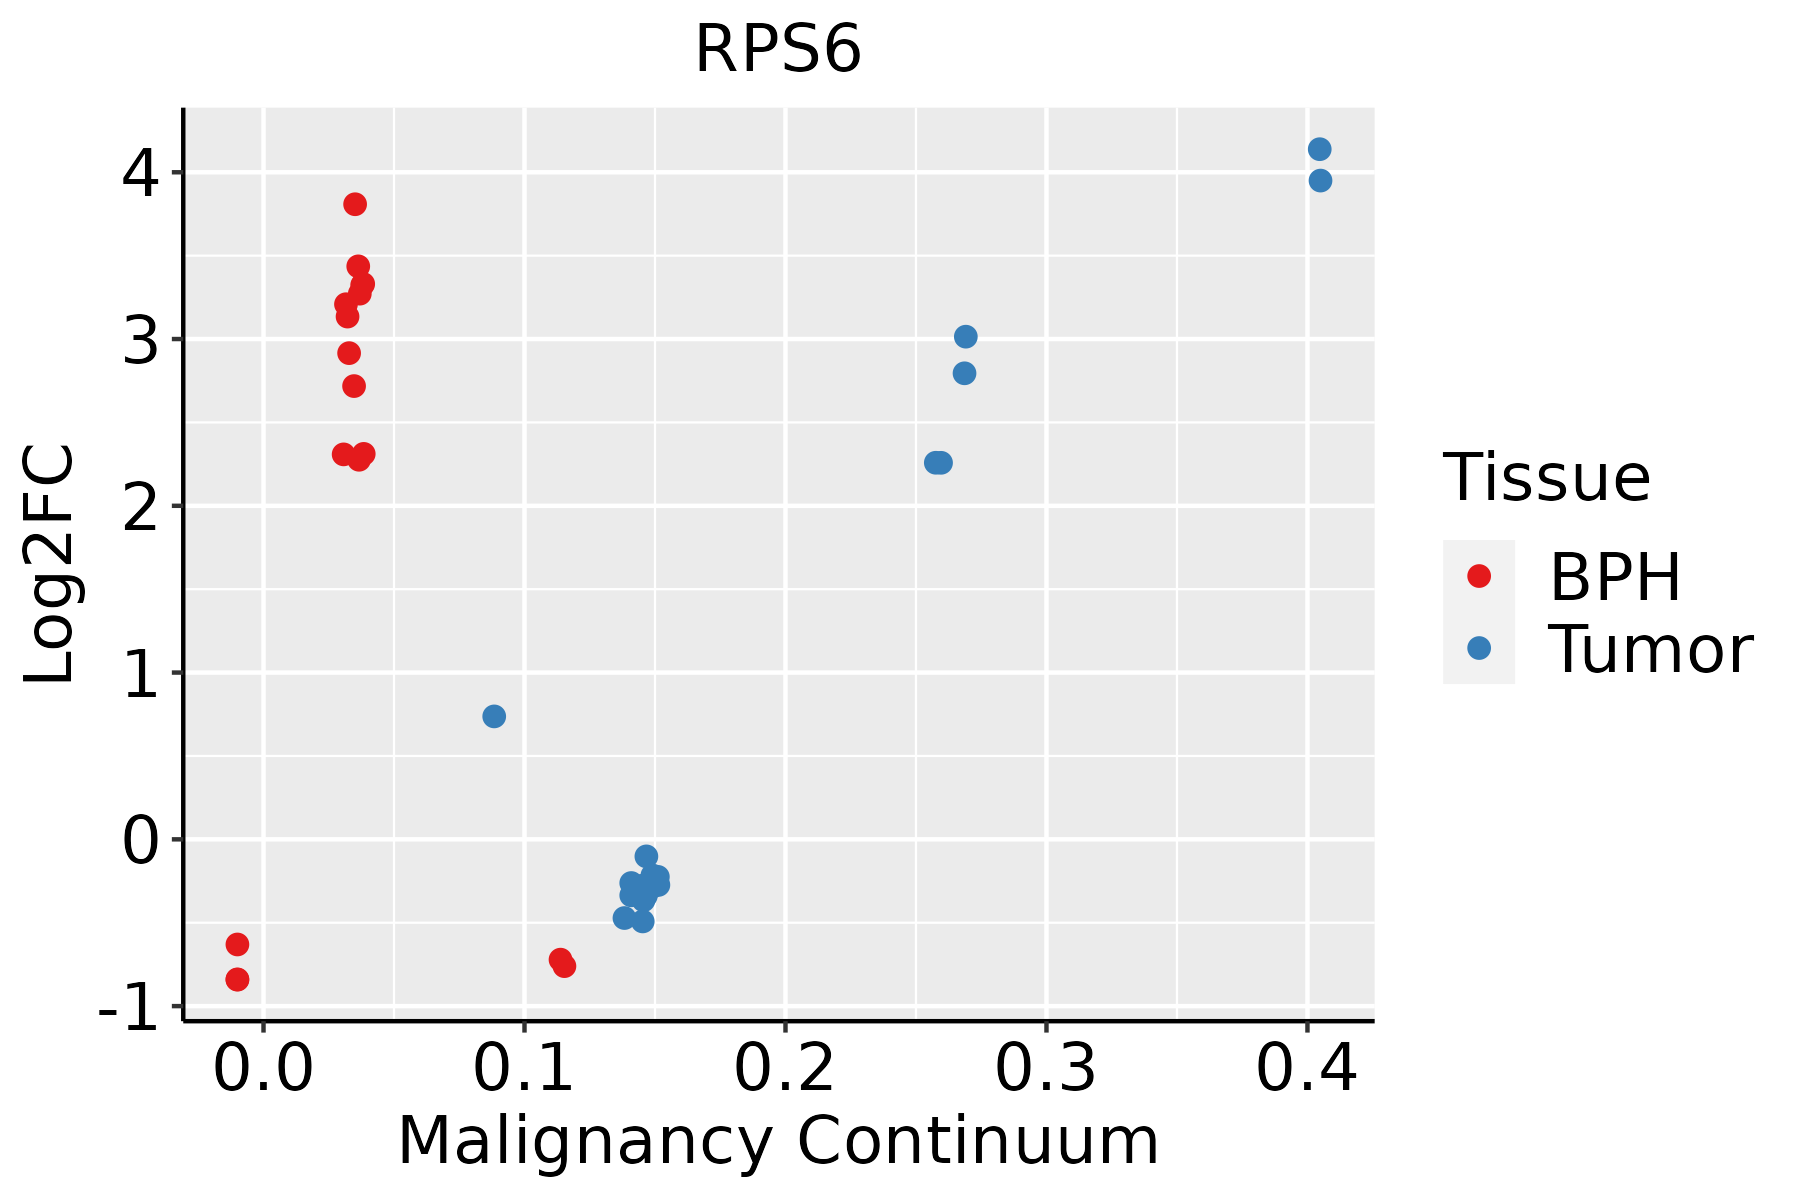 | BPH: Benign Prostatic Hyperplasia |
| Skin | 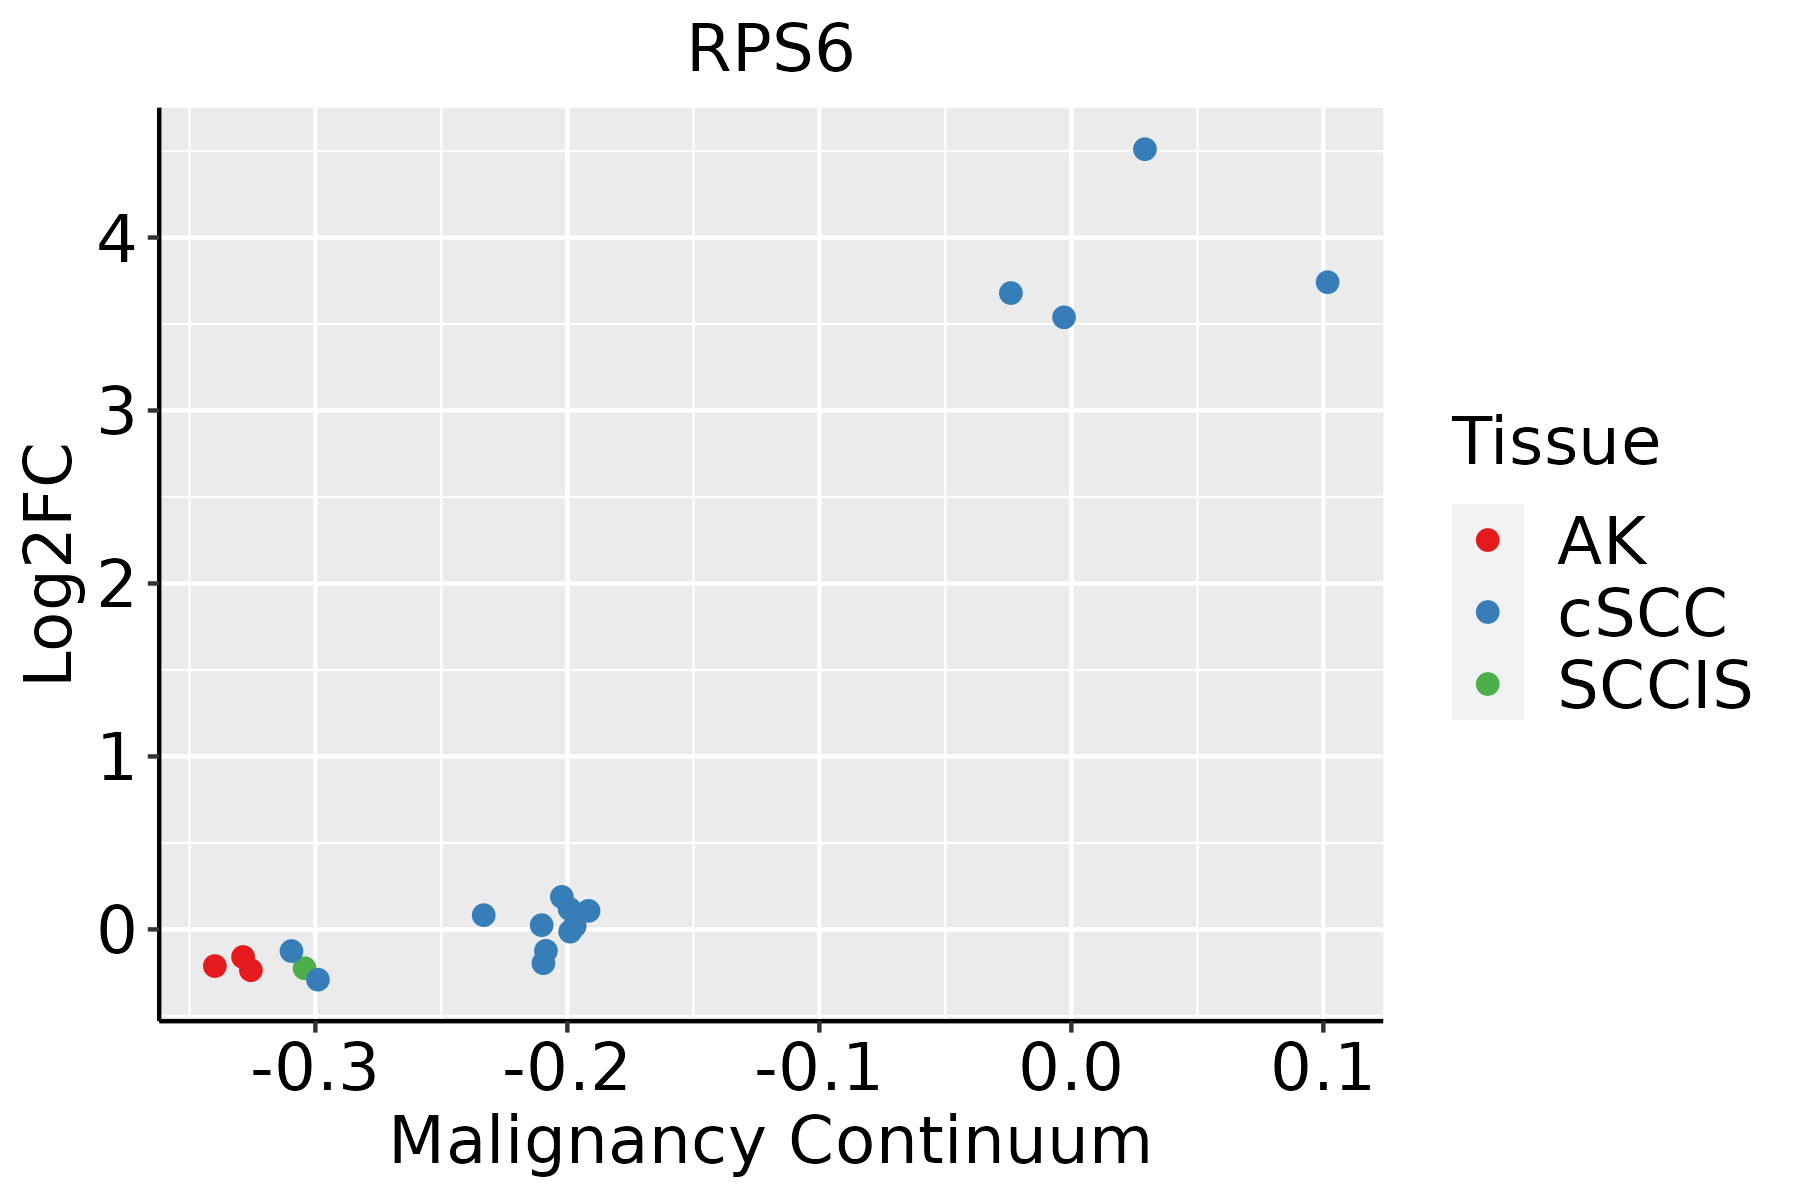 | AK: Actinic keratosis |
| cSCC: Cutaneous squamous cell carcinoma | ||
| SCCIS:squamous cell carcinoma in situ | ||
| Thyroid | 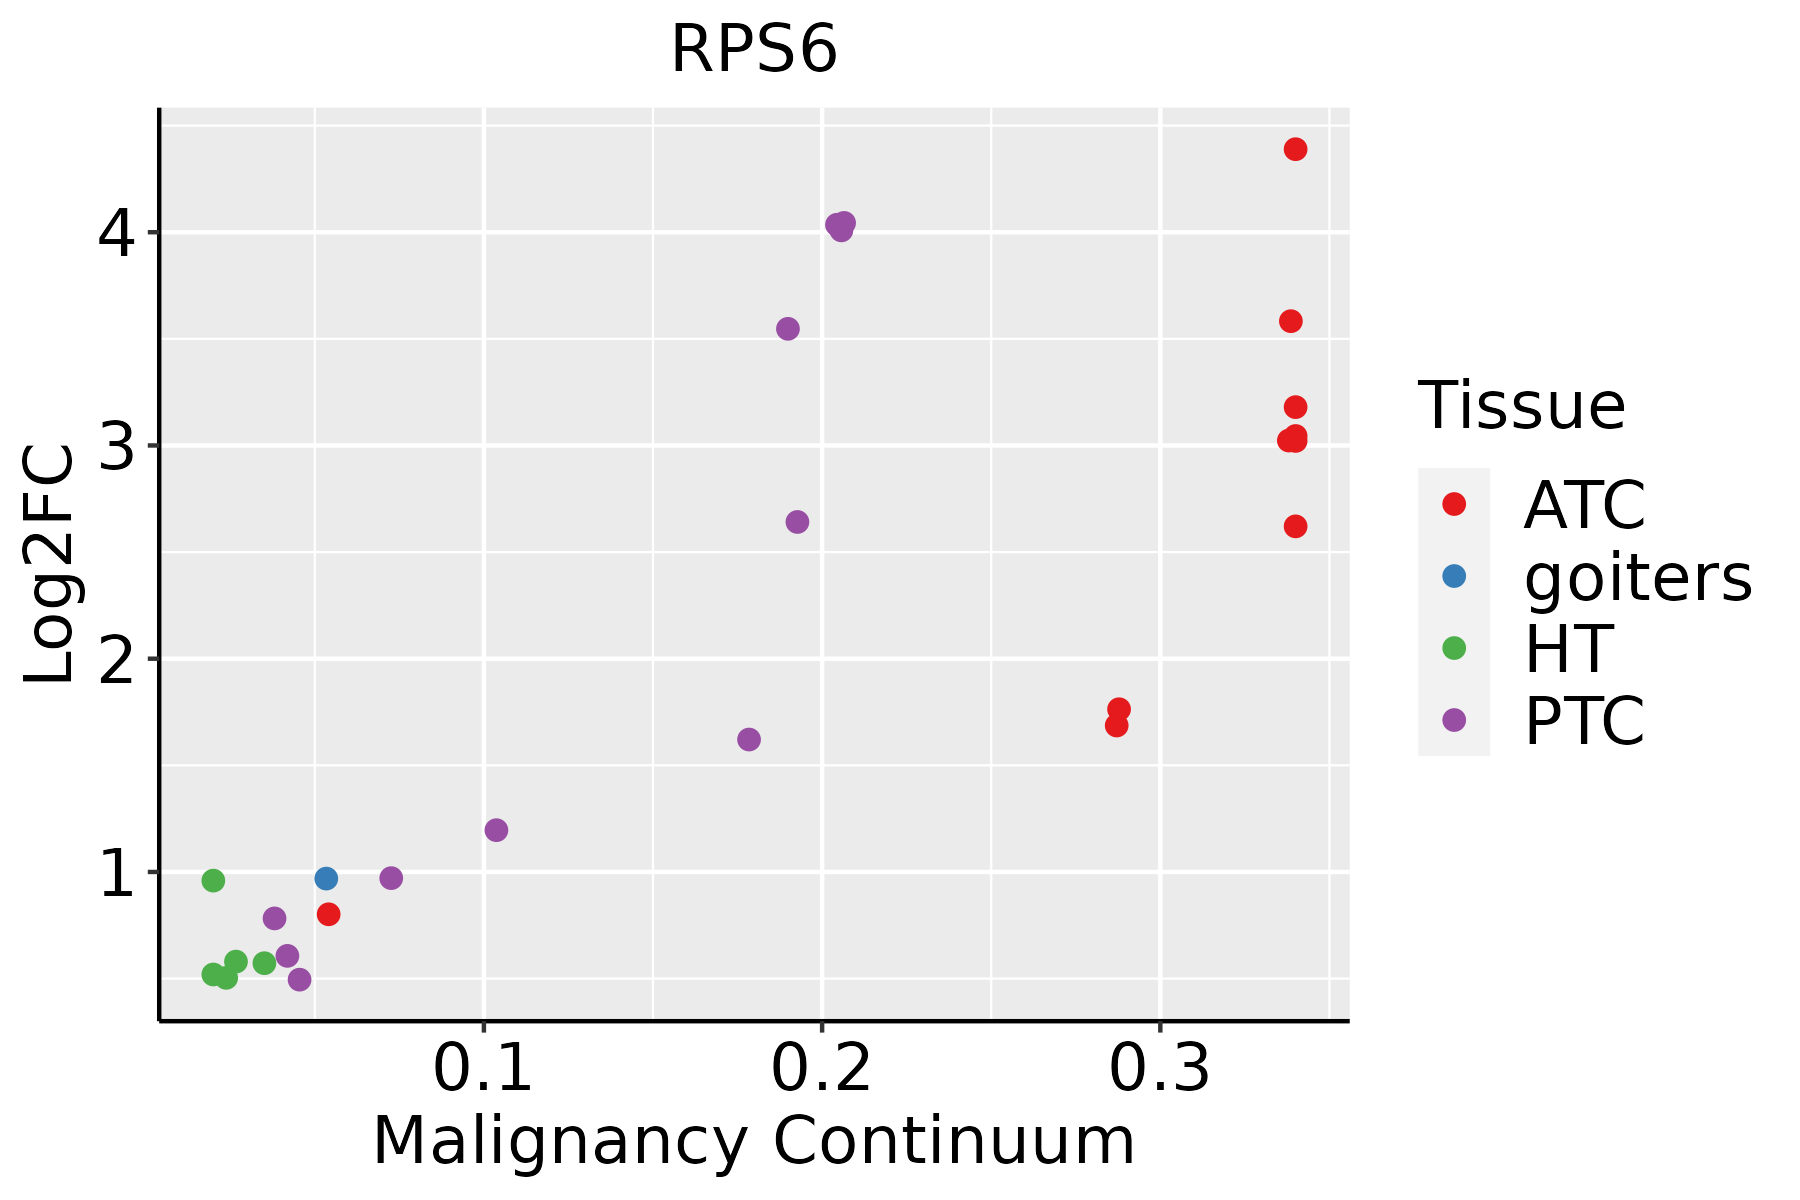 | ATC: Anaplastic thyroid cancer |
| HT: Hashimoto's thyroiditis | ||
| PTC: Papillary thyroid cancer |
| ∗log2FC in expression of this searched gene in stem-like cells from each diseased tissue sample relative to stem-like cells in normal samples in each tissue plotted against the malignancy continuum. Samples are colored based on if they are from different disease stage. |
Top |
Malignant transformation related pathway analysis |
| Find out the enriched GO biological processes and KEGG pathways involved in transition from healthy to precancer to cancer |
| Tissue | Disease Stage | Enriched GO biological Processes |
| Colorectum | AD |  |
| Colorectum | SER |  |
| Colorectum | MSS |  |
| Colorectum | MSI-H |  |
| Colorectum | FAP |  |
| ∗Top 15 enriched GO BP terms are showed in the bar plot of each disease state in each tissue. Each row represents a significant GO biological process which is colored according to the -log10(p.adjust). |
| Page: 1 2 3 4 5 6 7 8 9 |
| GO ID | Tissue | Disease Stage | Description | Gene Ratio | Bg Ratio | pvalue | p.adjust | Count |
| GO:00021819 | Breast | Precancer | cytoplasmic translation | 80/1080 | 148/18723 | 1.59e-59 | 8.54e-56 | 80 |
| GO:00226139 | Breast | Precancer | ribonucleoprotein complex biogenesis | 79/1080 | 463/18723 | 2.11e-18 | 1.03e-15 | 79 |
| GO:00422549 | Breast | Precancer | ribosome biogenesis | 52/1080 | 299/18723 | 7.35e-13 | 1.51e-10 | 52 |
| GO:00422749 | Breast | Precancer | ribosomal small subunit biogenesis | 21/1080 | 73/18723 | 4.84e-10 | 4.39e-08 | 21 |
| GO:00063646 | Breast | Precancer | rRNA processing | 35/1080 | 225/18723 | 7.90e-08 | 4.60e-06 | 35 |
| GO:00160726 | Breast | Precancer | rRNA metabolic process | 36/1080 | 236/18723 | 8.59e-08 | 4.84e-06 | 36 |
| GO:00022629 | Breast | Precancer | myeloid cell homeostasis | 27/1080 | 157/18723 | 3.10e-07 | 1.49e-05 | 27 |
| GO:00341019 | Breast | Precancer | erythrocyte homeostasis | 23/1080 | 129/18723 | 1.20e-06 | 4.60e-05 | 23 |
| GO:00300999 | Breast | Precancer | myeloid cell differentiation | 45/1080 | 381/18723 | 4.00e-06 | 1.25e-04 | 45 |
| GO:00421107 | Breast | Precancer | T cell activation | 52/1080 | 487/18723 | 1.37e-05 | 3.42e-04 | 52 |
| GO:00425938 | Breast | Precancer | glucose homeostasis | 31/1080 | 258/18723 | 8.89e-05 | 1.69e-03 | 31 |
| GO:00335008 | Breast | Precancer | carbohydrate homeostasis | 31/1080 | 259/18723 | 9.56e-05 | 1.79e-03 | 31 |
| GO:00344705 | Breast | Precancer | ncRNA processing | 42/1080 | 395/18723 | 9.91e-05 | 1.83e-03 | 42 |
| GO:00488729 | Breast | Precancer | homeostasis of number of cells | 32/1080 | 272/18723 | 1.03e-04 | 1.89e-03 | 32 |
| GO:00302189 | Breast | Precancer | erythrocyte differentiation | 18/1080 | 120/18723 | 1.76e-04 | 2.87e-03 | 18 |
| GO:00486087 | Breast | Precancer | reproductive structure development | 43/1080 | 424/18723 | 2.36e-04 | 3.56e-03 | 43 |
| GO:19031313 | Breast | Precancer | mononuclear cell differentiation | 43/1080 | 426/18723 | 2.61e-04 | 3.84e-03 | 43 |
| GO:00614587 | Breast | Precancer | reproductive system development | 43/1080 | 427/18723 | 2.75e-04 | 4.00e-03 | 43 |
| GO:00018907 | Breast | Precancer | placenta development | 19/1080 | 144/18723 | 6.26e-04 | 7.78e-03 | 19 |
| GO:00346604 | Breast | Precancer | ncRNA metabolic process | 45/1080 | 485/18723 | 1.15e-03 | 1.26e-02 | 45 |
| Page: 1 2 3 4 5 6 7 8 9 10 11 12 13 14 15 16 17 18 19 20 21 22 23 24 25 26 27 28 29 30 31 32 33 34 35 36 37 38 39 40 41 42 43 44 45 46 47 48 49 50 51 52 53 54 55 56 57 58 59 60 61 62 63 64 65 66 67 68 69 70 71 72 73 74 75 76 77 78 79 80 81 82 |
| Pathway ID | Tissue | Disease Stage | Description | Gene Ratio | Bg Ratio | pvalue | p.adjust | qvalue | Count |
| hsa0301018 | Breast | Precancer | Ribosome | 80/684 | 167/8465 | 7.33e-44 | 2.32e-41 | 1.77e-41 | 80 |
| hsa0517118 | Breast | Precancer | Coronavirus disease - COVID-19 | 81/684 | 232/8465 | 3.74e-32 | 2.36e-30 | 1.81e-30 | 81 |
| hsa0471418 | Breast | Precancer | Thermogenesis | 68/684 | 232/8465 | 4.40e-22 | 1.26e-20 | 9.69e-21 | 68 |
| hsa0406616 | Breast | Precancer | HIF-1 signaling pathway | 23/684 | 109/8465 | 1.51e-05 | 1.59e-04 | 1.22e-04 | 23 |
| hsa0520514 | Breast | Precancer | Proteoglycans in cancer | 30/684 | 205/8465 | 1.00e-03 | 7.18e-03 | 5.50e-03 | 30 |
| hsa0301019 | Breast | Precancer | Ribosome | 80/684 | 167/8465 | 7.33e-44 | 2.32e-41 | 1.77e-41 | 80 |
| hsa0517119 | Breast | Precancer | Coronavirus disease - COVID-19 | 81/684 | 232/8465 | 3.74e-32 | 2.36e-30 | 1.81e-30 | 81 |
| hsa0471419 | Breast | Precancer | Thermogenesis | 68/684 | 232/8465 | 4.40e-22 | 1.26e-20 | 9.69e-21 | 68 |
| hsa0406617 | Breast | Precancer | HIF-1 signaling pathway | 23/684 | 109/8465 | 1.51e-05 | 1.59e-04 | 1.22e-04 | 23 |
| hsa0520515 | Breast | Precancer | Proteoglycans in cancer | 30/684 | 205/8465 | 1.00e-03 | 7.18e-03 | 5.50e-03 | 30 |
| hsa0301024 | Breast | IDC | Ribosome | 83/867 | 167/8465 | 6.07e-39 | 9.87e-37 | 7.38e-37 | 83 |
| hsa0517124 | Breast | IDC | Coronavirus disease - COVID-19 | 86/867 | 232/8465 | 1.50e-28 | 9.72e-27 | 7.27e-27 | 86 |
| hsa0471424 | Breast | IDC | Thermogenesis | 75/867 | 232/8465 | 8.41e-21 | 3.04e-19 | 2.27e-19 | 75 |
| hsa0520523 | Breast | IDC | Proteoglycans in cancer | 42/867 | 205/8465 | 7.69e-06 | 9.99e-05 | 7.48e-05 | 42 |
| hsa0406623 | Breast | IDC | HIF-1 signaling pathway | 22/867 | 109/8465 | 1.36e-03 | 1.00e-02 | 7.50e-03 | 22 |
| hsa0301034 | Breast | IDC | Ribosome | 83/867 | 167/8465 | 6.07e-39 | 9.87e-37 | 7.38e-37 | 83 |
| hsa0517134 | Breast | IDC | Coronavirus disease - COVID-19 | 86/867 | 232/8465 | 1.50e-28 | 9.72e-27 | 7.27e-27 | 86 |
| hsa0471434 | Breast | IDC | Thermogenesis | 75/867 | 232/8465 | 8.41e-21 | 3.04e-19 | 2.27e-19 | 75 |
| hsa0520533 | Breast | IDC | Proteoglycans in cancer | 42/867 | 205/8465 | 7.69e-06 | 9.99e-05 | 7.48e-05 | 42 |
| hsa0406633 | Breast | IDC | HIF-1 signaling pathway | 22/867 | 109/8465 | 1.36e-03 | 1.00e-02 | 7.50e-03 | 22 |
| Page: 1 2 3 4 5 6 7 8 9 10 11 12 13 14 15 16 17 18 19 |
Top |
Cell-cell communication analysis |
| Identification of potential cell-cell interactions between two cell types and their ligand-receptor pairs for different disease states |
| Ligand | Receptor | LRpair | Pathway | Tissue | Disease Stage |
| Page: 1 |
Top |
Single-cell gene regulatory network inference analysis |
| Find out the significant the regulons (TFs) and the target genes of each regulon across cell types for different disease states |
| TF | Cell Type | Tissue | Disease Stage | Target Gene | RSS | Regulon Activity |
| ∗The dot plots of a searched regulon are shown for all cell subpopulations in each disease state of each tissue based on the regulon specific score inferred using pySCENIC and by calculating the average expression. |
| Page: 1 |
Top |
Somatic mutation of malignant transformation related genes |
| Annotation of somatic variants for genes involved in malignant transformation |
| Hugo Symbol | Variant Class | Variant Classification | dbSNP RS | HGVSc | HGVSp | HGVSp Short | SWISSPROT | BIOTYPE | SIFT | PolyPhen | Tumor Sample Barcode | Tissue | Histology | Sex | Age | Stage | Therapy Types | Drugs | Outcome |
| RPS6 | SNV | Missense_Mutation | novel | c.707N>T | p.Ser236Phe | p.S236F | P62753 | protein_coding | tolerated(0.06) | possibly_damaging(0.485) | TCGA-5L-AAT1-01 | Breast | breast invasive carcinoma | Female | <65 | III/IV | Hormone Therapy | letrozol | SD |
| RPS6 | SNV | Missense_Mutation | c.416G>A | p.Ser139Asn | p.S139N | P62753 | protein_coding | tolerated(0.23) | benign(0.071) | TCGA-A8-A09Z-01 | Breast | breast invasive carcinoma | Female | >=65 | I/II | Unknown | Unknown | SD | |
| RPS6 | SNV | Missense_Mutation | c.279N>C | p.Lys93Asn | p.K93N | P62753 | protein_coding | deleterious(0.01) | benign(0.425) | TCGA-C8-A12P-01 | Breast | breast invasive carcinoma | Female | <65 | I/II | Unknown | Unknown | SD | |
| RPS6 | SNV | Missense_Mutation | rs767919541 | c.7N>G | p.Leu3Val | p.L3V | P62753 | protein_coding | deleterious(0.03) | benign(0.422) | TCGA-EW-A6SD-01 | Breast | breast invasive carcinoma | Female | <65 | I/II | Chemotherapy | tch | SD |
| RPS6 | SNV | Missense_Mutation | novel | c.707C>G | p.Ser236Cys | p.S236C | P62753 | protein_coding | deleterious(0.03) | possibly_damaging(0.7) | TCGA-OL-A5RW-01 | Breast | breast invasive carcinoma | Female | <65 | I/II | Chemotherapy | adriamycin | CR |
| RPS6 | SNV | Missense_Mutation | c.571N>T | p.Arg191Cys | p.R191C | P62753 | protein_coding | tolerated(0.22) | benign(0.022) | TCGA-2W-A8YY-01 | Cervix | cervical & endocervical cancer | Female | <65 | I/II | Chemotherapy | cisplatin | CR | |
| RPS6 | SNV | Missense_Mutation | c.686N>T | p.Ala229Val | p.A229V | P62753 | protein_coding | tolerated(0.11) | possibly_damaging(0.499) | TCGA-AA-3811-01 | Colorectum | colon adenocarcinoma | Female | >=65 | III/IV | Unknown | Unknown | PD | |
| RPS6 | SNV | Missense_Mutation | c.571C>T | p.Arg191Cys | p.R191C | P62753 | protein_coding | tolerated(0.22) | benign(0.022) | TCGA-D5-6930-01 | Colorectum | colon adenocarcinoma | Male | >=65 | I/II | Unknown | Unknown | SD | |
| RPS6 | SNV | Missense_Mutation | rs756253114 | c.574A>G | p.Ile192Val | p.I192V | P62753 | protein_coding | tolerated(0.13) | benign(0.009) | TCGA-G4-6588-01 | Colorectum | colon adenocarcinoma | Female | <65 | I/II | Unknown | Unknown | SD |
| RPS6 | SNV | Missense_Mutation | rs778272571 | c.380N>A | p.Thr127Asn | p.T127N | P62753 | protein_coding | tolerated(0.13) | benign(0.02) | TCGA-DY-A1DD-01 | Colorectum | rectum adenocarcinoma | Female | >=65 | III/IV | Unknown | Unknown | SD |
| Page: 1 2 3 4 |
Top |
Related drugs of malignant transformation related genes |
| Identification of chemicals and drugs interact with genes involved in malignant transfromation |
| (DGIdb 4.0) |
| Entrez ID | Symbol | Category | Interaction Types | Drug Claim Name | Drug Name | PMIDs |
| Page: 1 |

Copyright 2023-Present -The University of Texas Health Science Center at Houston |