
|
|||||
|
 | |
| |
| |
| |
| |
| |
|
Gene: RPS4Y1 |
Gene summary for RPS4Y1 |
| Gene information | Species | Human | Gene symbol | RPS4Y1 | Gene ID | 6192 |
| Gene name | ribosomal protein S4 Y-linked 1 | |
| Gene Alias | RPS4Y | |
| Cytomap | Yp11.2 | |
| Gene Type | protein-coding | GO ID | GO:0006412 | UniProtAcc | P22090 |
Top |
Malignant transformation analysis |
| Identification of the aberrant gene expression in precancerous and cancerous lesions by comparing the gene expression of stem-like cells in diseased tissues with normal stem cells |
| Entrez ID | Symbol | Replicates | Species | Organ | Tissue | Adj P-value | Log2FC | Malignancy |
| 6192 | RPS4Y1 | GSM4909319 | Human | Breast | IDC | 7.71e-11 | 5.60e-01 | 0.1563 |
| 6192 | RPS4Y1 | GSM4909320 | Human | Breast | IDC | 2.92e-12 | 5.91e-01 | 0.1575 |
| 6192 | RPS4Y1 | GSM4909321 | Human | Breast | IDC | 7.23e-34 | 8.04e-01 | 0.1559 |
| 6192 | RPS4Y1 | HTA11_347_2000001011 | Human | Colorectum | AD | 1.72e-10 | -3.07e-01 | -0.1954 |
| 6192 | RPS4Y1 | HTA11_3361_2000001011 | Human | Colorectum | AD | 8.65e-05 | 5.46e-01 | -0.1207 |
| 6192 | RPS4Y1 | HTA11_83_2000001011 | Human | Colorectum | SER | 9.99e-03 | 5.45e-01 | -0.1526 |
| 6192 | RPS4Y1 | HTA11_696_2000001011 | Human | Colorectum | AD | 3.79e-16 | 6.64e-01 | -0.1464 |
| 6192 | RPS4Y1 | HTA11_866_2000001011 | Human | Colorectum | AD | 9.42e-04 | 4.11e-01 | -0.1001 |
| 6192 | RPS4Y1 | HTA11_1391_2000001011 | Human | Colorectum | AD | 5.54e-14 | 9.07e-01 | -0.059 |
| 6192 | RPS4Y1 | HTA11_2992_2000001011 | Human | Colorectum | SER | 1.03e-03 | 7.22e-01 | -0.1706 |
| 6192 | RPS4Y1 | HTA11_7862_2000001011 | Human | Colorectum | AD | 1.10e-05 | 6.39e-01 | -0.0179 |
| 6192 | RPS4Y1 | HTA11_866_3004761011 | Human | Colorectum | AD | 2.39e-54 | 1.41e+00 | 0.096 |
| 6192 | RPS4Y1 | HTA11_4255_2000001011 | Human | Colorectum | SER | 1.05e-11 | 1.31e+00 | 0.0446 |
| 6192 | RPS4Y1 | HTA11_7663_2000001011 | Human | Colorectum | SER | 2.26e-12 | 1.05e+00 | 0.0131 |
| 6192 | RPS4Y1 | HTA11_10623_2000001011 | Human | Colorectum | AD | 1.08e-05 | 6.48e-01 | -0.0177 |
| 6192 | RPS4Y1 | HTA11_6801_2000001011 | Human | Colorectum | SER | 2.28e-12 | 1.28e+00 | 0.0171 |
| 6192 | RPS4Y1 | HTA11_10711_2000001011 | Human | Colorectum | AD | 2.34e-04 | -3.07e-01 | 0.0338 |
| 6192 | RPS4Y1 | HTA11_7696_3000711011 | Human | Colorectum | AD | 5.77e-21 | 8.51e-01 | 0.0674 |
| 6192 | RPS4Y1 | HTA11_6818_2000001021 | Human | Colorectum | AD | 5.29e-23 | 1.31e+00 | 0.0588 |
| 6192 | RPS4Y1 | HTA11_99999970781_79442 | Human | Colorectum | MSS | 1.57e-33 | 1.17e+00 | 0.294 |
| Page: 1 2 3 4 5 6 7 8 9 10 11 12 13 |
| Tissue | Expression Dynamics | Abbreviation |
| Breast | 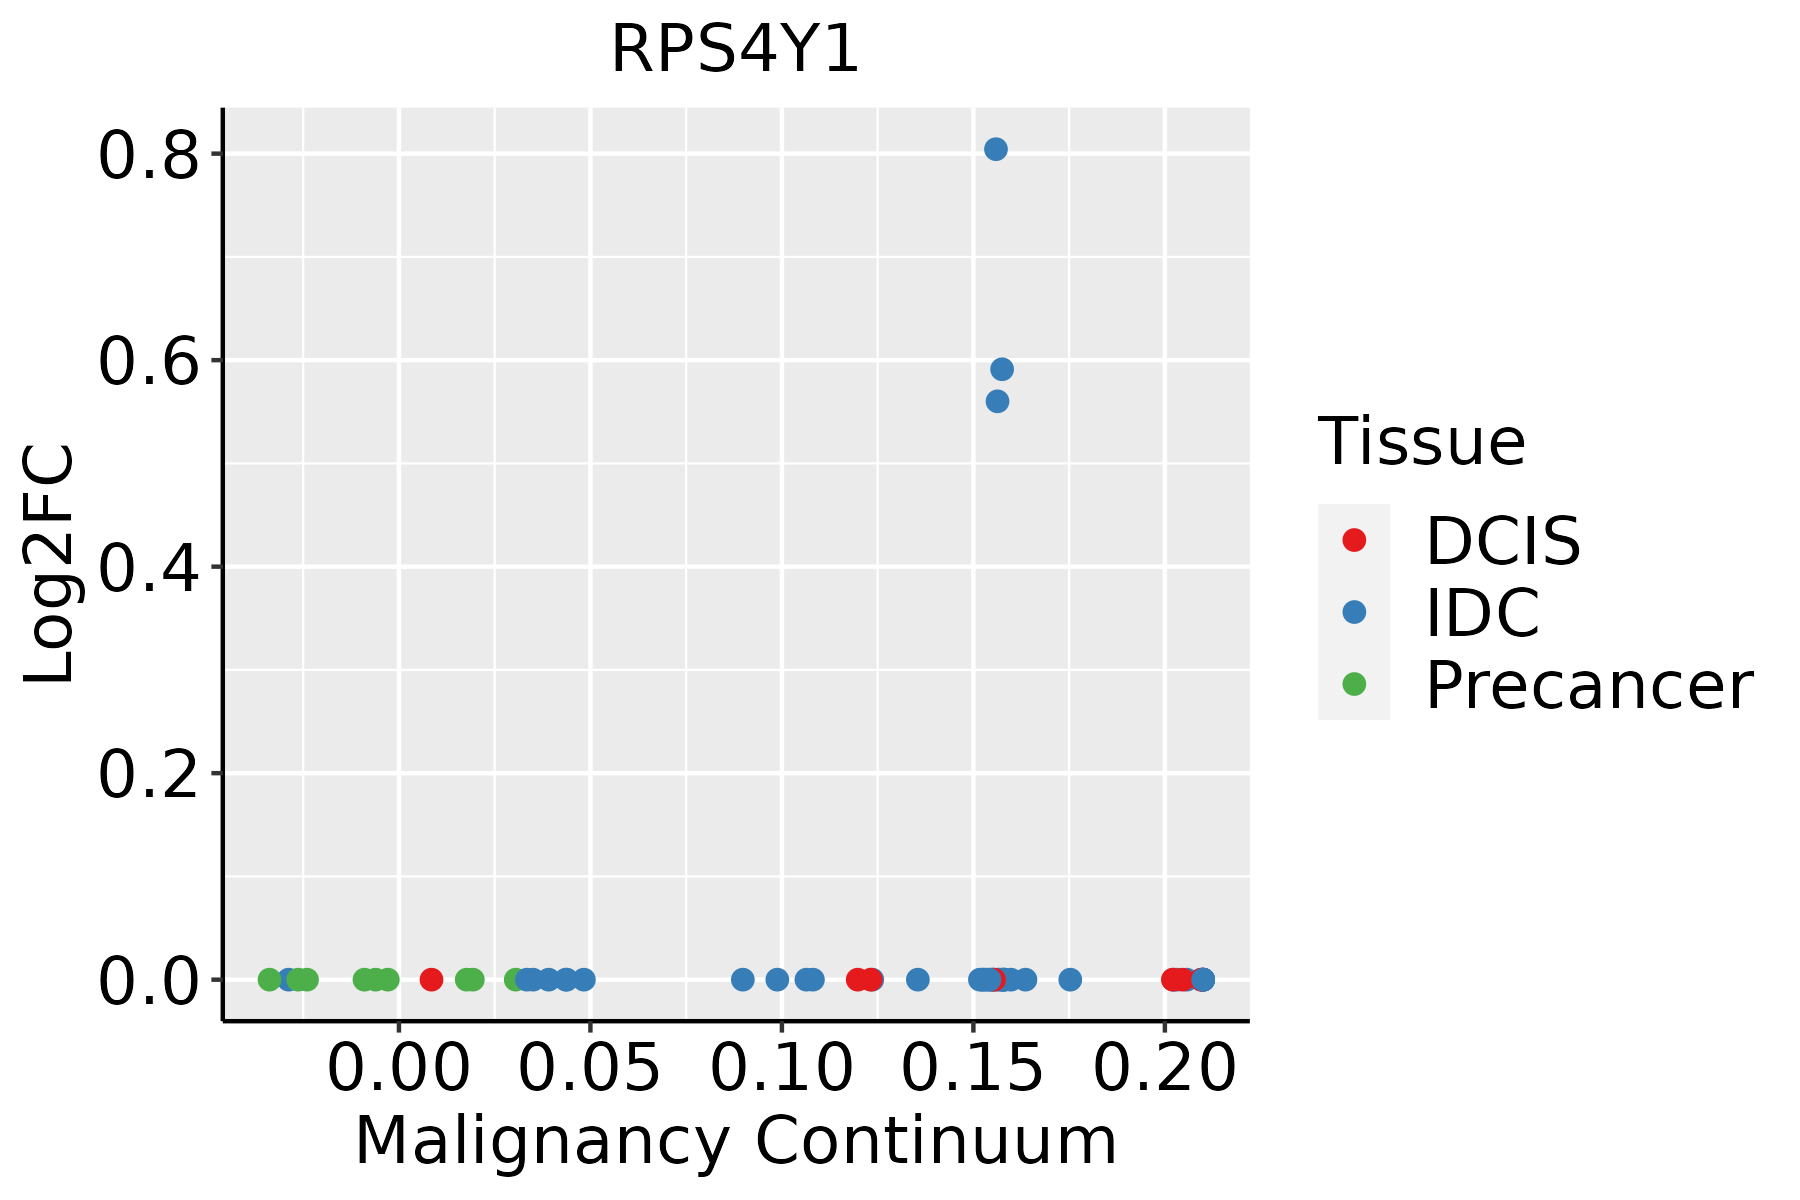 | IDC: Invasive ductal carcinoma |
| DCIS: Ductal carcinoma in situ | ||
| Precancer(BRCA1-mut): Precancerous lesion from BRCA1 mutation carriers | ||
| Colorectum (GSE201348) |  | FAP: Familial adenomatous polyposis |
| CRC: Colorectal cancer | ||
| Colorectum (HTA11) |  | AD: Adenomas |
| SER: Sessile serrated lesions | ||
| MSI-H: Microsatellite-high colorectal cancer | ||
| MSS: Microsatellite stable colorectal cancer | ||
| Esophagus | 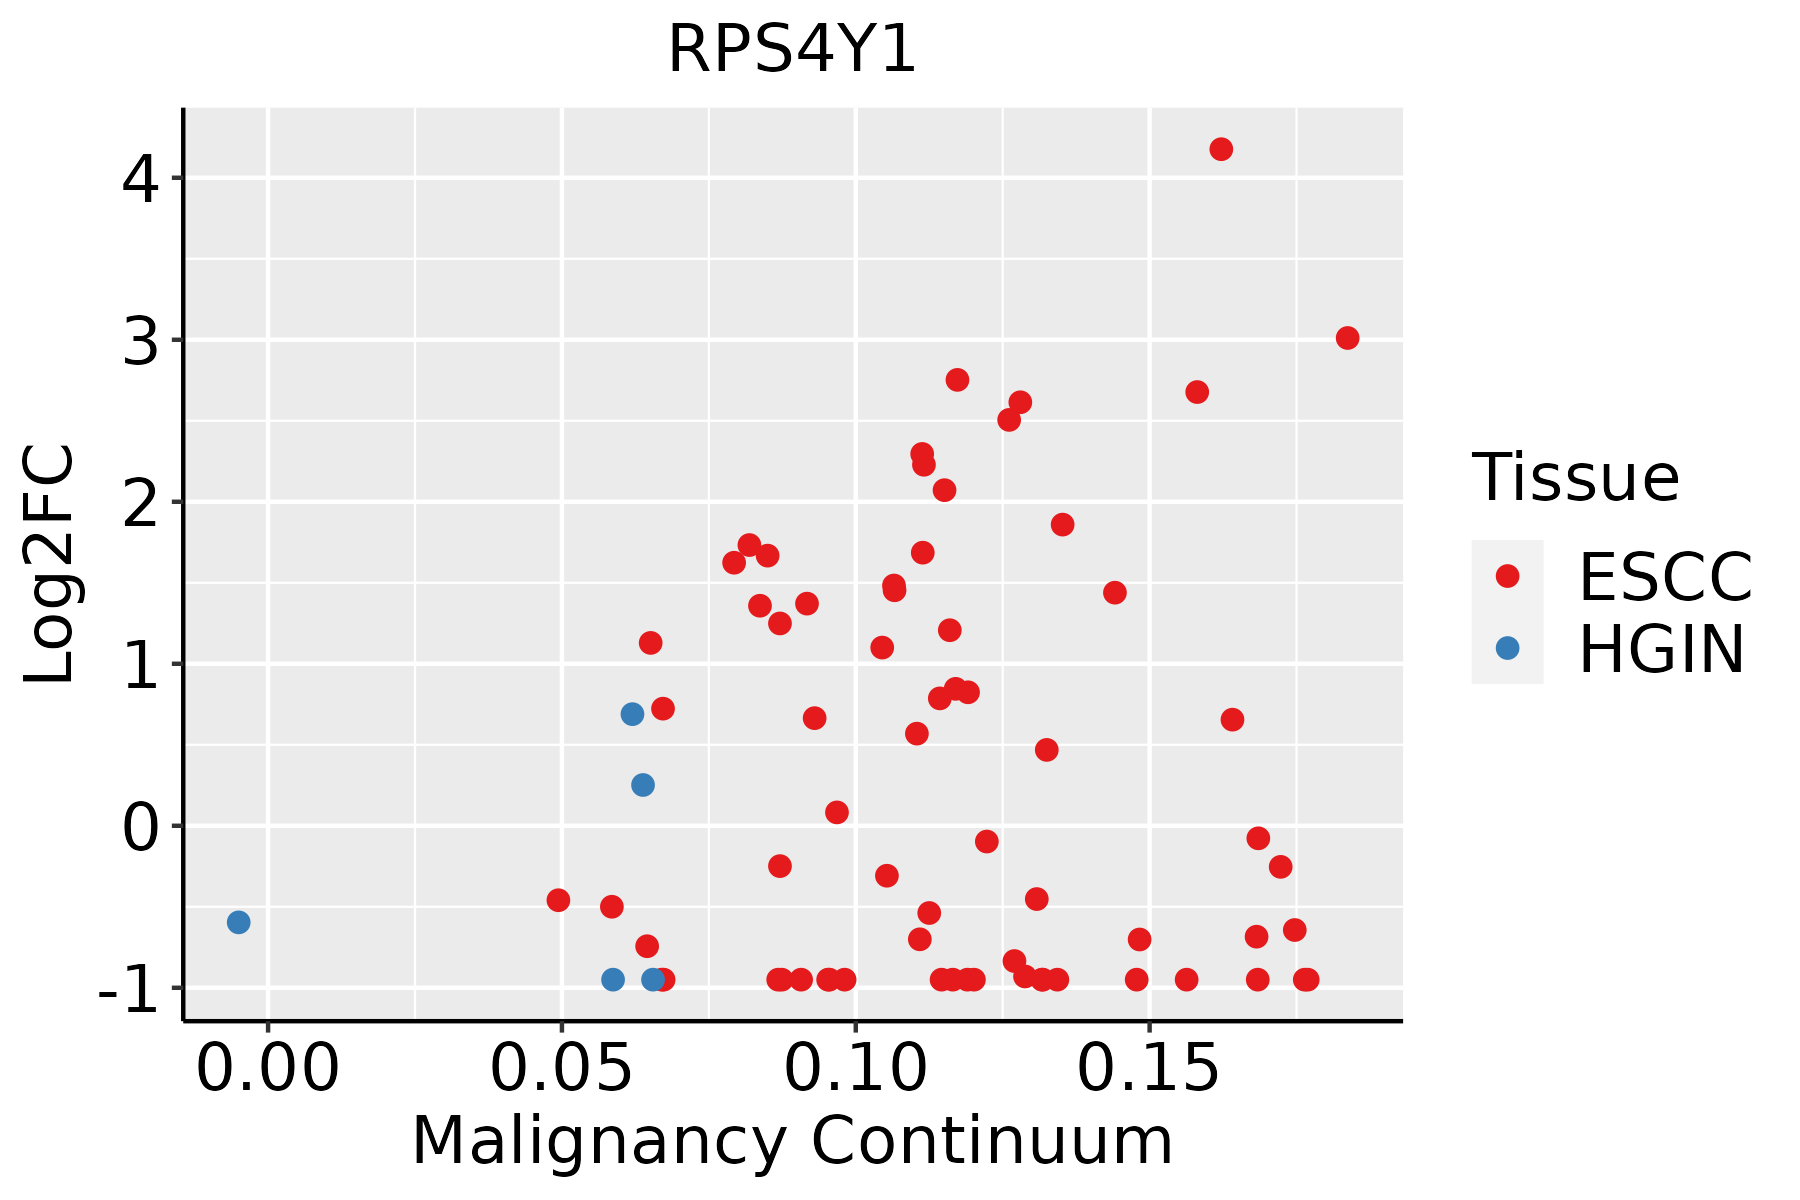 | ESCC: Esophageal squamous cell carcinoma |
| HGIN: High-grade intraepithelial neoplasias | ||
| LGIN: Low-grade intraepithelial neoplasias | ||
| GC | 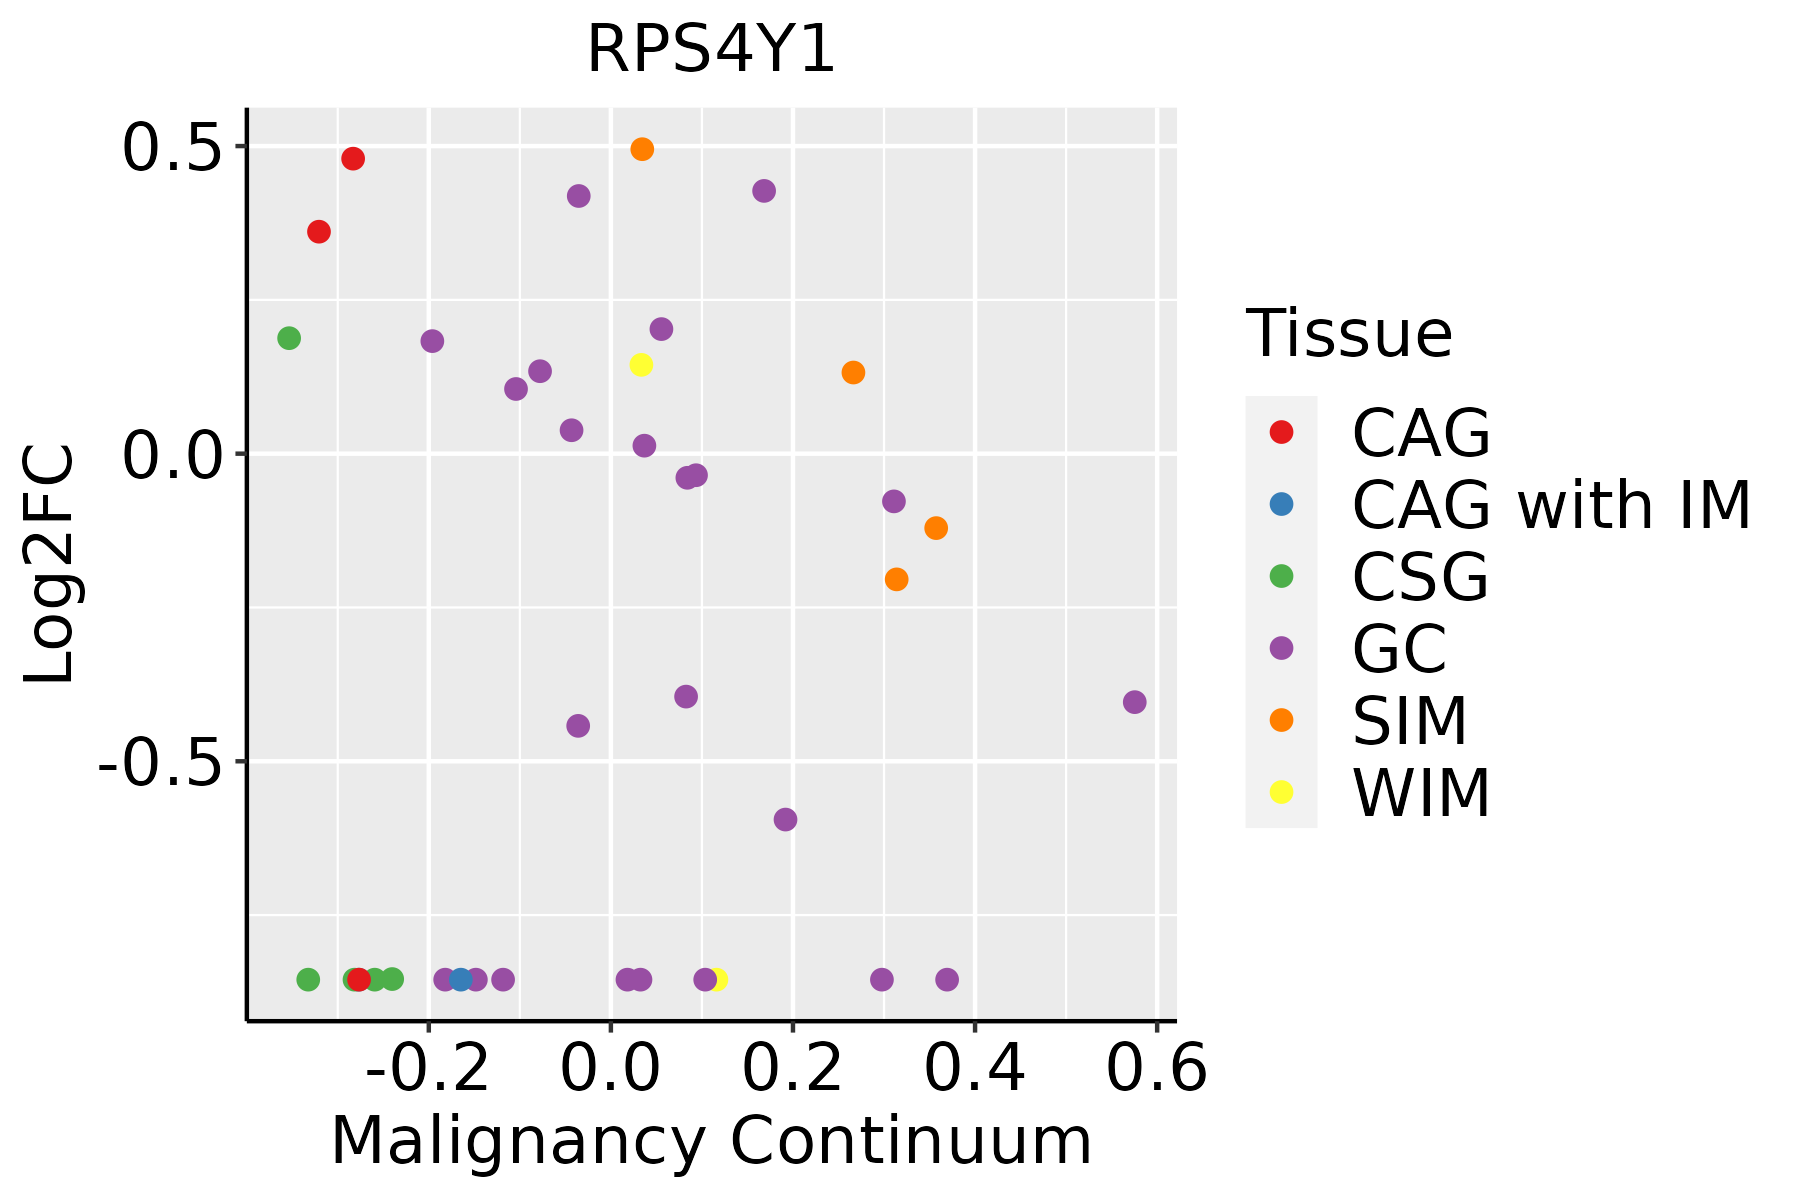 | CAG: Chronic atrophic gastritis |
| CAG with IM: Chronic atrophic gastritis with intestinal metaplasia | ||
| CSG: Chronic superficial gastritis | ||
| GC: Gastric cancer | ||
| SIM: Severe intestinal metaplasia | ||
| WIM: Wild intestinal metaplasia | ||
| Liver | 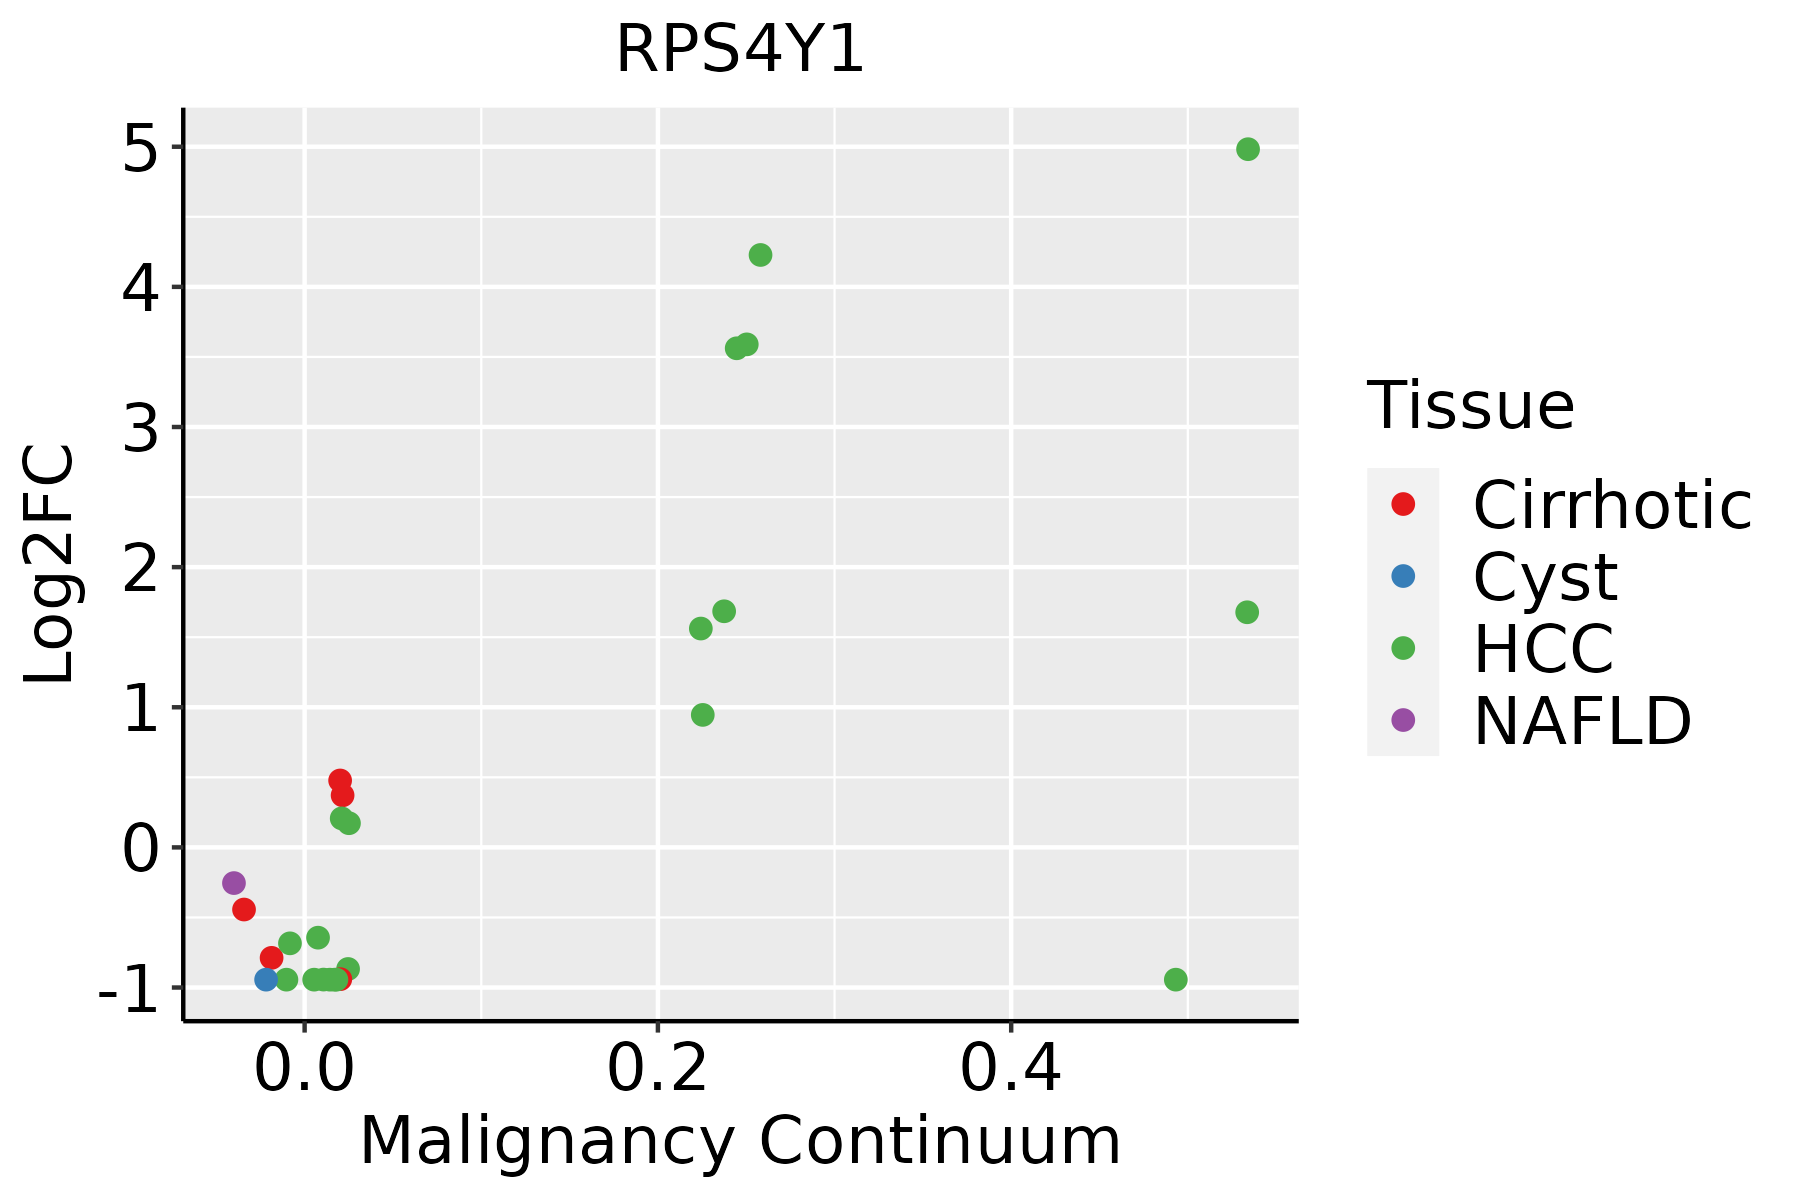 | HCC: Hepatocellular carcinoma |
| NAFLD: Non-alcoholic fatty liver disease | ||
| Oral Cavity | 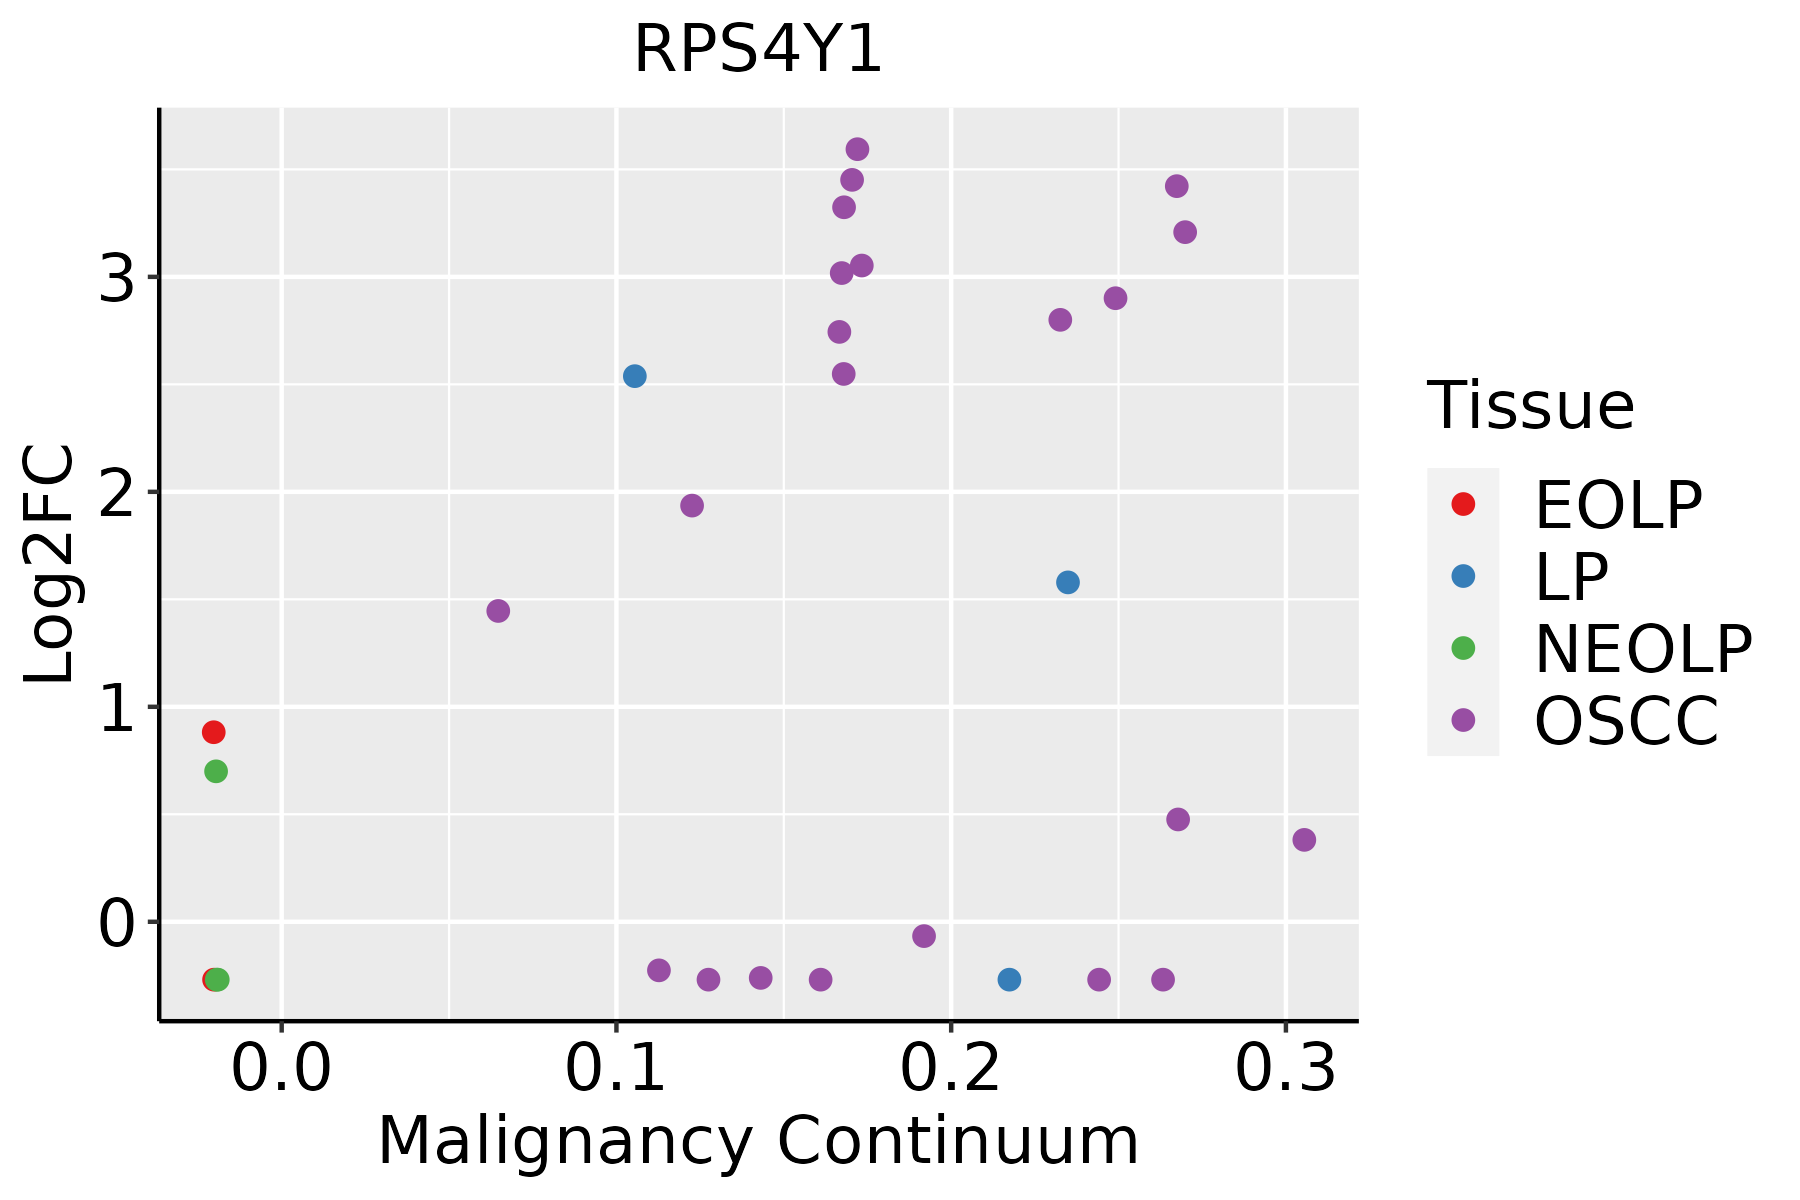 | EOLP: Erosive Oral lichen planus |
| LP: leukoplakia | ||
| NEOLP: Non-erosive oral lichen planus | ||
| OSCC: Oral squamous cell carcinoma | ||
| Prostate |  | BPH: Benign Prostatic Hyperplasia |
| Skin |  | AK: Actinic keratosis |
| cSCC: Cutaneous squamous cell carcinoma | ||
| SCCIS:squamous cell carcinoma in situ | ||
| Thyroid |  | ATC: Anaplastic thyroid cancer |
| HT: Hashimoto's thyroiditis | ||
| PTC: Papillary thyroid cancer |
| ∗log2FC in expression of this searched gene in stem-like cells from each diseased tissue sample relative to stem-like cells in normal samples in each tissue plotted against the malignancy continuum. Samples are colored based on if they are from different disease stage. |
Top |
Malignant transformation related pathway analysis |
| Find out the enriched GO biological processes and KEGG pathways involved in transition from healthy to precancer to cancer |
| Tissue | Disease Stage | Enriched GO biological Processes |
| Colorectum | AD |  |
| Colorectum | SER |  |
| Colorectum | MSS |  |
| Colorectum | MSI-H |  |
| Colorectum | FAP |  |
| ∗Top 15 enriched GO BP terms are showed in the bar plot of each disease state in each tissue. Each row represents a significant GO biological process which is colored according to the -log10(p.adjust). |
| Page: 1 2 3 4 5 6 7 8 9 |
| GO ID | Tissue | Disease Stage | Description | Gene Ratio | Bg Ratio | pvalue | p.adjust | Count |
| Page: 1 |
| Pathway ID | Tissue | Disease Stage | Description | Gene Ratio | Bg Ratio | pvalue | p.adjust | qvalue | Count |
| hsa0517124 | Breast | IDC | Coronavirus disease - COVID-19 | 86/867 | 232/8465 | 1.50e-28 | 9.72e-27 | 7.27e-27 | 86 |
| hsa0517134 | Breast | IDC | Coronavirus disease - COVID-19 | 86/867 | 232/8465 | 1.50e-28 | 9.72e-27 | 7.27e-27 | 86 |
| hsa05171 | Colorectum | AD | Coronavirus disease - COVID-19 | 113/2092 | 232/8465 | 9.90e-16 | 2.55e-14 | 1.63e-14 | 113 |
| hsa051711 | Colorectum | AD | Coronavirus disease - COVID-19 | 113/2092 | 232/8465 | 9.90e-16 | 2.55e-14 | 1.63e-14 | 113 |
| hsa030102 | Colorectum | SER | Ribosome | 92/1580 | 167/8465 | 2.21e-26 | 3.66e-24 | 2.66e-24 | 92 |
| hsa051712 | Colorectum | SER | Coronavirus disease - COVID-19 | 98/1580 | 232/8465 | 3.33e-17 | 8.50e-16 | 6.17e-16 | 98 |
| hsa030103 | Colorectum | SER | Ribosome | 92/1580 | 167/8465 | 2.21e-26 | 3.66e-24 | 2.66e-24 | 92 |
| hsa051713 | Colorectum | SER | Coronavirus disease - COVID-19 | 98/1580 | 232/8465 | 3.33e-17 | 8.50e-16 | 6.17e-16 | 98 |
| hsa030104 | Colorectum | MSS | Ribosome | 96/1875 | 167/8465 | 1.82e-23 | 2.03e-21 | 1.24e-21 | 96 |
| hsa051714 | Colorectum | MSS | Coronavirus disease - COVID-19 | 108/1875 | 232/8465 | 6.50e-17 | 1.67e-15 | 1.03e-15 | 108 |
| hsa030105 | Colorectum | MSS | Ribosome | 96/1875 | 167/8465 | 1.82e-23 | 2.03e-21 | 1.24e-21 | 96 |
| hsa051715 | Colorectum | MSS | Coronavirus disease - COVID-19 | 108/1875 | 232/8465 | 6.50e-17 | 1.67e-15 | 1.03e-15 | 108 |
| hsa030106 | Colorectum | MSI-H | Ribosome | 87/797 | 167/8465 | 5.55e-46 | 1.80e-43 | 1.51e-43 | 87 |
| hsa051716 | Colorectum | MSI-H | Coronavirus disease - COVID-19 | 91/797 | 232/8465 | 2.21e-35 | 3.58e-33 | 3.00e-33 | 91 |
| hsa030107 | Colorectum | MSI-H | Ribosome | 87/797 | 167/8465 | 5.55e-46 | 1.80e-43 | 1.51e-43 | 87 |
| hsa051717 | Colorectum | MSI-H | Coronavirus disease - COVID-19 | 91/797 | 232/8465 | 2.21e-35 | 3.58e-33 | 3.00e-33 | 91 |
| hsa051718 | Colorectum | FAP | Coronavirus disease - COVID-19 | 78/1404 | 232/8465 | 9.94e-11 | 1.11e-08 | 6.73e-09 | 78 |
| hsa030108 | Colorectum | FAP | Ribosome | 59/1404 | 167/8465 | 2.38e-09 | 1.32e-07 | 8.05e-08 | 59 |
| hsa051719 | Colorectum | FAP | Coronavirus disease - COVID-19 | 78/1404 | 232/8465 | 9.94e-11 | 1.11e-08 | 6.73e-09 | 78 |
| hsa030109 | Colorectum | FAP | Ribosome | 59/1404 | 167/8465 | 2.38e-09 | 1.32e-07 | 8.05e-08 | 59 |
| Page: 1 2 3 4 5 |
Top |
Cell-cell communication analysis |
| Identification of potential cell-cell interactions between two cell types and their ligand-receptor pairs for different disease states |
| Ligand | Receptor | LRpair | Pathway | Tissue | Disease Stage |
| Page: 1 |
Top |
Single-cell gene regulatory network inference analysis |
| Find out the significant the regulons (TFs) and the target genes of each regulon across cell types for different disease states |
| TF | Cell Type | Tissue | Disease Stage | Target Gene | RSS | Regulon Activity |
| ∗The dot plots of a searched regulon are shown for all cell subpopulations in each disease state of each tissue based on the regulon specific score inferred using pySCENIC and by calculating the average expression. |
| Page: 1 |
Top |
Somatic mutation of malignant transformation related genes |
| Annotation of somatic variants for genes involved in malignant transformation |
| Hugo Symbol | Variant Class | Variant Classification | dbSNP RS | HGVSc | HGVSp | HGVSp Short | SWISSPROT | BIOTYPE | SIFT | PolyPhen | Tumor Sample Barcode | Tissue | Histology | Sex | Age | Stage | Therapy Types | Drugs | Outcome |
| RPS4Y1 | insertion | Frame_Shift_Ins | novel | c.443_444insCT | p.Tyr149SerfsTer9 | p.Y149Sfs*9 | P22090 | protein_coding | TCGA-CC-A7IF-01 | Liver | liver hepatocellular carcinoma | Male | <65 | III/IV | Unknown | Unknown | PD | ||
| RPS4Y1 | SNV | Missense_Mutation | c.230G>T | p.Arg77Leu | p.R77L | P22090 | protein_coding | deleterious(0) | probably_damaging(0.994) | TCGA-05-4432-01 | Lung | lung adenocarcinoma | Male | >=65 | I/II | Chemotherapy | cisplatin | CR | |
| RPS4Y1 | SNV | Missense_Mutation | novel | c.191T>C | p.Ile64Thr | p.I64T | P22090 | protein_coding | deleterious(0.01) | probably_damaging(0.981) | TCGA-63-A5MS-01 | Lung | lung squamous cell carcinoma | Male | >=65 | I/II | Unknown | Unknown | SD |
| RPS4Y1 | SNV | Missense_Mutation | rs779925430 | c.337C>T | p.Arg113Cys | p.R113C | P22090 | protein_coding | tolerated(0.14) | possibly_damaging(0.563) | TCGA-CD-A4MI-01 | Stomach | stomach adenocarcinoma | Male | <65 | III/IV | Unknown | Unknown | PD |
| Page: 1 |
Top |
Related drugs of malignant transformation related genes |
| Identification of chemicals and drugs interact with genes involved in malignant transfromation |
| (DGIdb 4.0) |
| Entrez ID | Symbol | Category | Interaction Types | Drug Claim Name | Drug Name | PMIDs |
| Page: 1 |

Copyright 2023-Present -The University of Texas Health Science Center at Houston |