
|
|||||
|
 | |
| |
| |
| |
| |
| |
|
Gene: RPS27A |
Gene summary for RPS27A |
| Gene information | Species | Human | Gene symbol | RPS27A | Gene ID | 6233 |
| Gene name | ribosomal protein S27a | |
| Gene Alias | CEP80 | |
| Cytomap | 2p16.1 | |
| Gene Type | protein-coding | GO ID | GO:0002181 | UniProtAcc | B2RDW1 |
Top |
Malignant transformation analysis |
| Identification of the aberrant gene expression in precancerous and cancerous lesions by comparing the gene expression of stem-like cells in diseased tissues with normal stem cells |
| Entrez ID | Symbol | Replicates | Species | Organ | Tissue | Adj P-value | Log2FC | Malignancy |
| 6233 | RPS27A | GSM4909281 | Human | Breast | IDC | 5.14e-16 | -1.55e-01 | 0.21 |
| 6233 | RPS27A | GSM4909285 | Human | Breast | IDC | 1.24e-04 | 9.37e-02 | 0.21 |
| 6233 | RPS27A | GSM4909286 | Human | Breast | IDC | 7.64e-13 | 1.22e-01 | 0.1081 |
| 6233 | RPS27A | GSM4909287 | Human | Breast | IDC | 1.53e-06 | -1.52e-01 | 0.2057 |
| 6233 | RPS27A | GSM4909289 | Human | Breast | IDC | 3.19e-02 | -1.87e-01 | 0.1064 |
| 6233 | RPS27A | GSM4909290 | Human | Breast | IDC | 1.12e-02 | -8.58e-02 | 0.2096 |
| 6233 | RPS27A | GSM4909291 | Human | Breast | IDC | 2.40e-39 | -3.51e-01 | 0.1753 |
| 6233 | RPS27A | GSM4909293 | Human | Breast | IDC | 7.75e-24 | -1.42e-01 | 0.1581 |
| 6233 | RPS27A | GSM4909294 | Human | Breast | IDC | 4.39e-06 | -9.87e-02 | 0.2022 |
| 6233 | RPS27A | GSM4909295 | Human | Breast | IDC | 1.10e-06 | -2.11e-01 | 0.0898 |
| 6233 | RPS27A | GSM4909297 | Human | Breast | IDC | 9.63e-15 | -1.75e-01 | 0.1517 |
| 6233 | RPS27A | GSM4909298 | Human | Breast | IDC | 7.17e-56 | -2.48e-01 | 0.1551 |
| 6233 | RPS27A | GSM4909301 | Human | Breast | IDC | 3.38e-08 | -9.71e-02 | 0.1577 |
| 6233 | RPS27A | GSM4909302 | Human | Breast | IDC | 2.93e-31 | -2.84e-01 | 0.1545 |
| 6233 | RPS27A | GSM4909304 | Human | Breast | IDC | 7.37e-40 | -1.84e-01 | 0.1636 |
| 6233 | RPS27A | GSM4909306 | Human | Breast | IDC | 9.81e-27 | -1.65e-01 | 0.1564 |
| 6233 | RPS27A | GSM4909307 | Human | Breast | IDC | 2.61e-31 | -1.90e-01 | 0.1569 |
| 6233 | RPS27A | GSM4909308 | Human | Breast | IDC | 1.02e-39 | -2.23e-01 | 0.158 |
| 6233 | RPS27A | GSM4909311 | Human | Breast | IDC | 3.29e-04 | -1.30e-01 | 0.1534 |
| 6233 | RPS27A | GSM4909313 | Human | Breast | IDC | 2.17e-03 | -1.13e-01 | 0.0391 |
| Page: 1 2 3 4 5 6 7 8 9 10 11 12 13 14 15 16 17 18 19 |
| Tissue | Expression Dynamics | Abbreviation |
| Breast | 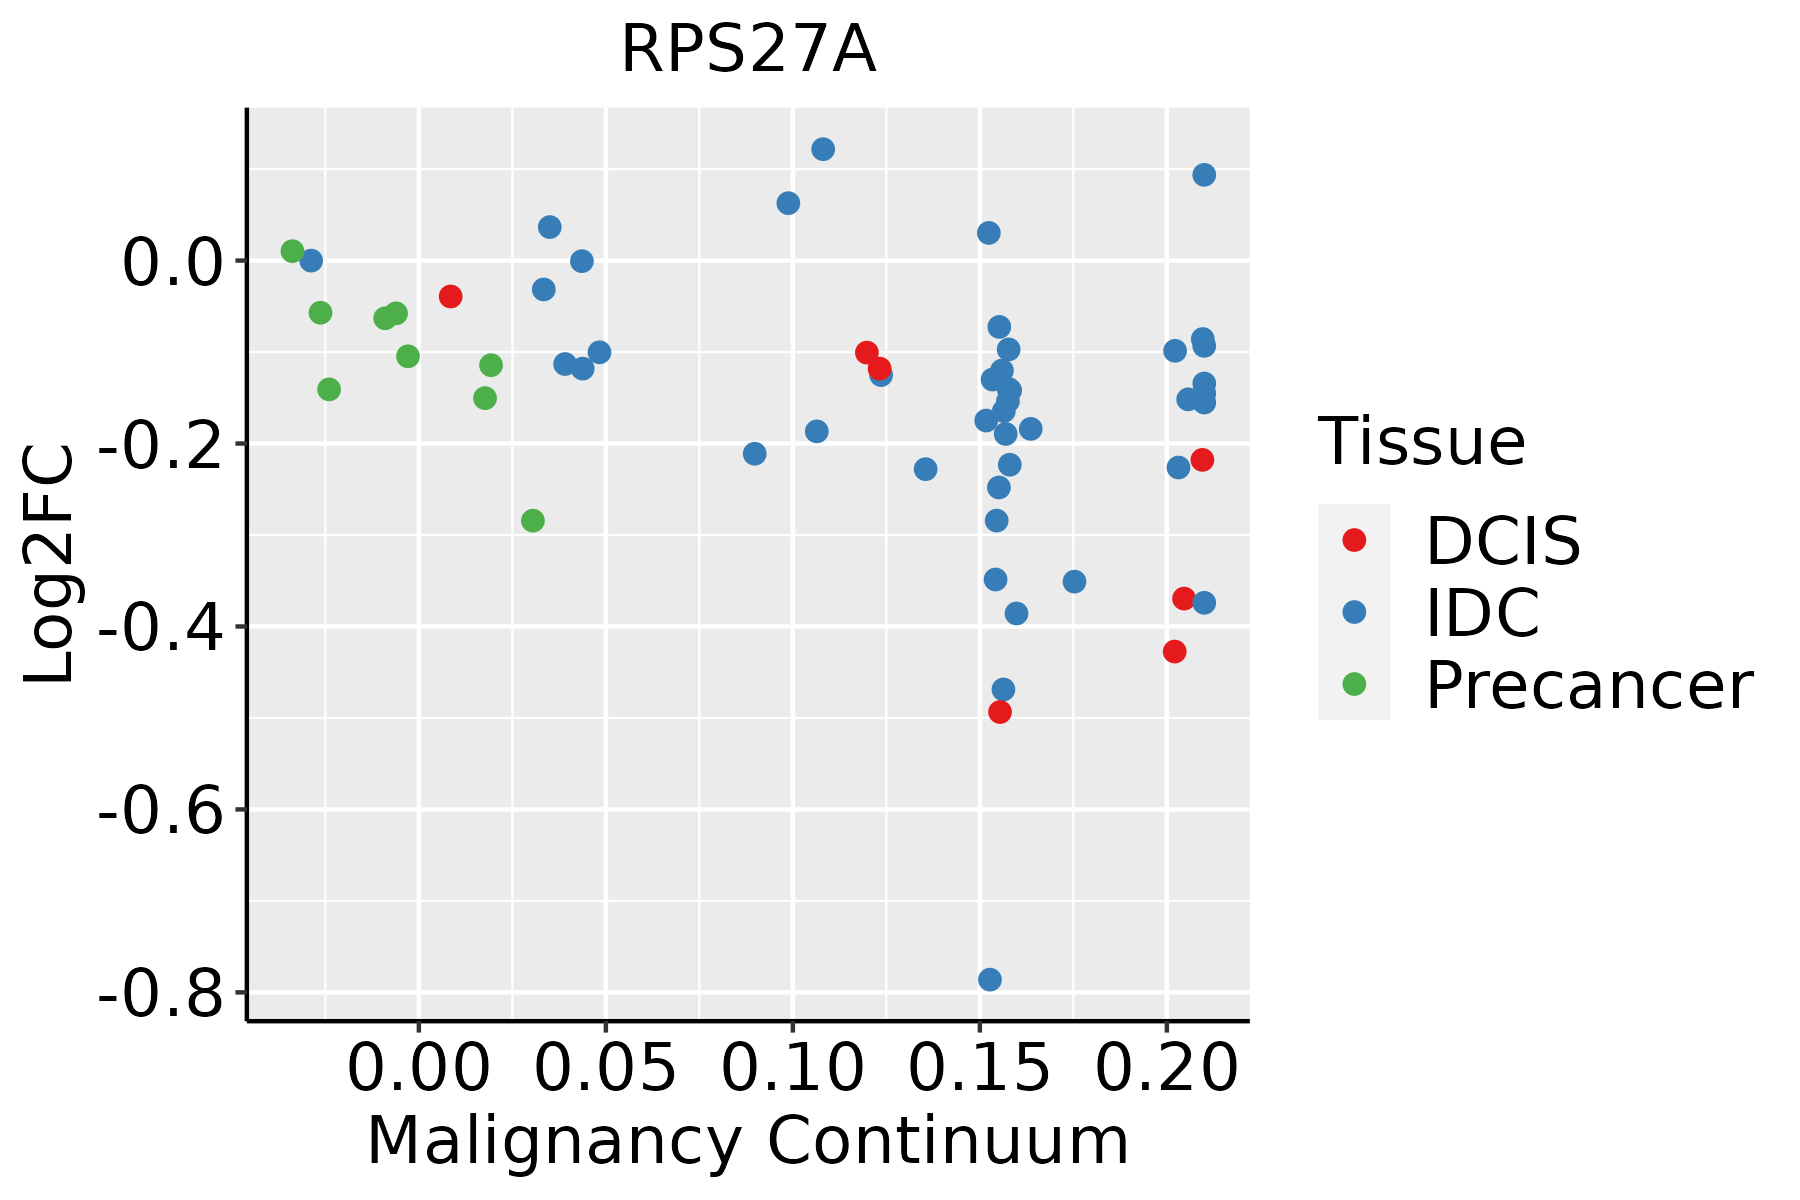 | IDC: Invasive ductal carcinoma |
| DCIS: Ductal carcinoma in situ | ||
| Precancer(BRCA1-mut): Precancerous lesion from BRCA1 mutation carriers | ||
| Cervix |  | CC: Cervix cancer |
| HSIL_HPV: HPV-infected high-grade squamous intraepithelial lesions | ||
| N_HPV: HPV-infected normal cervix | ||
| Colorectum (GSE201348) | 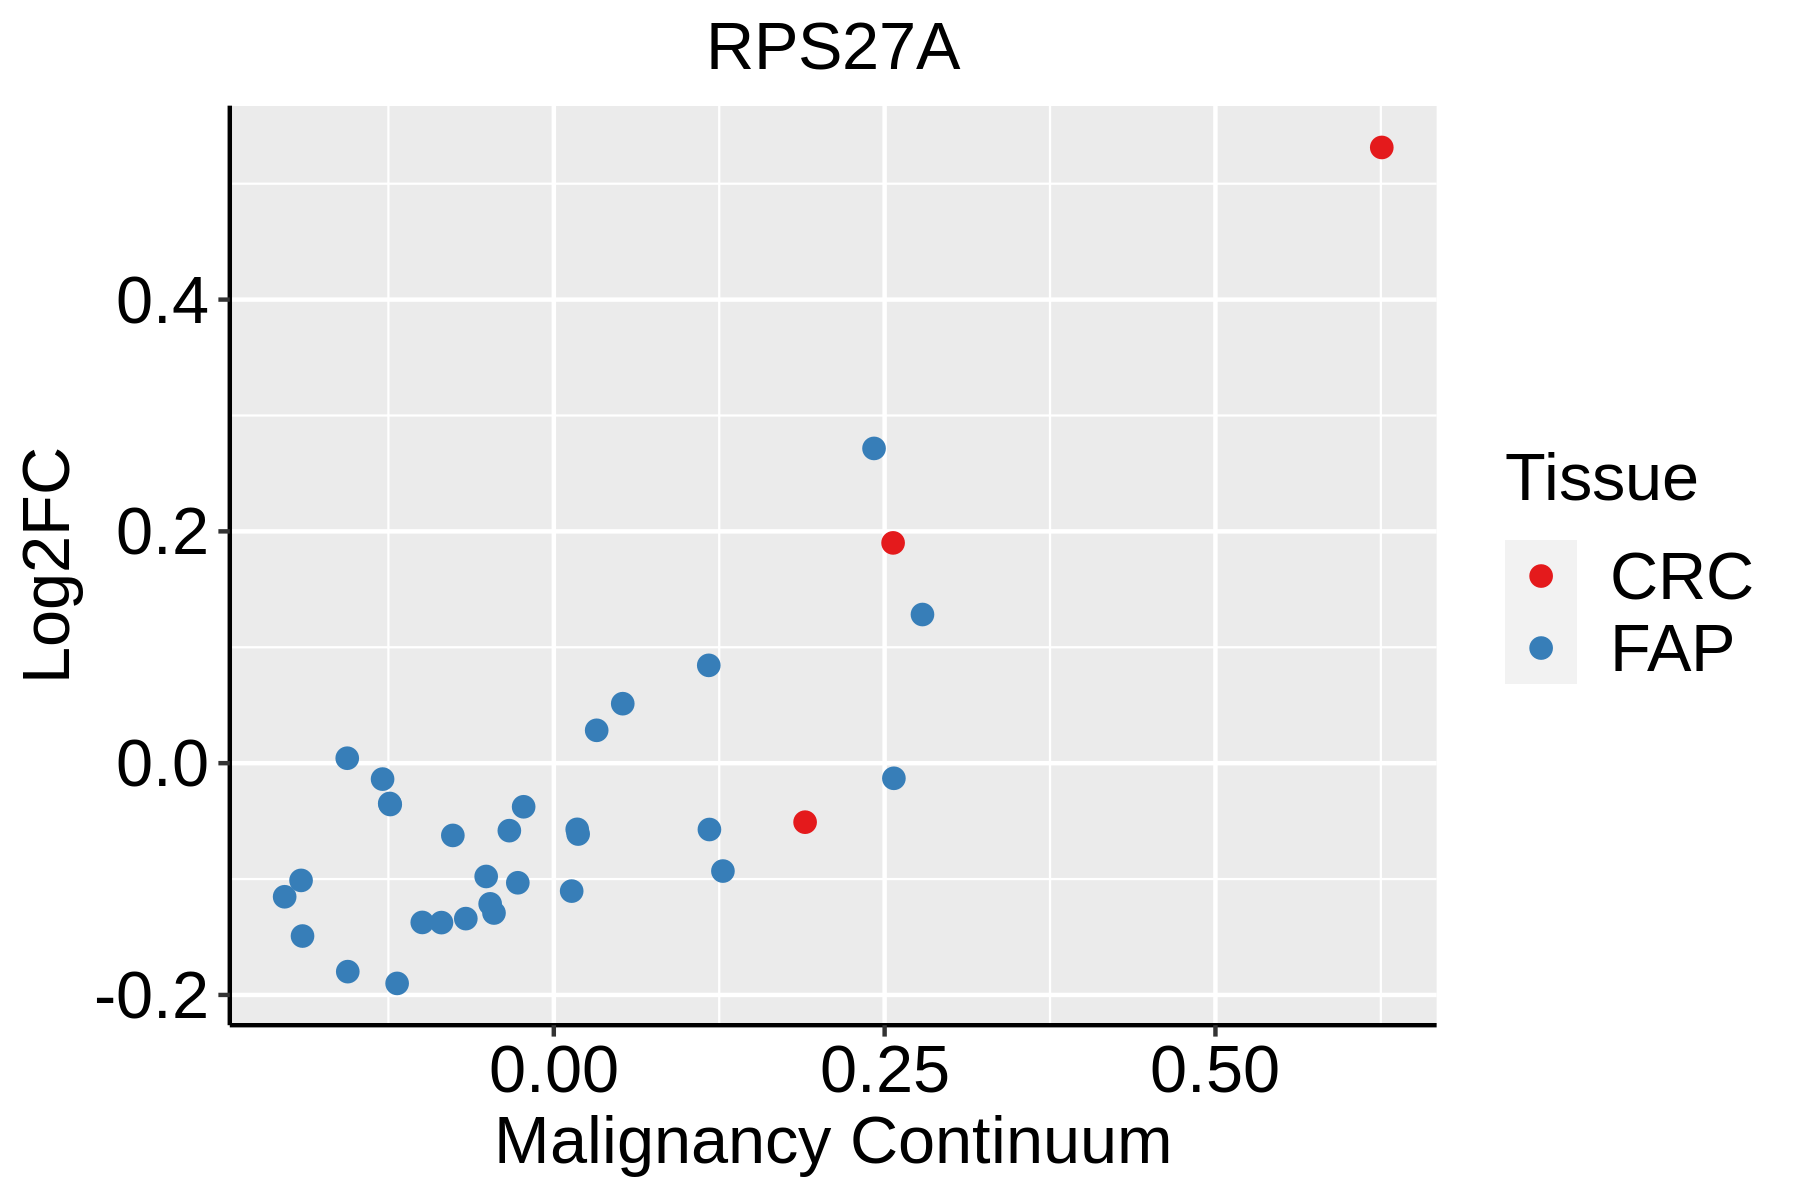 | FAP: Familial adenomatous polyposis |
| CRC: Colorectal cancer | ||
| Colorectum (HTA11) |  | AD: Adenomas |
| SER: Sessile serrated lesions | ||
| MSI-H: Microsatellite-high colorectal cancer | ||
| MSS: Microsatellite stable colorectal cancer | ||
| Endometrium |  | AEH: Atypical endometrial hyperplasia |
| EEC: Endometrioid Cancer | ||
| Esophagus | 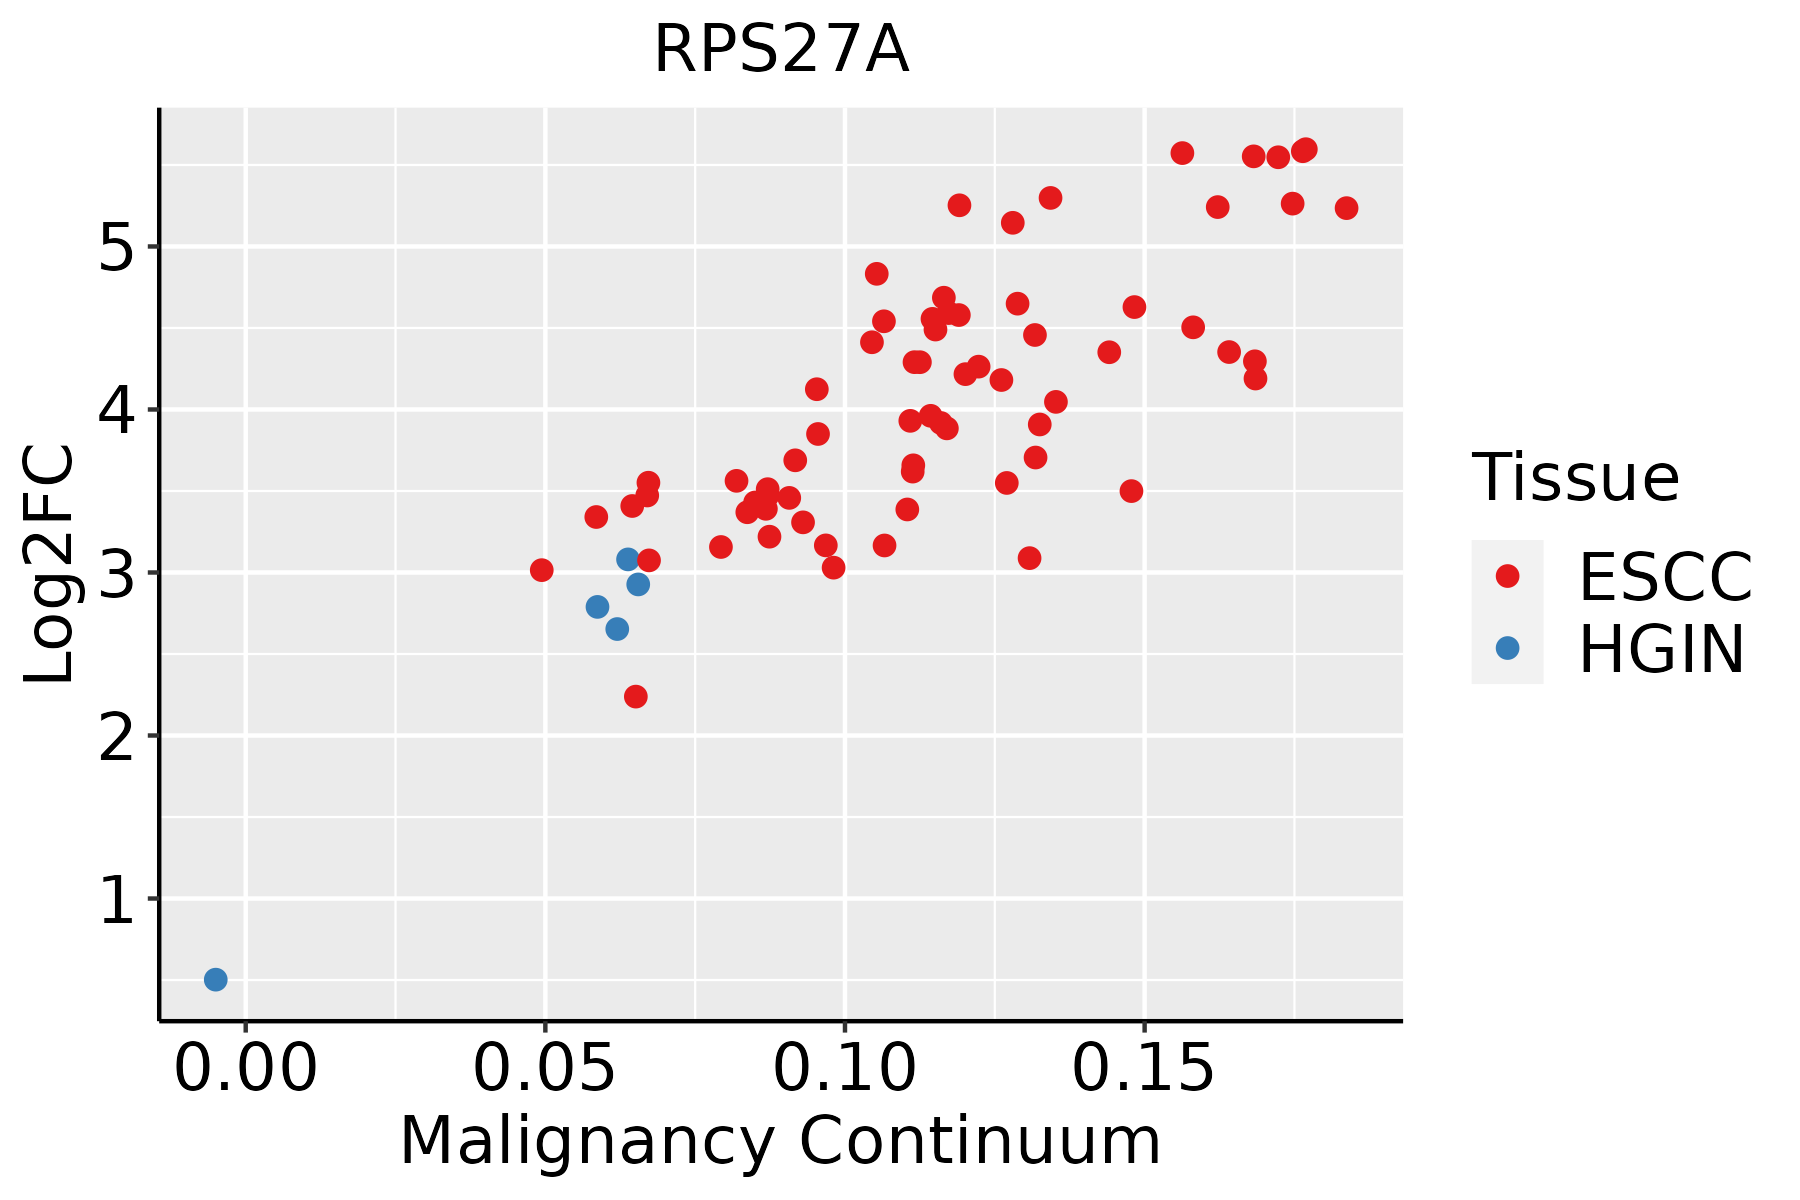 | ESCC: Esophageal squamous cell carcinoma |
| HGIN: High-grade intraepithelial neoplasias | ||
| LGIN: Low-grade intraepithelial neoplasias | ||
| GC | 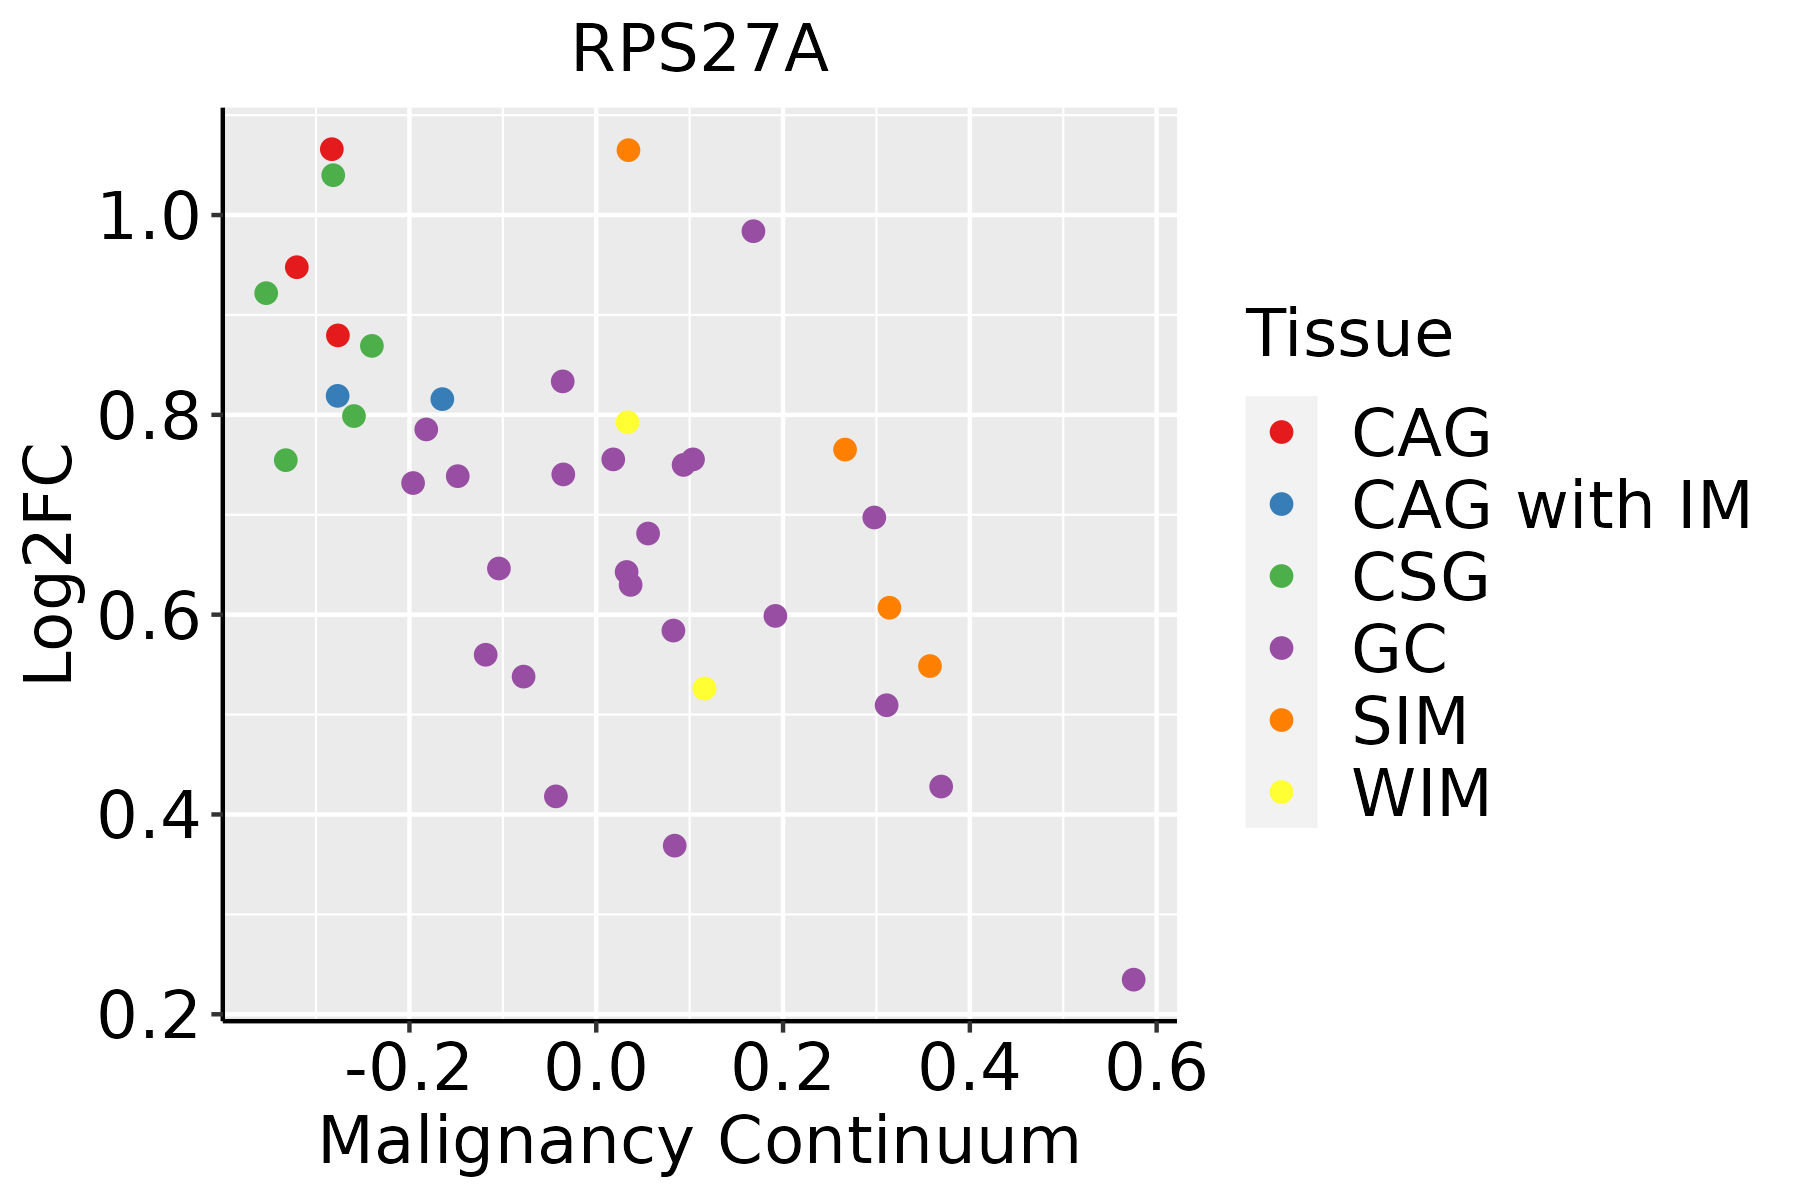 | CAG: Chronic atrophic gastritis |
| CAG with IM: Chronic atrophic gastritis with intestinal metaplasia | ||
| CSG: Chronic superficial gastritis | ||
| GC: Gastric cancer | ||
| SIM: Severe intestinal metaplasia | ||
| WIM: Wild intestinal metaplasia | ||
| Liver | 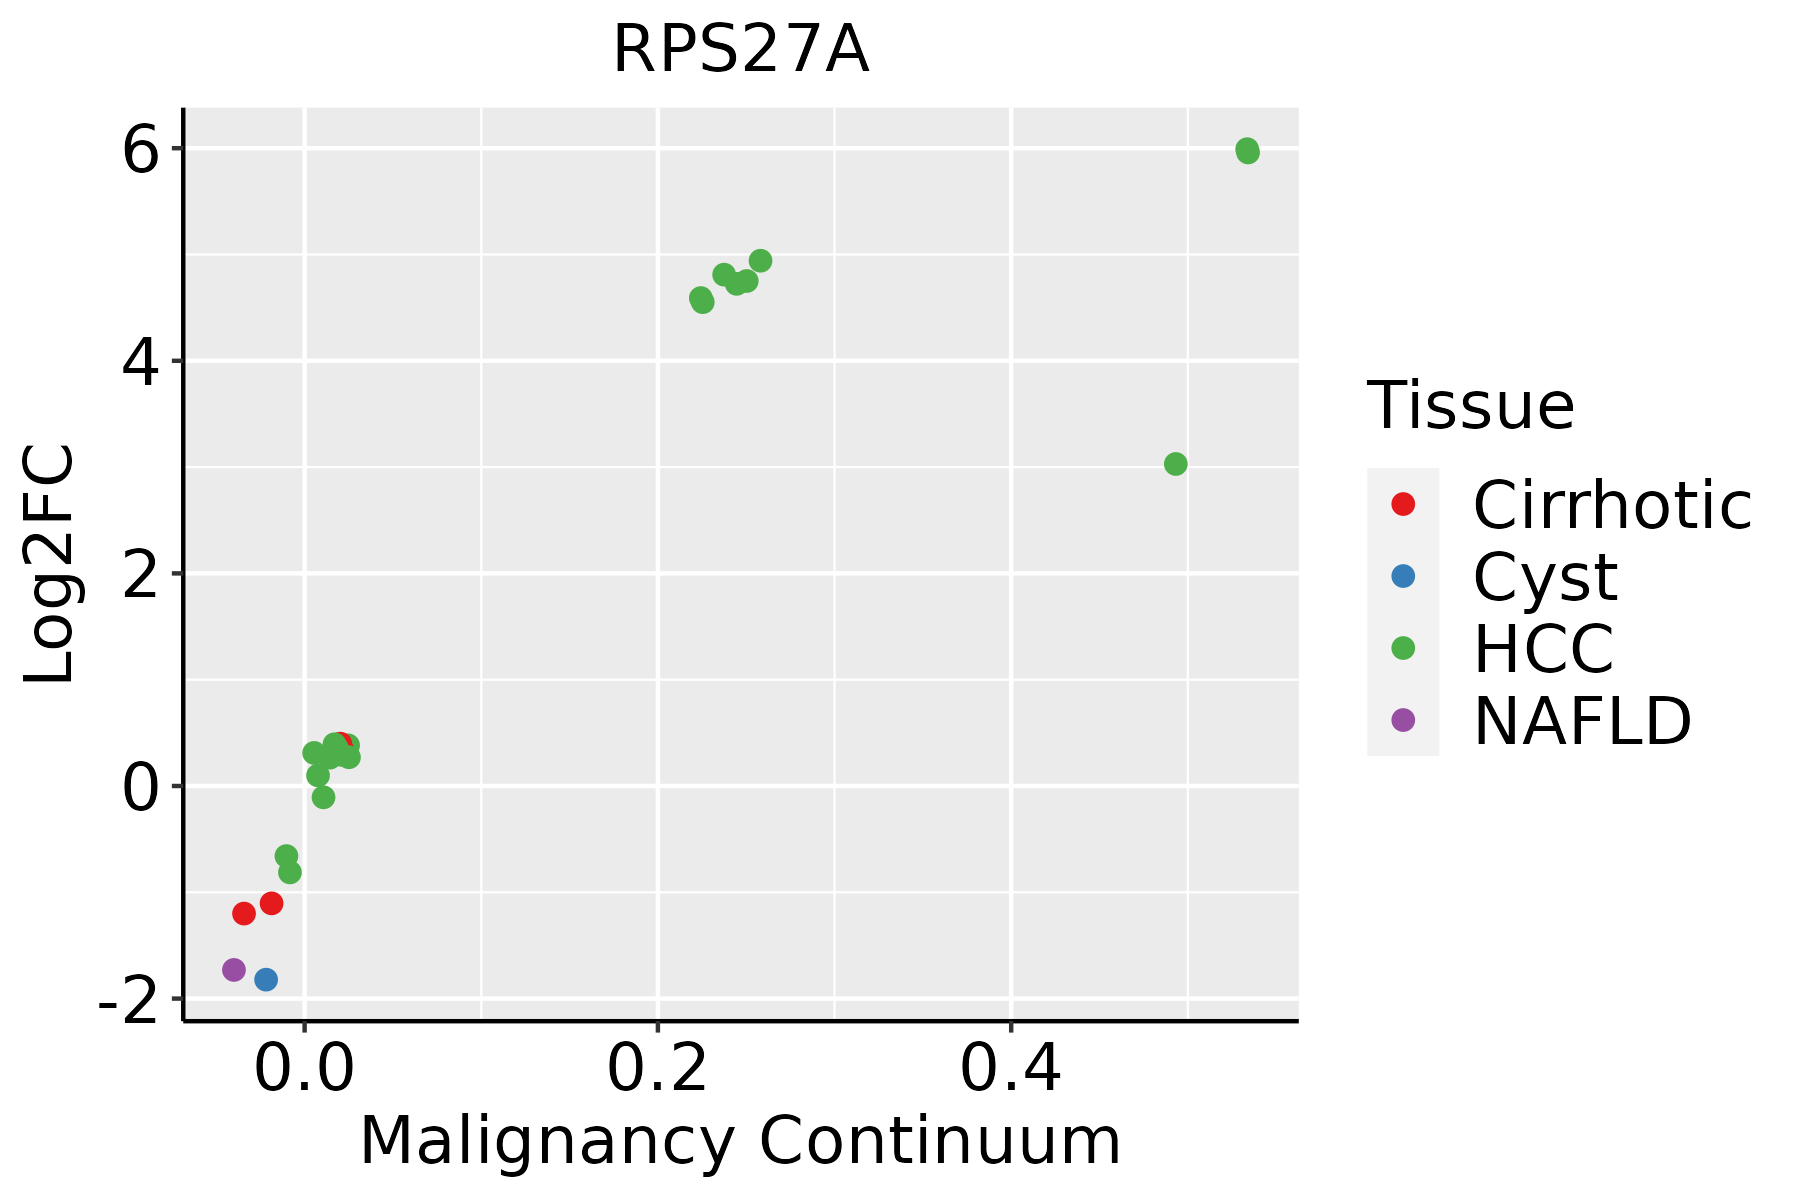 | HCC: Hepatocellular carcinoma |
| NAFLD: Non-alcoholic fatty liver disease | ||
| Lung |  | AAH: Atypical adenomatous hyperplasia |
| AIS: Adenocarcinoma in situ | ||
| IAC: Invasive lung adenocarcinoma | ||
| MIA: Minimally invasive adenocarcinoma | ||
| Oral Cavity | 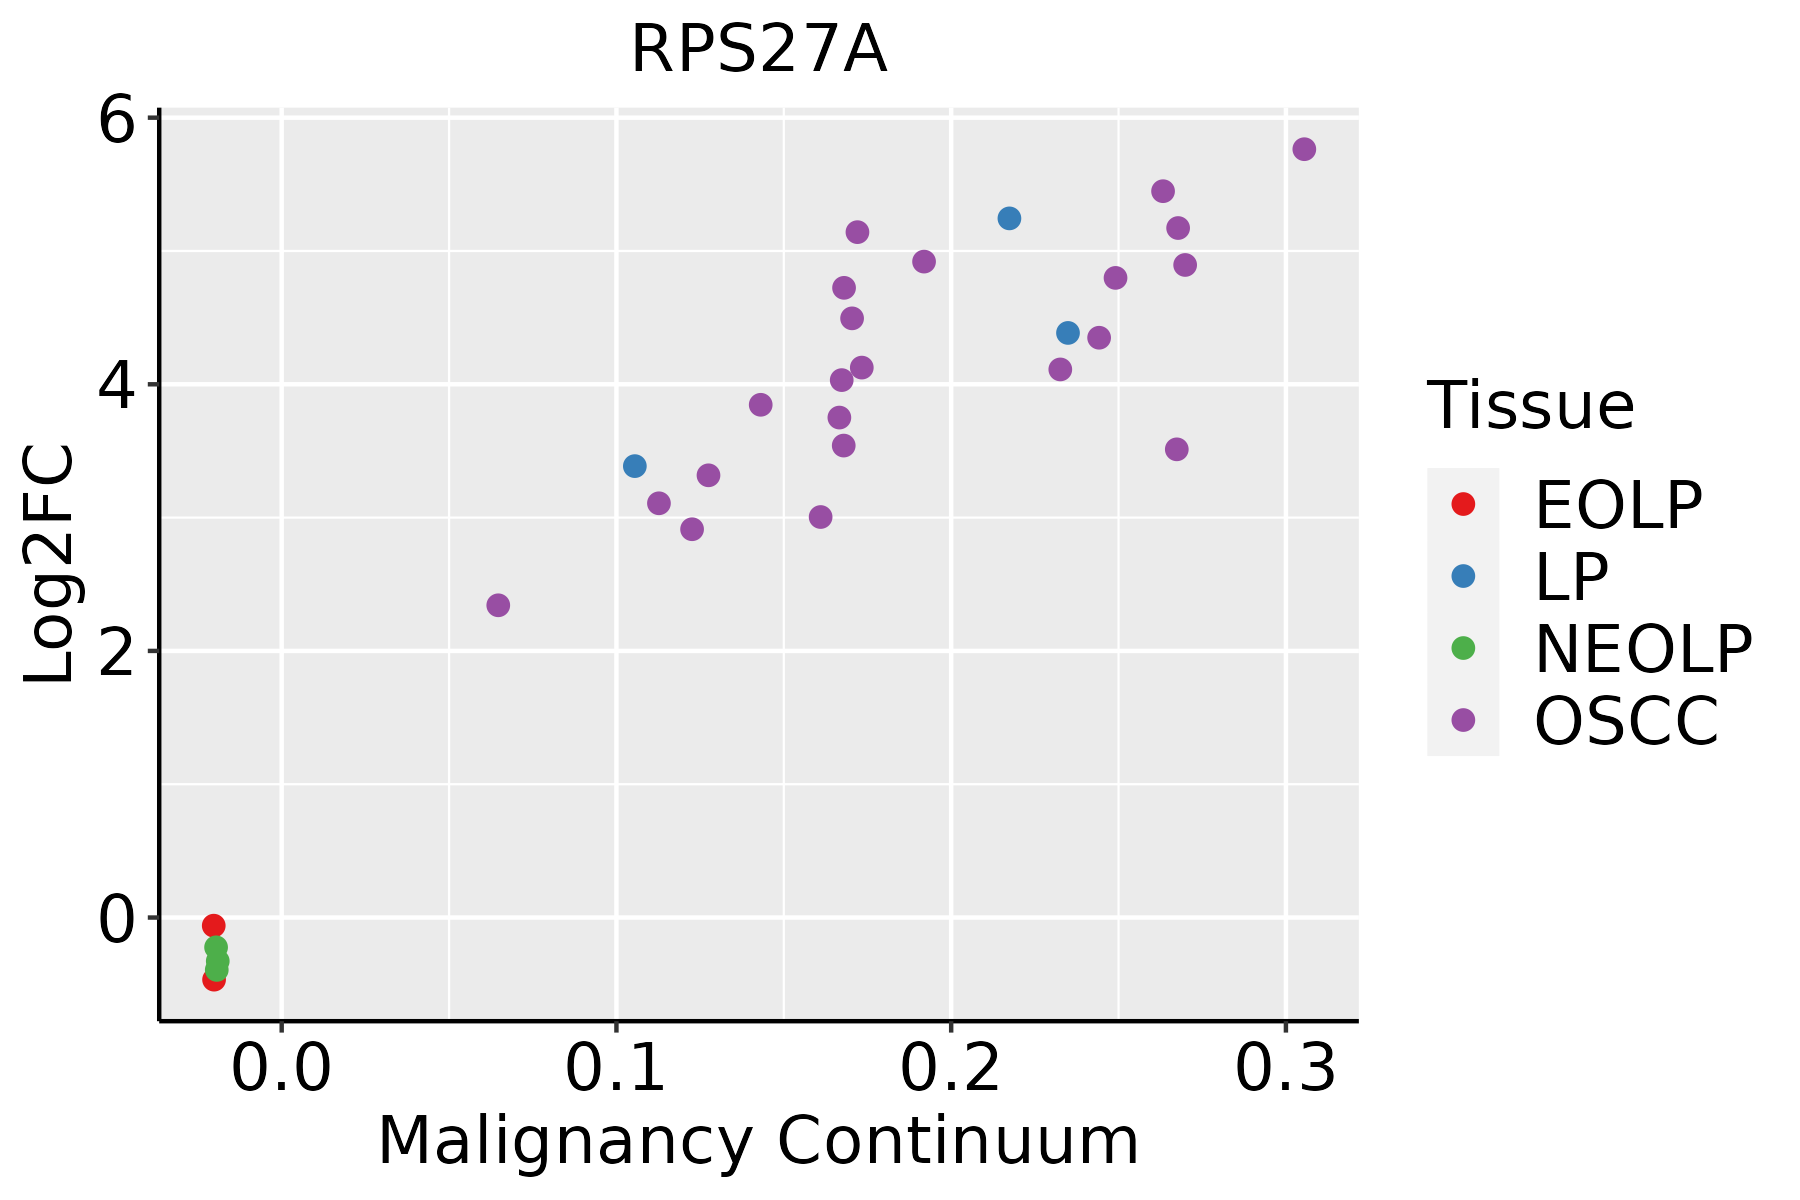 | EOLP: Erosive Oral lichen planus |
| LP: leukoplakia | ||
| NEOLP: Non-erosive oral lichen planus | ||
| OSCC: Oral squamous cell carcinoma | ||
| Prostate | 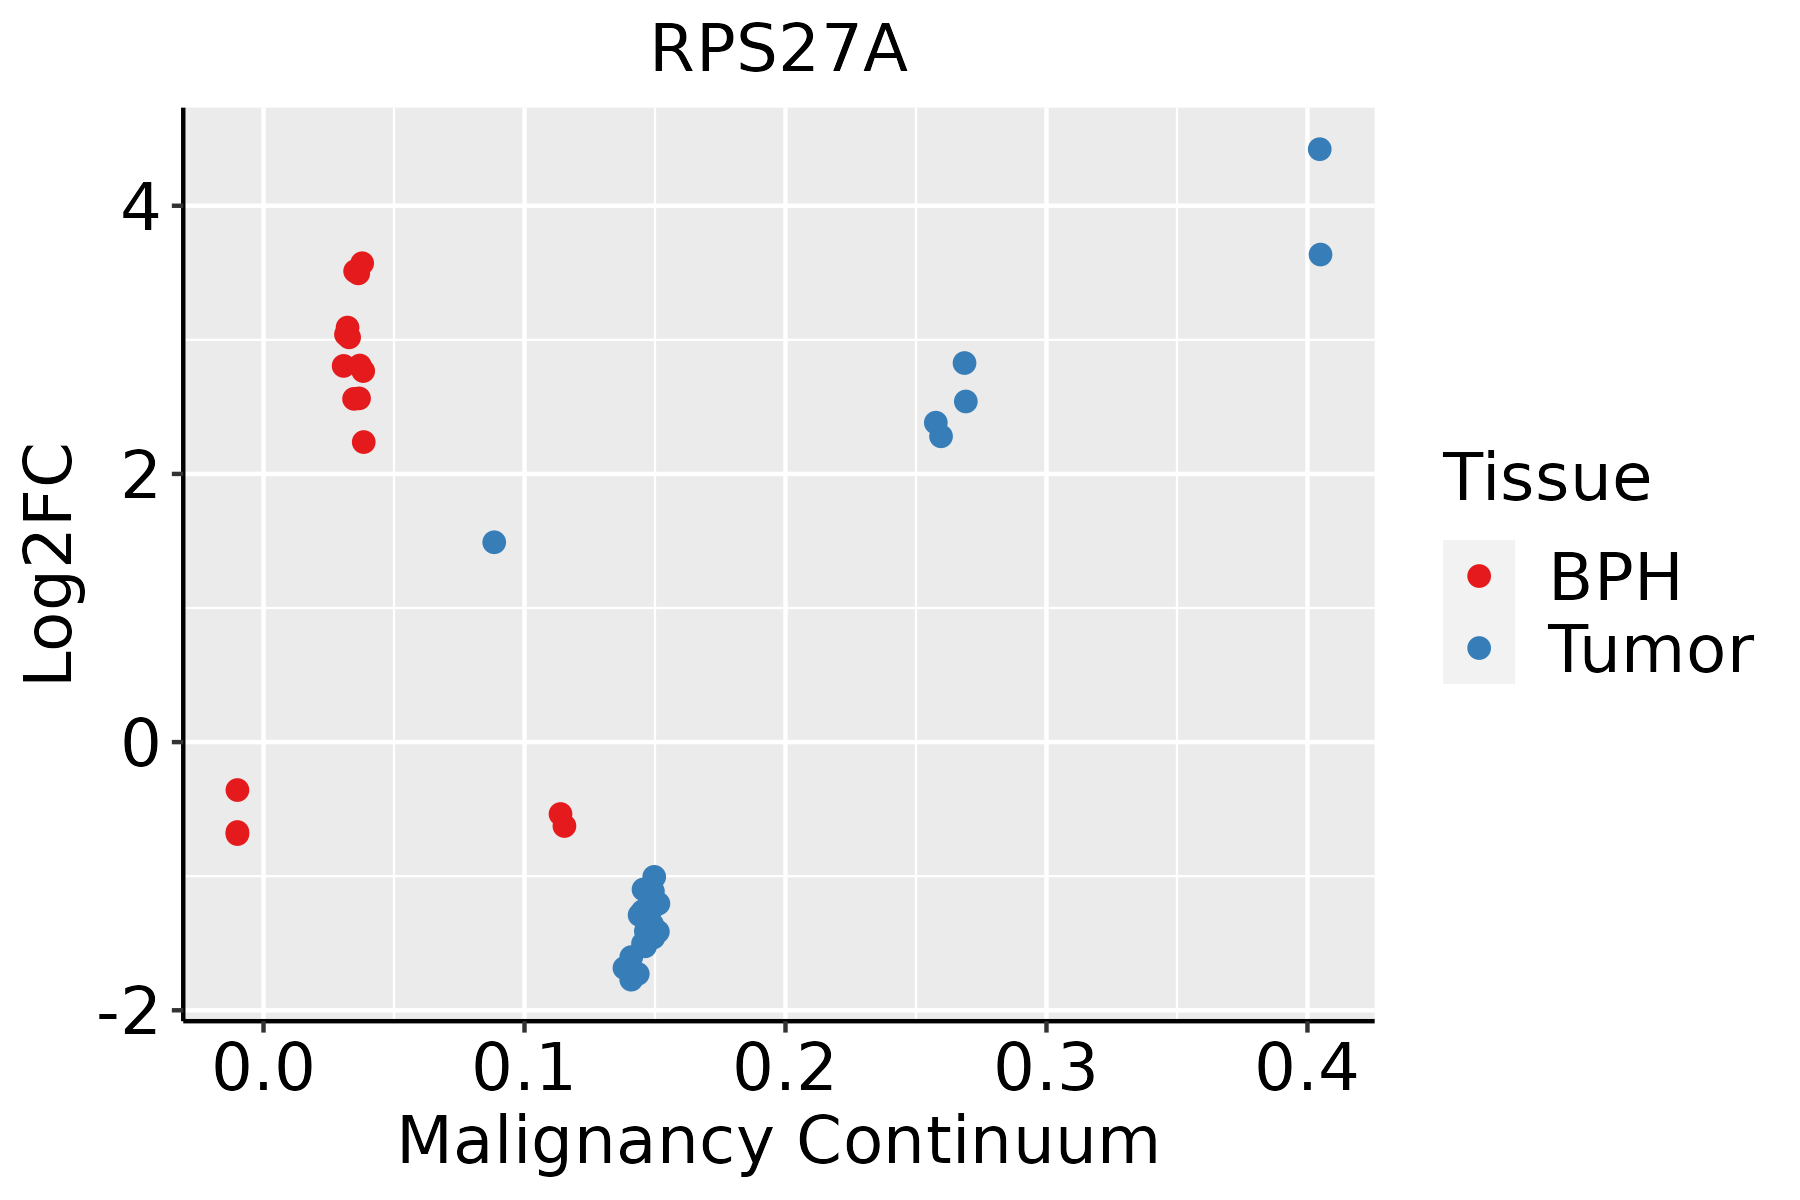 | BPH: Benign Prostatic Hyperplasia |
| Skin | 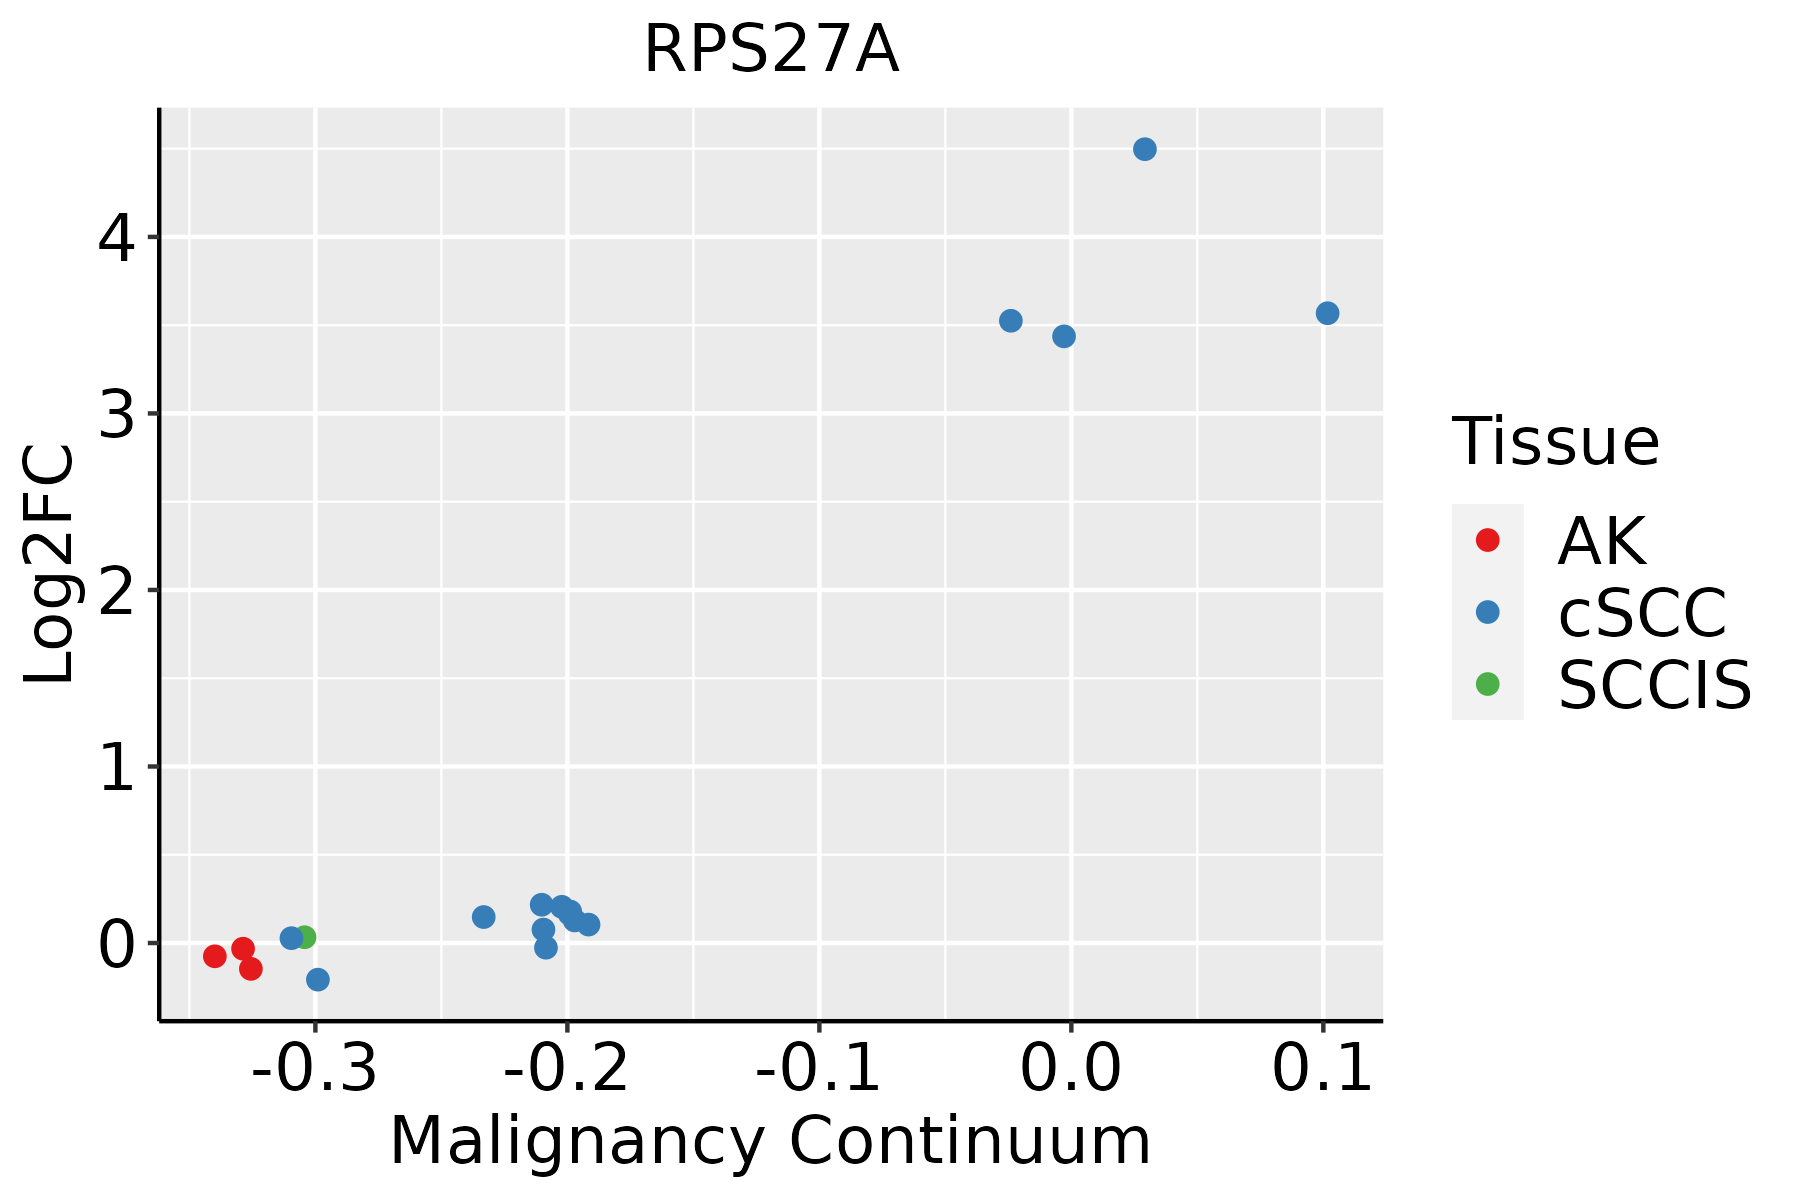 | AK: Actinic keratosis |
| cSCC: Cutaneous squamous cell carcinoma | ||
| SCCIS:squamous cell carcinoma in situ | ||
| Thyroid |  | ATC: Anaplastic thyroid cancer |
| HT: Hashimoto's thyroiditis | ||
| PTC: Papillary thyroid cancer |
| ∗log2FC in expression of this searched gene in stem-like cells from each diseased tissue sample relative to stem-like cells in normal samples in each tissue plotted against the malignancy continuum. Samples are colored based on if they are from different disease stage. |
Top |
Malignant transformation related pathway analysis |
| Find out the enriched GO biological processes and KEGG pathways involved in transition from healthy to precancer to cancer |
| Tissue | Disease Stage | Enriched GO biological Processes |
| Colorectum | AD |  |
| Colorectum | SER |  |
| Colorectum | MSS |  |
| Colorectum | MSI-H |  |
| Colorectum | FAP |  |
| ∗Top 15 enriched GO BP terms are showed in the bar plot of each disease state in each tissue. Each row represents a significant GO biological process which is colored according to the -log10(p.adjust). |
| Page: 1 2 3 4 5 6 7 8 9 |
| GO ID | Tissue | Disease Stage | Description | Gene Ratio | Bg Ratio | pvalue | p.adjust | Count |
| GO:00021819 | Breast | Precancer | cytoplasmic translation | 80/1080 | 148/18723 | 1.59e-59 | 8.54e-56 | 80 |
| GO:000218114 | Breast | IDC | cytoplasmic translation | 82/1434 | 148/18723 | 2.60e-52 | 1.48e-48 | 82 |
| GO:000218124 | Breast | DCIS | cytoplasmic translation | 82/1390 | 148/18723 | 2.21e-53 | 1.25e-49 | 82 |
| GO:000218110 | Cervix | CC | cytoplasmic translation | 96/2311 | 148/18723 | 4.87e-51 | 2.91e-47 | 96 |
| GO:000218115 | Cervix | HSIL_HPV | cytoplasmic translation | 86/737 | 148/18723 | 3.97e-82 | 1.91e-78 | 86 |
| GO:000218125 | Cervix | N_HPV | cytoplasmic translation | 42/534 | 148/18723 | 2.61e-30 | 1.19e-26 | 42 |
| GO:0002181 | Colorectum | AD | cytoplasmic translation | 109/3918 | 148/18723 | 3.40e-43 | 2.13e-39 | 109 |
| GO:00021811 | Colorectum | SER | cytoplasmic translation | 102/2897 | 148/18723 | 1.38e-48 | 8.49e-45 | 102 |
| GO:00021812 | Colorectum | MSS | cytoplasmic translation | 108/3467 | 148/18723 | 1.78e-47 | 1.11e-43 | 108 |
| GO:00021813 | Colorectum | MSI-H | cytoplasmic translation | 100/1319 | 148/18723 | 1.50e-79 | 8.31e-76 | 100 |
| GO:00021815 | Colorectum | CRC | cytoplasmic translation | 70/2078 | 148/18723 | 1.53e-28 | 9.16e-25 | 70 |
| GO:000218116 | Endometrium | AEH | cytoplasmic translation | 104/2100 | 148/18723 | 1.01e-64 | 6.07e-61 | 104 |
| GO:000218117 | Endometrium | EEC | cytoplasmic translation | 104/2168 | 148/18723 | 2.53e-63 | 1.52e-59 | 104 |
| GO:000218127 | Esophagus | HGIN | cytoplasmic translation | 108/2587 | 148/18723 | 1.70e-60 | 1.02e-56 | 108 |
| GO:0002181111 | Esophagus | ESCC | cytoplasmic translation | 135/8552 | 148/18723 | 4.17e-32 | 2.65e-29 | 135 |
| GO:00021817 | Liver | NAFLD | cytoplasmic translation | 93/1882 | 148/18723 | 1.44e-55 | 8.41e-52 | 93 |
| GO:000218112 | Liver | Cirrhotic | cytoplasmic translation | 120/4634 | 148/18723 | 2.95e-47 | 1.85e-43 | 120 |
| GO:000218122 | Liver | HCC | cytoplasmic translation | 132/7958 | 148/18723 | 9.09e-33 | 5.76e-30 | 132 |
| GO:000218132 | Liver | Cyst | cytoplasmic translation | 70/496 | 148/18723 | 9.01e-71 | 3.85e-67 | 70 |
| GO:00021818 | Lung | IAC | cytoplasmic translation | 85/2061 | 148/18723 | 3.11e-43 | 1.85e-39 | 85 |
| Page: 1 2 3 |
| Pathway ID | Tissue | Disease Stage | Description | Gene Ratio | Bg Ratio | pvalue | p.adjust | qvalue | Count |
| hsa0301018 | Breast | Precancer | Ribosome | 80/684 | 167/8465 | 7.33e-44 | 2.32e-41 | 1.77e-41 | 80 |
| hsa0501218 | Breast | Precancer | Parkinson disease | 99/684 | 266/8465 | 3.58e-42 | 5.65e-40 | 4.33e-40 | 99 |
| hsa0517118 | Breast | Precancer | Coronavirus disease - COVID-19 | 81/684 | 232/8465 | 3.74e-32 | 2.36e-30 | 1.81e-30 | 81 |
| hsa0502216 | Breast | Precancer | Pathways of neurodegeneration - multiple diseases | 112/684 | 476/8465 | 6.96e-27 | 2.44e-25 | 1.87e-25 | 112 |
| hsa0513118 | Breast | Precancer | Shigellosis | 44/684 | 247/8465 | 3.91e-07 | 6.86e-06 | 5.26e-06 | 44 |
| hsa0516718 | Breast | Precancer | Kaposi sarcoma-associated herpesvirus infection | 36/684 | 194/8465 | 1.68e-06 | 2.53e-05 | 1.94e-05 | 36 |
| hsa0413716 | Breast | Precancer | Mitophagy - animal | 15/684 | 72/8465 | 5.22e-04 | 3.93e-03 | 3.01e-03 | 15 |
| hsa0301019 | Breast | Precancer | Ribosome | 80/684 | 167/8465 | 7.33e-44 | 2.32e-41 | 1.77e-41 | 80 |
| hsa0501219 | Breast | Precancer | Parkinson disease | 99/684 | 266/8465 | 3.58e-42 | 5.65e-40 | 4.33e-40 | 99 |
| hsa0517119 | Breast | Precancer | Coronavirus disease - COVID-19 | 81/684 | 232/8465 | 3.74e-32 | 2.36e-30 | 1.81e-30 | 81 |
| hsa0502217 | Breast | Precancer | Pathways of neurodegeneration - multiple diseases | 112/684 | 476/8465 | 6.96e-27 | 2.44e-25 | 1.87e-25 | 112 |
| hsa0513119 | Breast | Precancer | Shigellosis | 44/684 | 247/8465 | 3.91e-07 | 6.86e-06 | 5.26e-06 | 44 |
| hsa0516719 | Breast | Precancer | Kaposi sarcoma-associated herpesvirus infection | 36/684 | 194/8465 | 1.68e-06 | 2.53e-05 | 1.94e-05 | 36 |
| hsa0413717 | Breast | Precancer | Mitophagy - animal | 15/684 | 72/8465 | 5.22e-04 | 3.93e-03 | 3.01e-03 | 15 |
| hsa0501224 | Breast | IDC | Parkinson disease | 107/867 | 266/8465 | 2.57e-39 | 8.36e-37 | 6.26e-37 | 107 |
| hsa0301024 | Breast | IDC | Ribosome | 83/867 | 167/8465 | 6.07e-39 | 9.87e-37 | 7.38e-37 | 83 |
| hsa0517124 | Breast | IDC | Coronavirus disease - COVID-19 | 86/867 | 232/8465 | 1.50e-28 | 9.72e-27 | 7.27e-27 | 86 |
| hsa0502223 | Breast | IDC | Pathways of neurodegeneration - multiple diseases | 116/867 | 476/8465 | 3.63e-20 | 1.18e-18 | 8.82e-19 | 116 |
| hsa0513124 | Breast | IDC | Shigellosis | 47/867 | 247/8465 | 1.78e-05 | 2.00e-04 | 1.49e-04 | 47 |
| hsa0516723 | Breast | IDC | Kaposi sarcoma-associated herpesvirus infection | 38/867 | 194/8465 | 5.87e-05 | 5.96e-04 | 4.46e-04 | 38 |
| Page: 1 2 3 4 5 6 7 8 9 10 11 12 13 14 15 16 17 18 19 20 21 22 23 24 |
Top |
Cell-cell communication analysis |
| Identification of potential cell-cell interactions between two cell types and their ligand-receptor pairs for different disease states |
| Ligand | Receptor | LRpair | Pathway | Tissue | Disease Stage |
| Page: 1 |
Top |
Single-cell gene regulatory network inference analysis |
| Find out the significant the regulons (TFs) and the target genes of each regulon across cell types for different disease states |
| TF | Cell Type | Tissue | Disease Stage | Target Gene | RSS | Regulon Activity |
| ∗The dot plots of a searched regulon are shown for all cell subpopulations in each disease state of each tissue based on the regulon specific score inferred using pySCENIC and by calculating the average expression. |
| Page: 1 |
Top |
Somatic mutation of malignant transformation related genes |
| Annotation of somatic variants for genes involved in malignant transformation |
| Hugo Symbol | Variant Class | Variant Classification | dbSNP RS | HGVSc | HGVSp | HGVSp Short | SWISSPROT | BIOTYPE | SIFT | PolyPhen | Tumor Sample Barcode | Tissue | Histology | Sex | Age | Stage | Therapy Types | Drugs | Outcome |
| RPS27A | SNV | Missense_Mutation | novel | c.176N>G | p.Tyr59Cys | p.Y59C | P62979 | protein_coding | tolerated(0.06) | probably_damaging(0.999) | TCGA-A5-A0VP-01 | Endometrium | uterine corpus endometrioid carcinoma | Female | >=65 | I/II | Unknown | Unknown | SD |
| RPS27A | SNV | Missense_Mutation | c.291N>T | p.Lys97Asn | p.K97N | P62979 | protein_coding | tolerated(0.08) | probably_damaging(0.996) | TCGA-AP-A0LM-01 | Endometrium | uterine corpus endometrioid carcinoma | Female | <65 | III/IV | Chemotherapy | cisplatin | SD | |
| RPS27A | SNV | Missense_Mutation | c.335N>A | p.Gly112Asp | p.G112D | P62979 | protein_coding | deleterious(0.04) | benign(0.009) | TCGA-AP-A0LM-01 | Endometrium | uterine corpus endometrioid carcinoma | Female | <65 | III/IV | Chemotherapy | cisplatin | SD | |
| RPS27A | SNV | Missense_Mutation | novel | c.220N>T | p.Arg74Cys | p.R74C | P62979 | protein_coding | tolerated(0.15) | benign(0.005) | TCGA-AX-A05Z-01 | Endometrium | uterine corpus endometrioid carcinoma | Female | <65 | III/IV | Chemotherapy | adriamycin | SD |
| RPS27A | SNV | Missense_Mutation | novel | c.71N>C | p.Glu24Ala | p.E24A | P62979 | protein_coding | tolerated(0.08) | benign(0.305) | TCGA-EY-A1G8-01 | Endometrium | uterine corpus endometrioid carcinoma | Female | >=65 | I/II | Unknown | Unknown | SD |
| RPS27A | SNV | Missense_Mutation | novel | c.59N>G | p.Ser20Trp | p.S20W | P62979 | protein_coding | deleterious(0) | possibly_damaging(0.841) | TCGA-CV-6961-01 | Oral cavity | head & neck squamous cell carcinoma | Male | <65 | I/II | Unknown | Unknown | PD |
| RPS27A | SNV | Missense_Mutation | c.317N>G | p.Tyr106Cys | p.Y106C | P62979 | protein_coding | deleterious(0.03) | possibly_damaging(0.769) | TCGA-HC-A6AS-01 | Prostate | prostate adenocarcinoma | Male | >=65 | 7 | Unknown | Unknown | SD | |
| RPS27A | SNV | Missense_Mutation | novel | c.62A>T | p.Asp21Val | p.D21V | P62979 | protein_coding | deleterious(0.01) | possibly_damaging(0.609) | TCGA-BR-8373-01 | Stomach | stomach adenocarcinoma | Female | >=65 | III/IV | Chemotherapy | 5-fluorouracil | CR |
| RPS27A | SNV | Missense_Mutation | c.137N>T | p.Ala46Val | p.A46V | P62979 | protein_coding | deleterious(0.02) | benign(0.396) | TCGA-CG-4437-01 | Stomach | stomach adenocarcinoma | Male | >=65 | I/II | Unknown | Unknown | SD | |
| RPS27A | SNV | Missense_Mutation | rs569250342 | c.352N>T | p.Arg118Cys | p.R118C | P62979 | protein_coding | tolerated(0.07) | benign(0) | TCGA-FP-A4BF-01 | Stomach | stomach adenocarcinoma | Male | >=65 | III/IV | Unknown | Unknown | PD |
| Page: 1 |
Top |
Related drugs of malignant transformation related genes |
| Identification of chemicals and drugs interact with genes involved in malignant transfromation |
| (DGIdb 4.0) |
| Entrez ID | Symbol | Category | Interaction Types | Drug Claim Name | Drug Name | PMIDs |
| Page: 1 |

Copyright 2023-Present -The University of Texas Health Science Center at Houston |