
|
|||||
|
 | |
| |
| |
| |
| |
| |
|
Gene: RPS19BP1 |
Gene summary for RPS19BP1 |
| Gene information | Species | Human | Gene symbol | RPS19BP1 | Gene ID | 91582 |
| Gene name | ribosomal protein S19 binding protein 1 | |
| Gene Alias | AROS | |
| Cytomap | 22q13.1 | |
| Gene Type | protein-coding | GO ID | GO:0005575 | UniProtAcc | A0A024R1T1 |
Top |
Malignant transformation analysis |
| Identification of the aberrant gene expression in precancerous and cancerous lesions by comparing the gene expression of stem-like cells in diseased tissues with normal stem cells |
| Entrez ID | Symbol | Replicates | Species | Organ | Tissue | Adj P-value | Log2FC | Malignancy |
| 91582 | RPS19BP1 | CA_HPV_1 | Human | Cervix | CC | 4.89e-06 | -1.71e-01 | 0.0264 |
| 91582 | RPS19BP1 | CCI_1 | Human | Cervix | CC | 3.11e-09 | -5.88e-01 | 0.528 |
| 91582 | RPS19BP1 | CCI_3 | Human | Cervix | CC | 1.90e-12 | -5.88e-01 | 0.516 |
| 91582 | RPS19BP1 | CCII_1 | Human | Cervix | CC | 3.79e-10 | -5.32e-01 | 0.3249 |
| 91582 | RPS19BP1 | L1 | Human | Cervix | CC | 4.42e-04 | -2.65e-01 | 0.0802 |
| 91582 | RPS19BP1 | HTA11_2487_2000001011 | Human | Colorectum | SER | 1.02e-05 | 2.88e-01 | -0.1808 |
| 91582 | RPS19BP1 | HTA11_1938_2000001011 | Human | Colorectum | AD | 3.48e-07 | 3.98e-01 | -0.0811 |
| 91582 | RPS19BP1 | HTA11_347_2000001011 | Human | Colorectum | AD | 1.51e-12 | 3.17e-01 | -0.1954 |
| 91582 | RPS19BP1 | HTA11_2112_2000001011 | Human | Colorectum | SER | 1.25e-02 | 4.36e-01 | -0.2196 |
| 91582 | RPS19BP1 | HTA11_696_2000001011 | Human | Colorectum | AD | 3.93e-13 | 3.61e-01 | -0.1464 |
| 91582 | RPS19BP1 | HTA11_866_2000001011 | Human | Colorectum | AD | 5.13e-05 | 2.42e-01 | -0.1001 |
| 91582 | RPS19BP1 | HTA11_1391_2000001011 | Human | Colorectum | AD | 1.11e-12 | 4.55e-01 | -0.059 |
| 91582 | RPS19BP1 | HTA11_2992_2000001011 | Human | Colorectum | SER | 2.23e-08 | 4.62e-01 | -0.1706 |
| 91582 | RPS19BP1 | HTA11_866_3004761011 | Human | Colorectum | AD | 2.37e-10 | 3.37e-01 | 0.096 |
| 91582 | RPS19BP1 | HTA11_8622_2000001021 | Human | Colorectum | SER | 8.64e-03 | 3.41e-01 | 0.0528 |
| 91582 | RPS19BP1 | HTA11_7663_2000001011 | Human | Colorectum | SER | 4.86e-04 | 3.15e-01 | 0.0131 |
| 91582 | RPS19BP1 | HTA11_10623_2000001011 | Human | Colorectum | AD | 1.35e-06 | 4.42e-01 | -0.0177 |
| 91582 | RPS19BP1 | HTA11_10711_2000001011 | Human | Colorectum | AD | 2.08e-03 | 2.59e-01 | 0.0338 |
| 91582 | RPS19BP1 | HTA11_7696_3000711011 | Human | Colorectum | AD | 1.20e-08 | 3.36e-01 | 0.0674 |
| 91582 | RPS19BP1 | HTA11_11156_2000001011 | Human | Colorectum | AD | 2.47e-02 | 3.46e-01 | 0.0397 |
| Page: 1 2 3 4 5 6 7 8 9 10 11 |
| Tissue | Expression Dynamics | Abbreviation |
| Cervix |  | CC: Cervix cancer |
| HSIL_HPV: HPV-infected high-grade squamous intraepithelial lesions | ||
| N_HPV: HPV-infected normal cervix | ||
| Colorectum (GSE201348) | 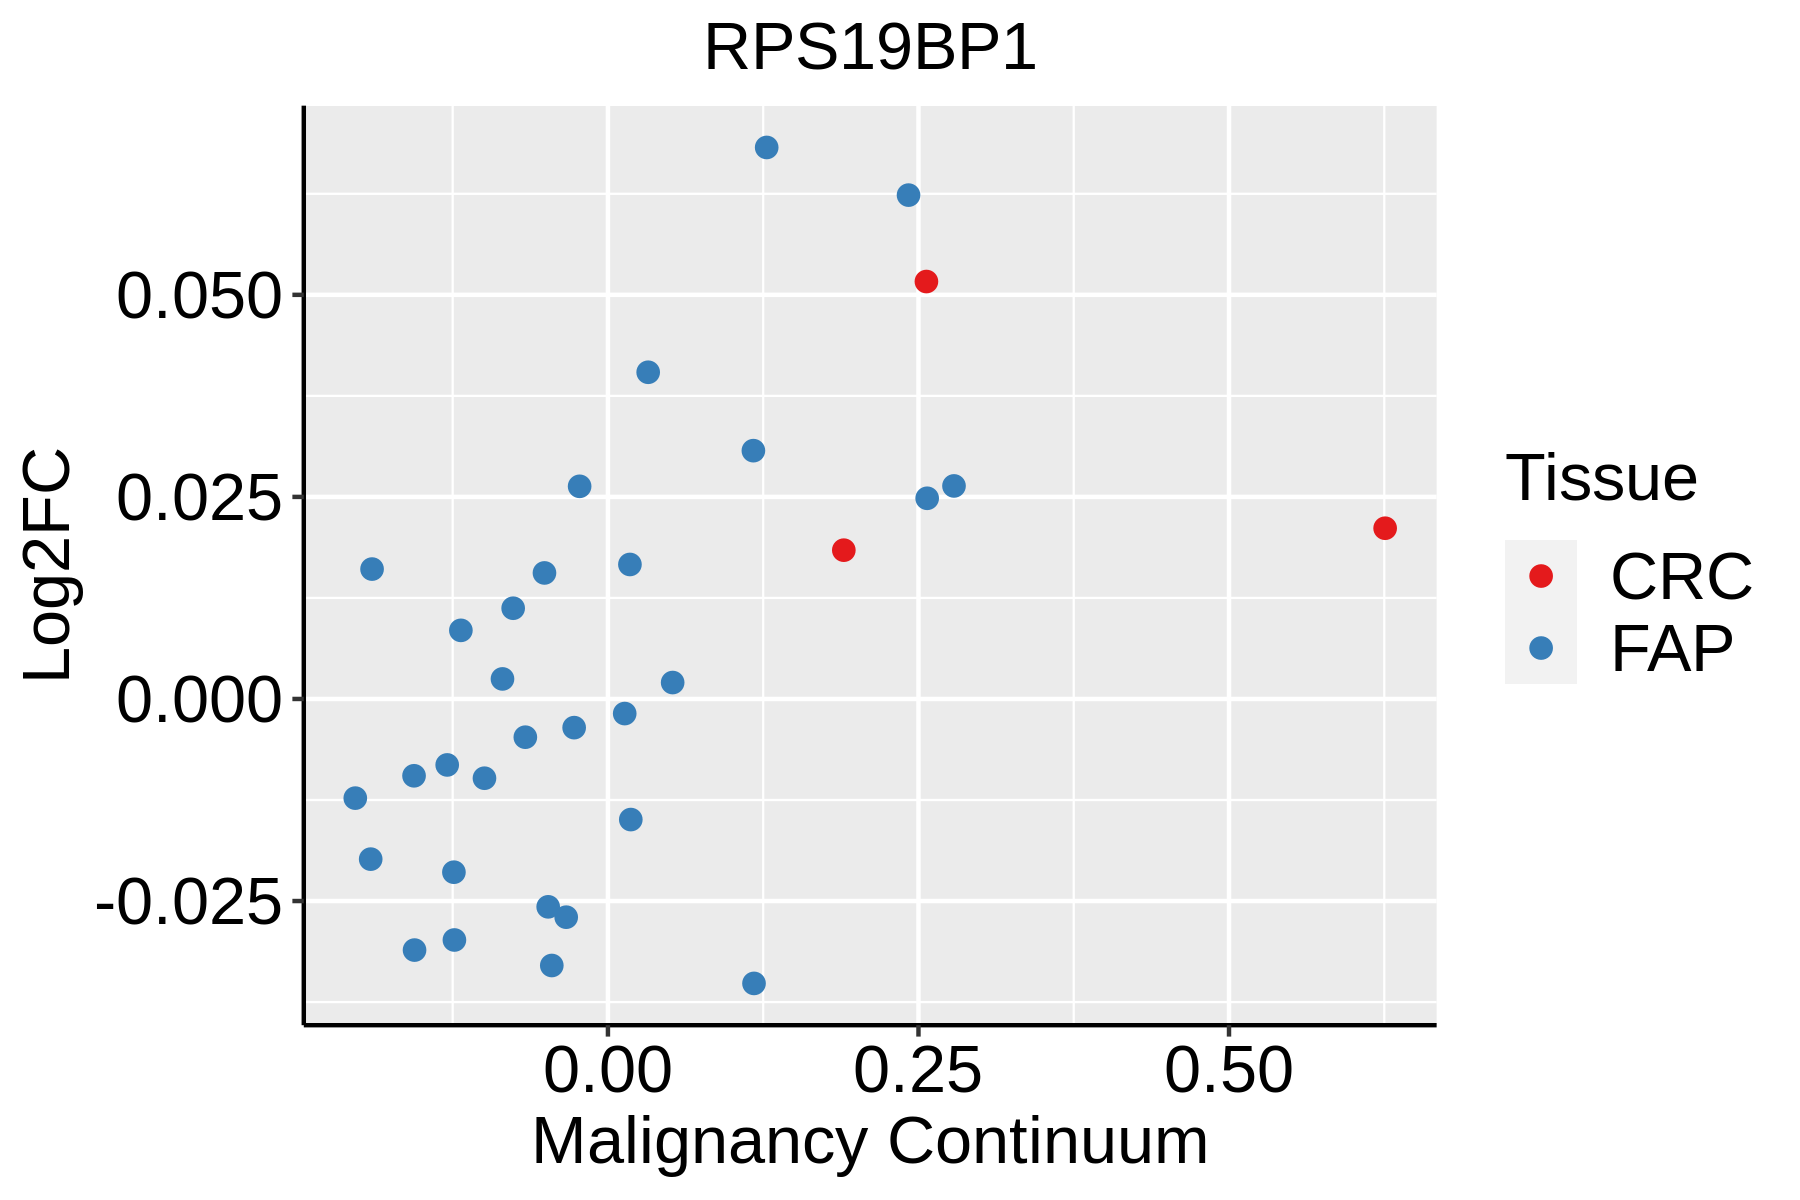 | FAP: Familial adenomatous polyposis |
| CRC: Colorectal cancer | ||
| Colorectum (HTA11) |  | AD: Adenomas |
| SER: Sessile serrated lesions | ||
| MSI-H: Microsatellite-high colorectal cancer | ||
| MSS: Microsatellite stable colorectal cancer | ||
| Endometrium |  | AEH: Atypical endometrial hyperplasia |
| EEC: Endometrioid Cancer | ||
| Esophagus | 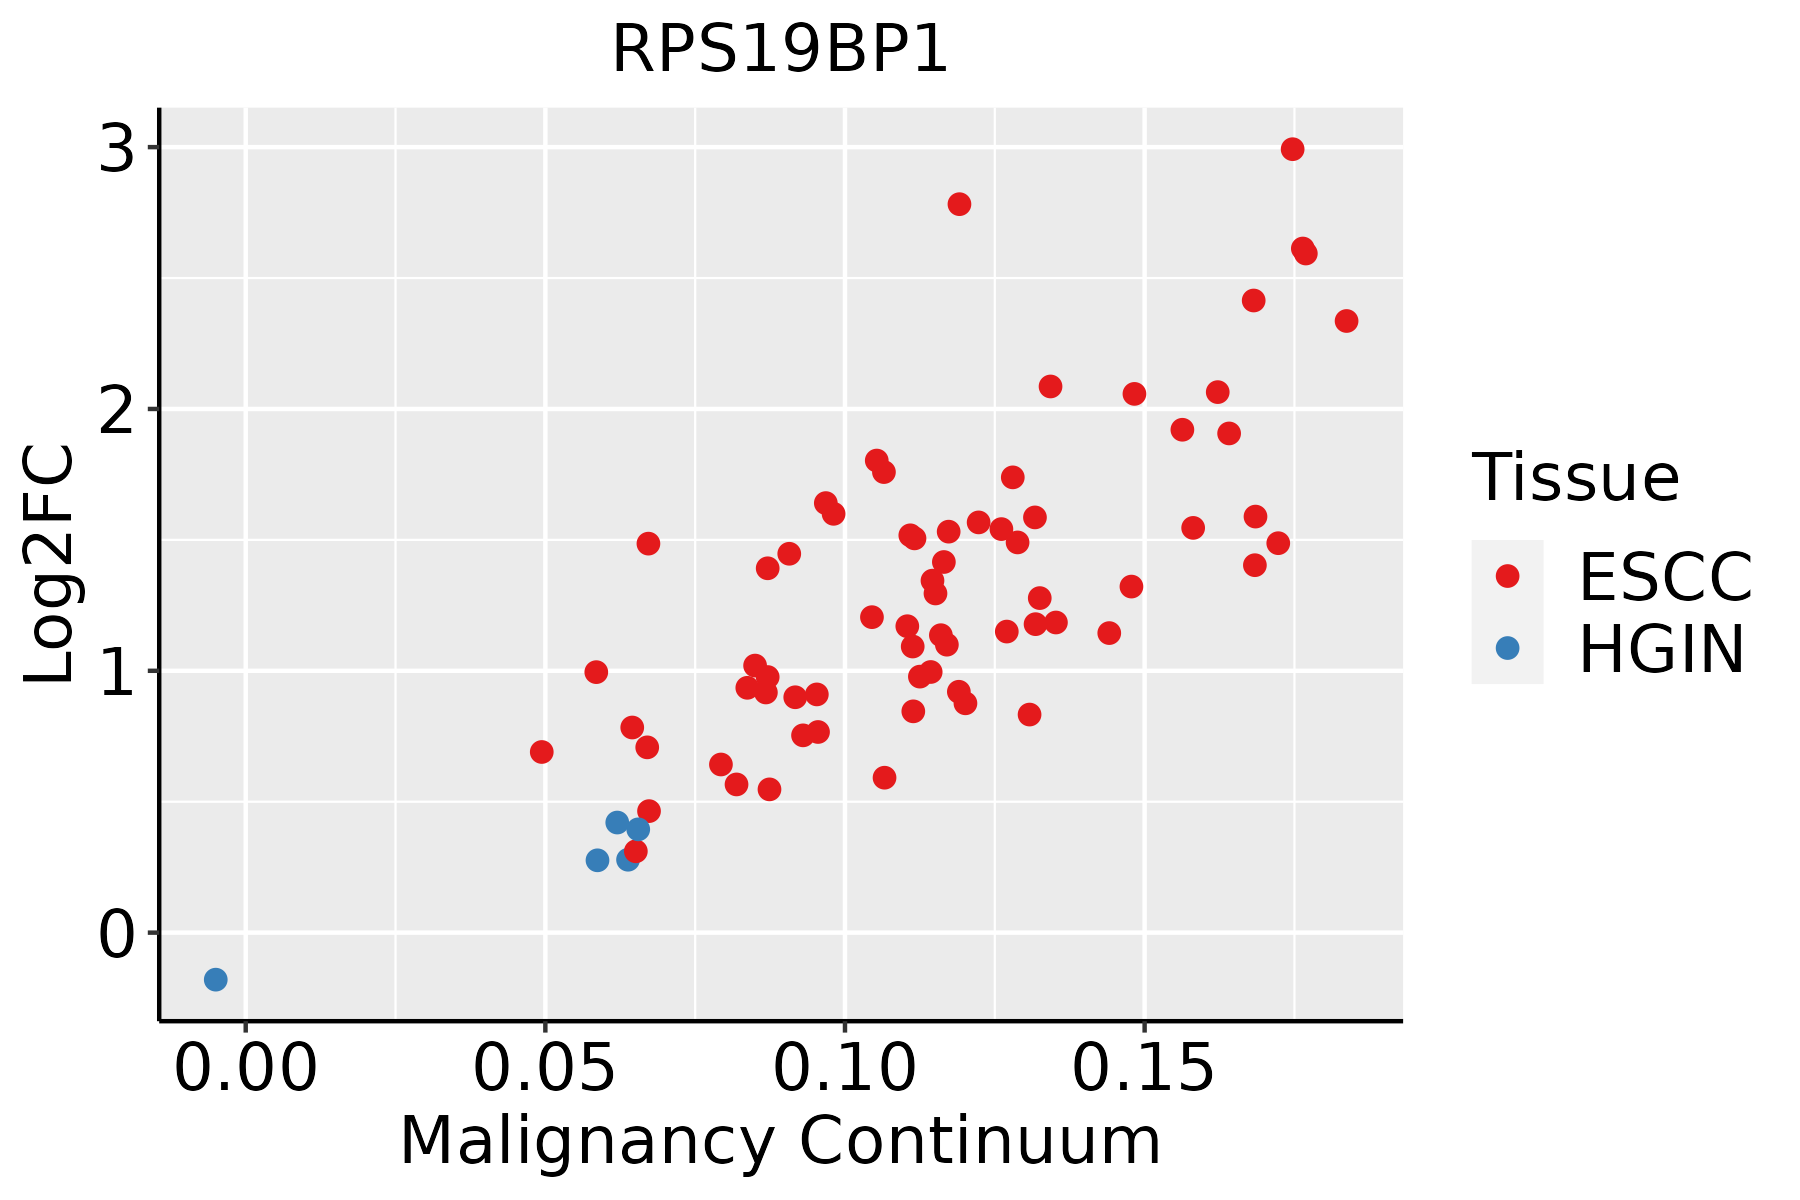 | ESCC: Esophageal squamous cell carcinoma |
| HGIN: High-grade intraepithelial neoplasias | ||
| LGIN: Low-grade intraepithelial neoplasias | ||
| GC | 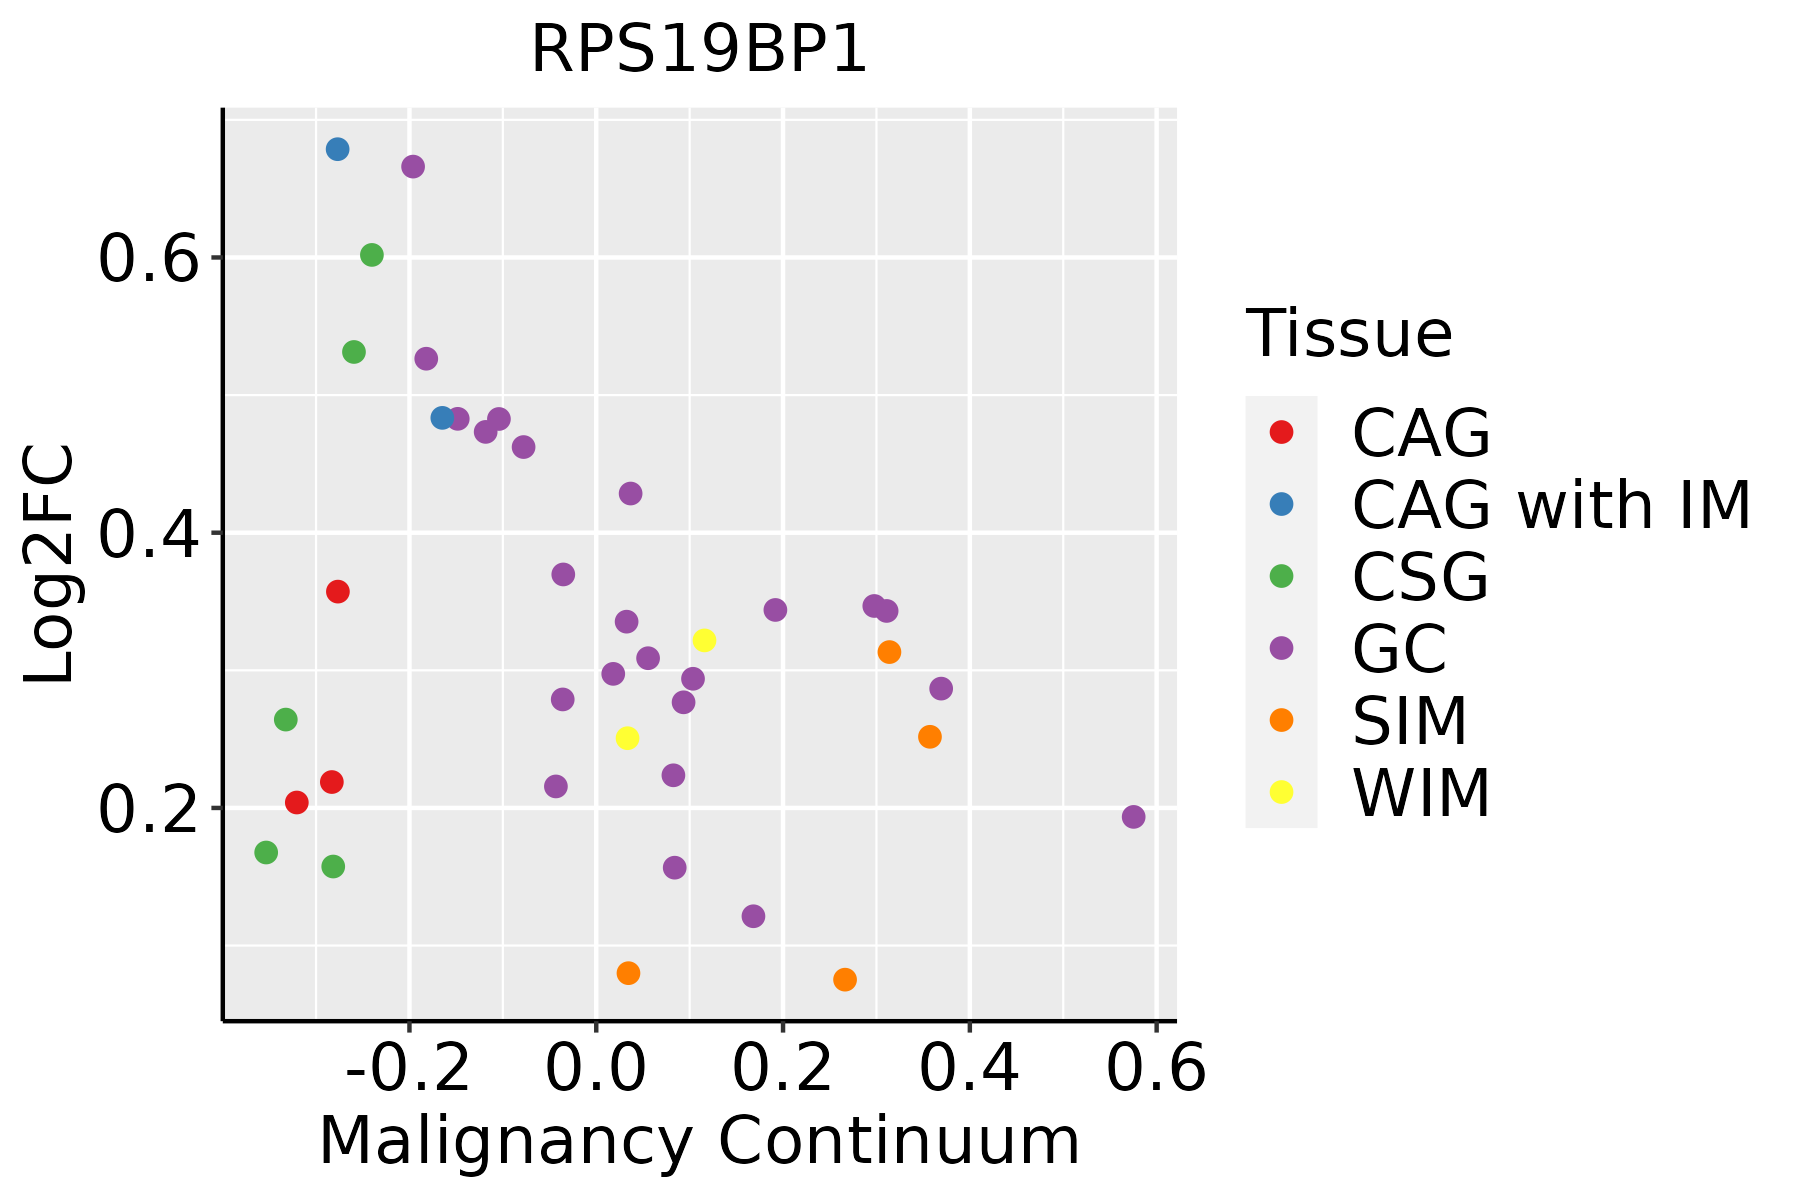 | CAG: Chronic atrophic gastritis |
| CAG with IM: Chronic atrophic gastritis with intestinal metaplasia | ||
| CSG: Chronic superficial gastritis | ||
| GC: Gastric cancer | ||
| SIM: Severe intestinal metaplasia | ||
| WIM: Wild intestinal metaplasia | ||
| Liver |  | HCC: Hepatocellular carcinoma |
| NAFLD: Non-alcoholic fatty liver disease | ||
| Oral Cavity | 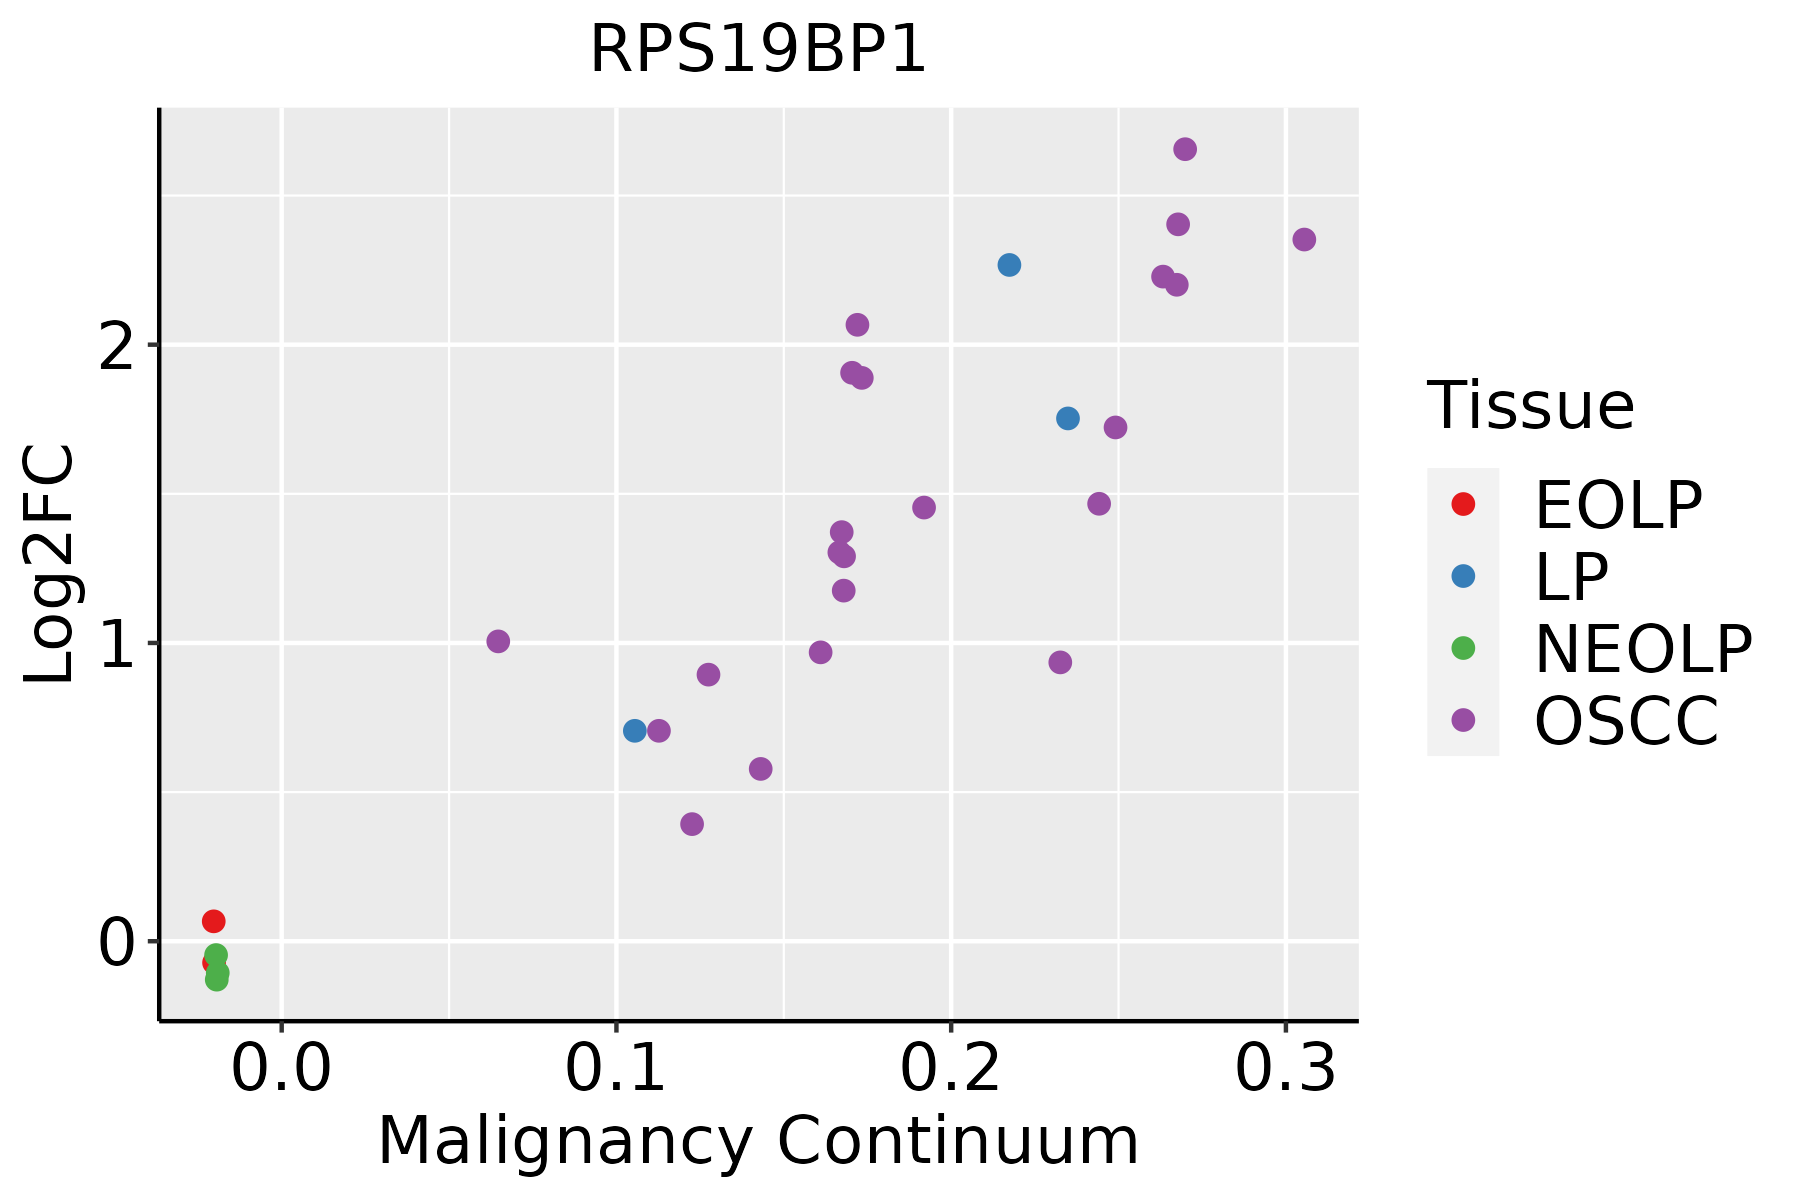 | EOLP: Erosive Oral lichen planus |
| LP: leukoplakia | ||
| NEOLP: Non-erosive oral lichen planus | ||
| OSCC: Oral squamous cell carcinoma | ||
| Prostate | 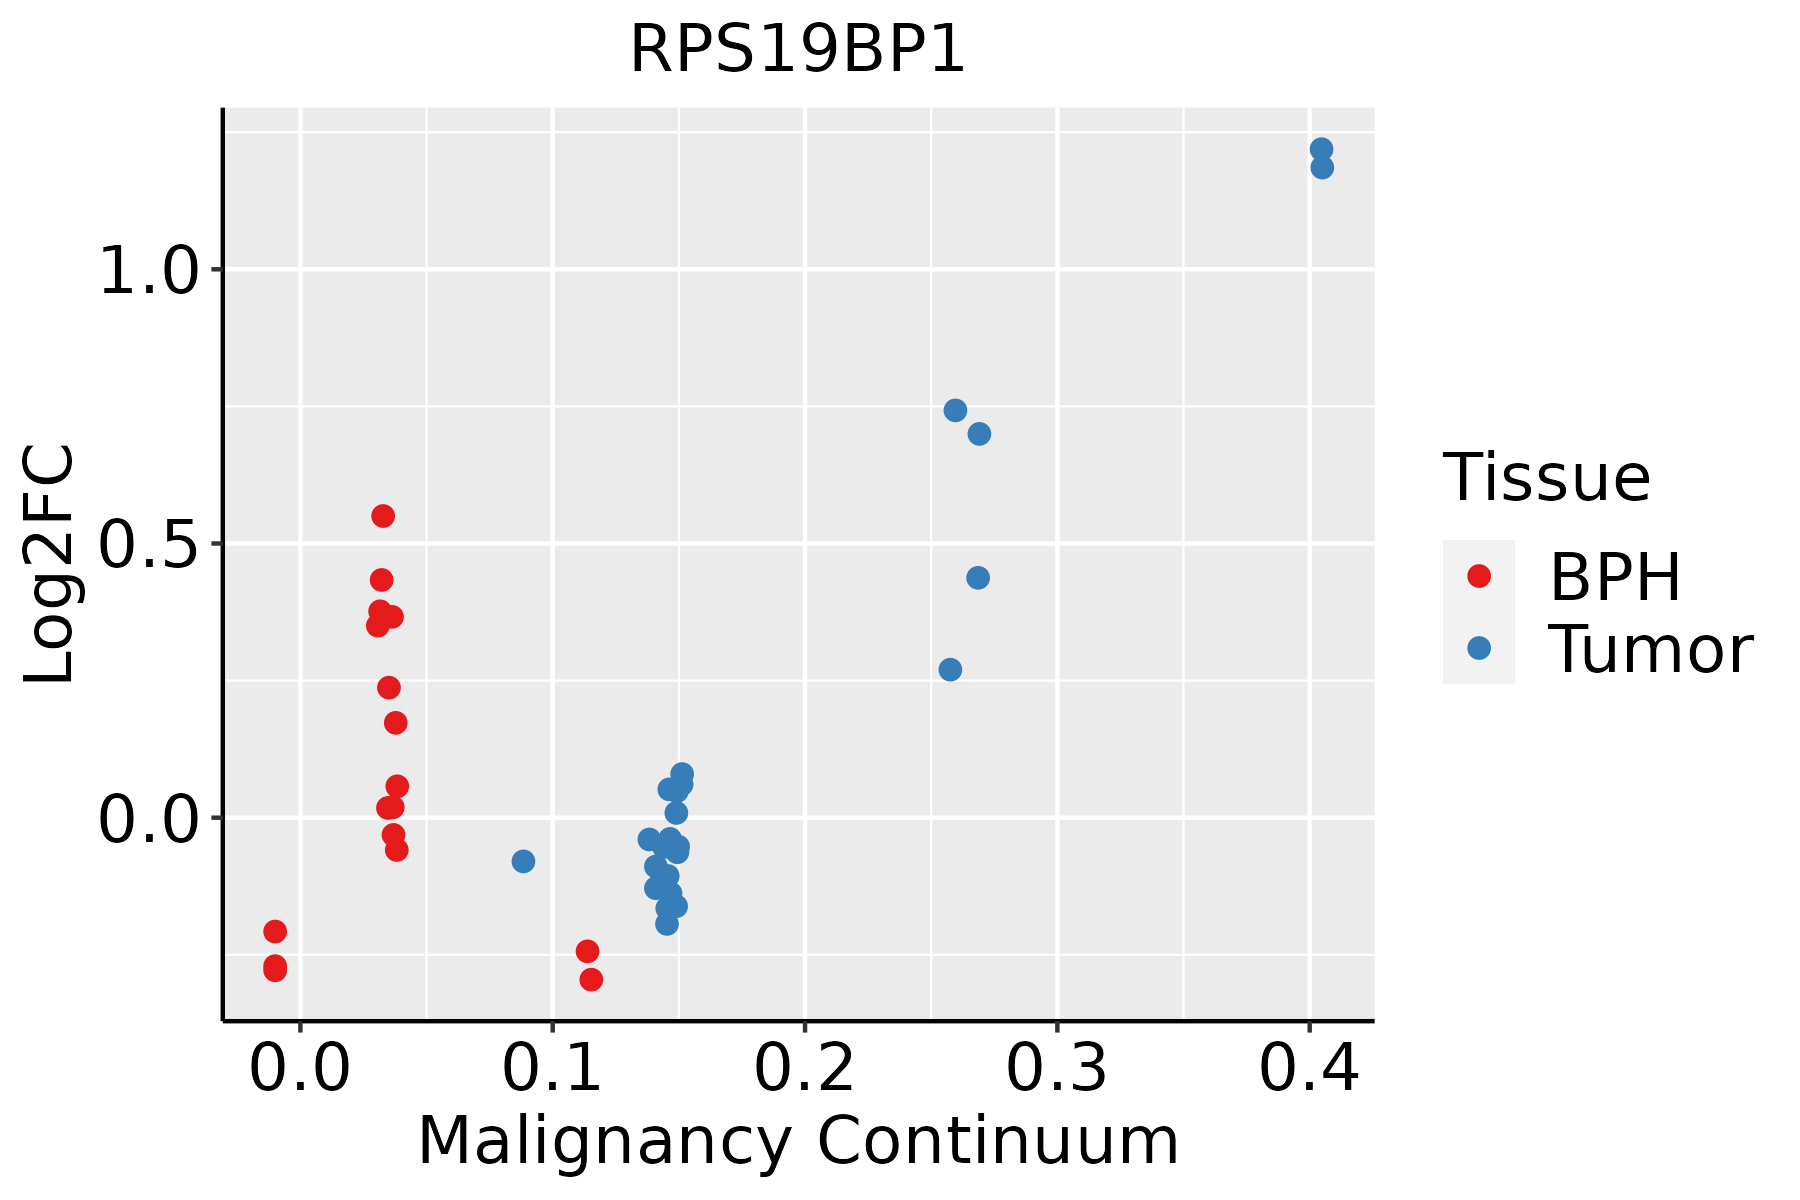 | BPH: Benign Prostatic Hyperplasia |
| Skin |  | AK: Actinic keratosis |
| cSCC: Cutaneous squamous cell carcinoma | ||
| SCCIS:squamous cell carcinoma in situ | ||
| Thyroid | 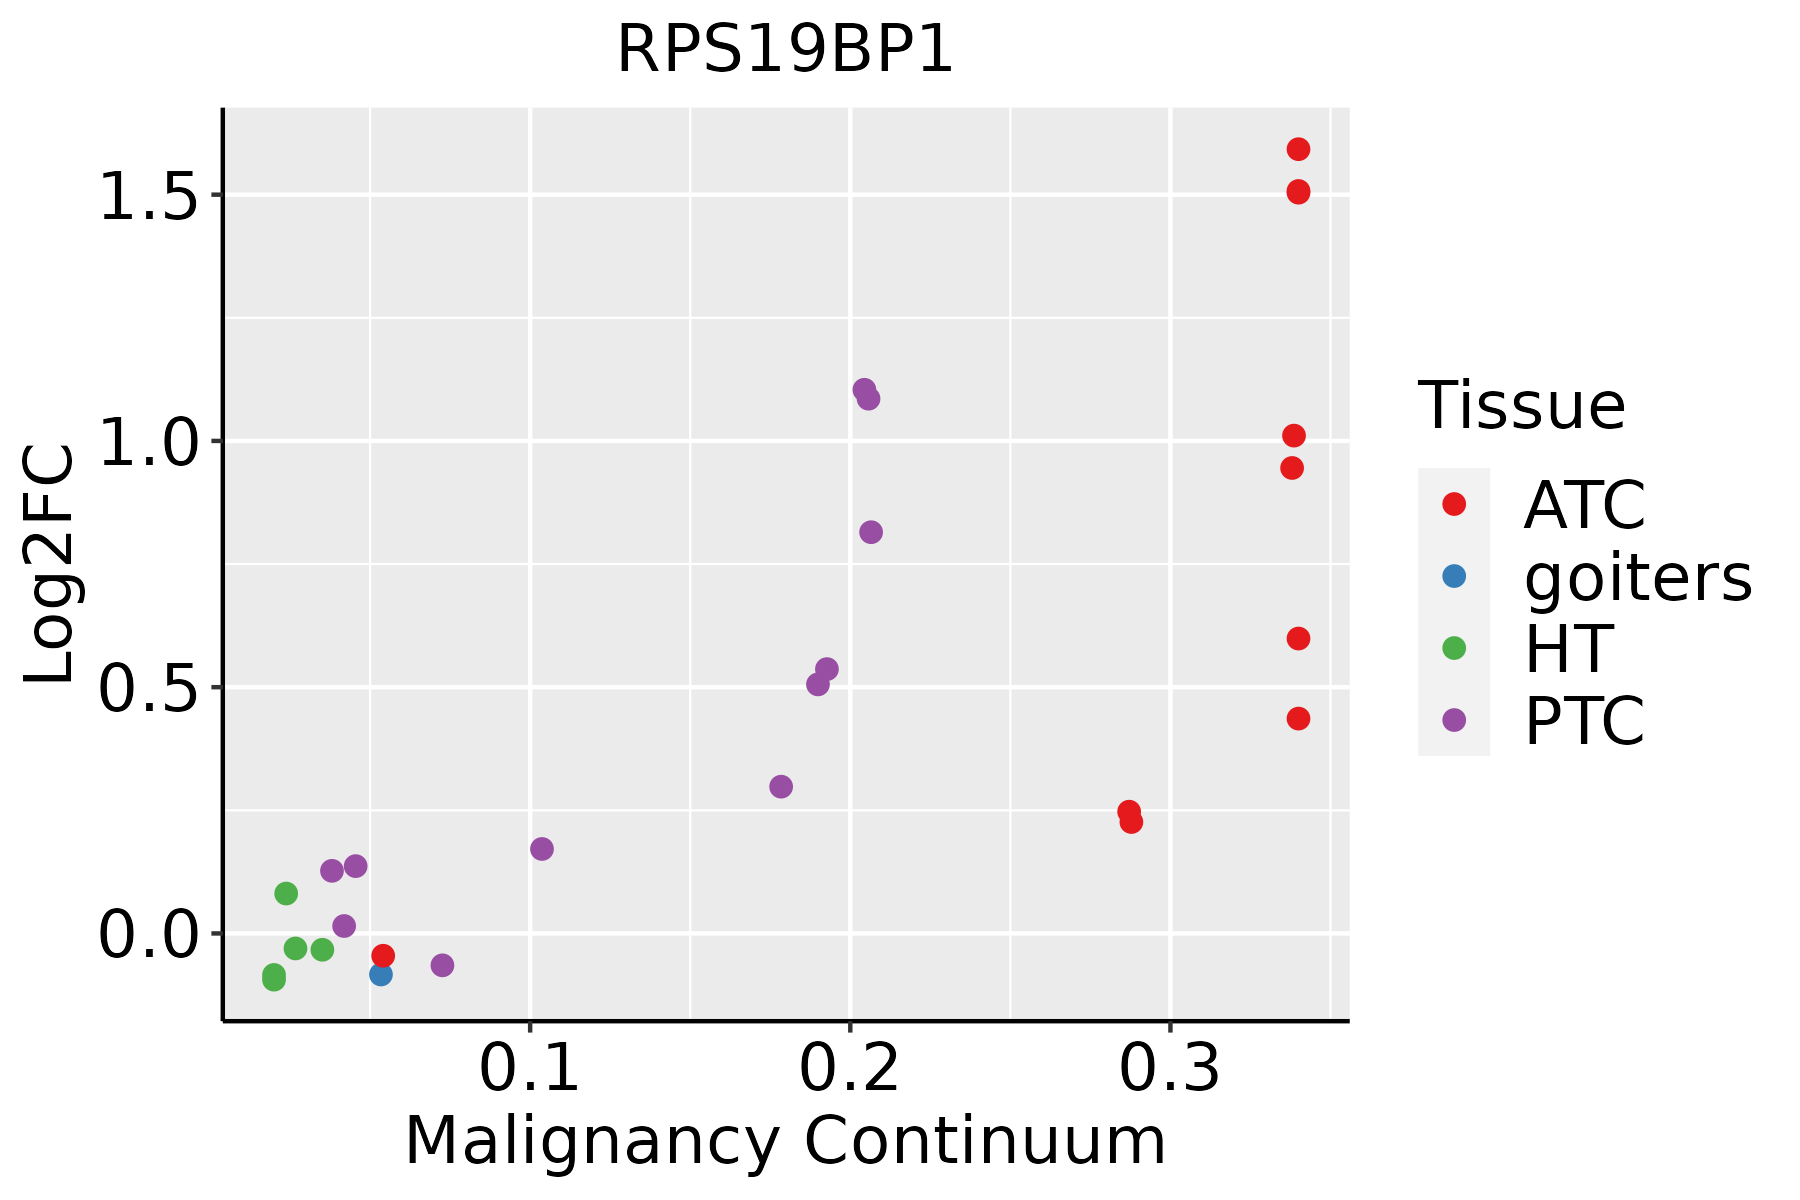 | ATC: Anaplastic thyroid cancer |
| HT: Hashimoto's thyroiditis | ||
| PTC: Papillary thyroid cancer |
| ∗log2FC in expression of this searched gene in stem-like cells from each diseased tissue sample relative to stem-like cells in normal samples in each tissue plotted against the malignancy continuum. Samples are colored based on if they are from different disease stage. |
Top |
Malignant transformation related pathway analysis |
| Find out the enriched GO biological processes and KEGG pathways involved in transition from healthy to precancer to cancer |
| Tissue | Disease Stage | Enriched GO biological Processes |
| Colorectum | AD |  |
| Colorectum | SER |  |
| Colorectum | MSS |  |
| Colorectum | MSI-H |  |
| Colorectum | FAP |  |
| ∗Top 15 enriched GO BP terms are showed in the bar plot of each disease state in each tissue. Each row represents a significant GO biological process which is colored according to the -log10(p.adjust). |
| Page: 1 2 3 4 5 6 7 8 9 |
| GO ID | Tissue | Disease Stage | Description | Gene Ratio | Bg Ratio | pvalue | p.adjust | Count |
| Page: 1 |
| Pathway ID | Tissue | Disease Stage | Description | Gene Ratio | Bg Ratio | pvalue | p.adjust | qvalue | Count |
| Page: 1 |
Top |
Cell-cell communication analysis |
| Identification of potential cell-cell interactions between two cell types and their ligand-receptor pairs for different disease states |
| Ligand | Receptor | LRpair | Pathway | Tissue | Disease Stage |
| Page: 1 |
Top |
Single-cell gene regulatory network inference analysis |
| Find out the significant the regulons (TFs) and the target genes of each regulon across cell types for different disease states |
| TF | Cell Type | Tissue | Disease Stage | Target Gene | RSS | Regulon Activity |
| ∗The dot plots of a searched regulon are shown for all cell subpopulations in each disease state of each tissue based on the regulon specific score inferred using pySCENIC and by calculating the average expression. |
| Page: 1 |
Top |
Somatic mutation of malignant transformation related genes |
| Annotation of somatic variants for genes involved in malignant transformation |
| Hugo Symbol | Variant Class | Variant Classification | dbSNP RS | HGVSc | HGVSp | HGVSp Short | SWISSPROT | BIOTYPE | SIFT | PolyPhen | Tumor Sample Barcode | Tissue | Histology | Sex | Age | Stage | Therapy Types | Drugs | Outcome |
| RPS19BP1 | SNV | Missense_Mutation | novel | c.135N>C | p.Gln45His | p.Q45H | Q86WX3 | protein_coding | tolerated(0.11) | benign(0.281) | TCGA-JW-A5VL-01 | Cervix | cervical & endocervical cancer | Female | <65 | I/II | Unknown | Unknown | SD |
| RPS19BP1 | SNV | Missense_Mutation | novel | c.306N>T | p.Lys102Asn | p.K102N | Q86WX3 | protein_coding | deleterious(0) | probably_damaging(0.988) | TCGA-AA-3947-01 | Colorectum | colon adenocarcinoma | Female | <65 | I/II | Unknown | Unknown | SD |
| RPS19BP1 | SNV | Missense_Mutation | novel | c.245N>T | p.Thr82Met | p.T82M | Q86WX3 | protein_coding | tolerated(0.15) | benign(0.003) | TCGA-A5-A0G1-01 | Endometrium | uterine corpus endometrioid carcinoma | Female | >=65 | I/II | Unknown | Unknown | SD |
| Page: 1 |
Top |
Related drugs of malignant transformation related genes |
| Identification of chemicals and drugs interact with genes involved in malignant transfromation |
| (DGIdb 4.0) |
| Entrez ID | Symbol | Category | Interaction Types | Drug Claim Name | Drug Name | PMIDs |
| Page: 1 |

Copyright 2023-Present -The University of Texas Health Science Center at Houston |