| Tissue | Expression Dynamics | Abbreviation |
| Breast | 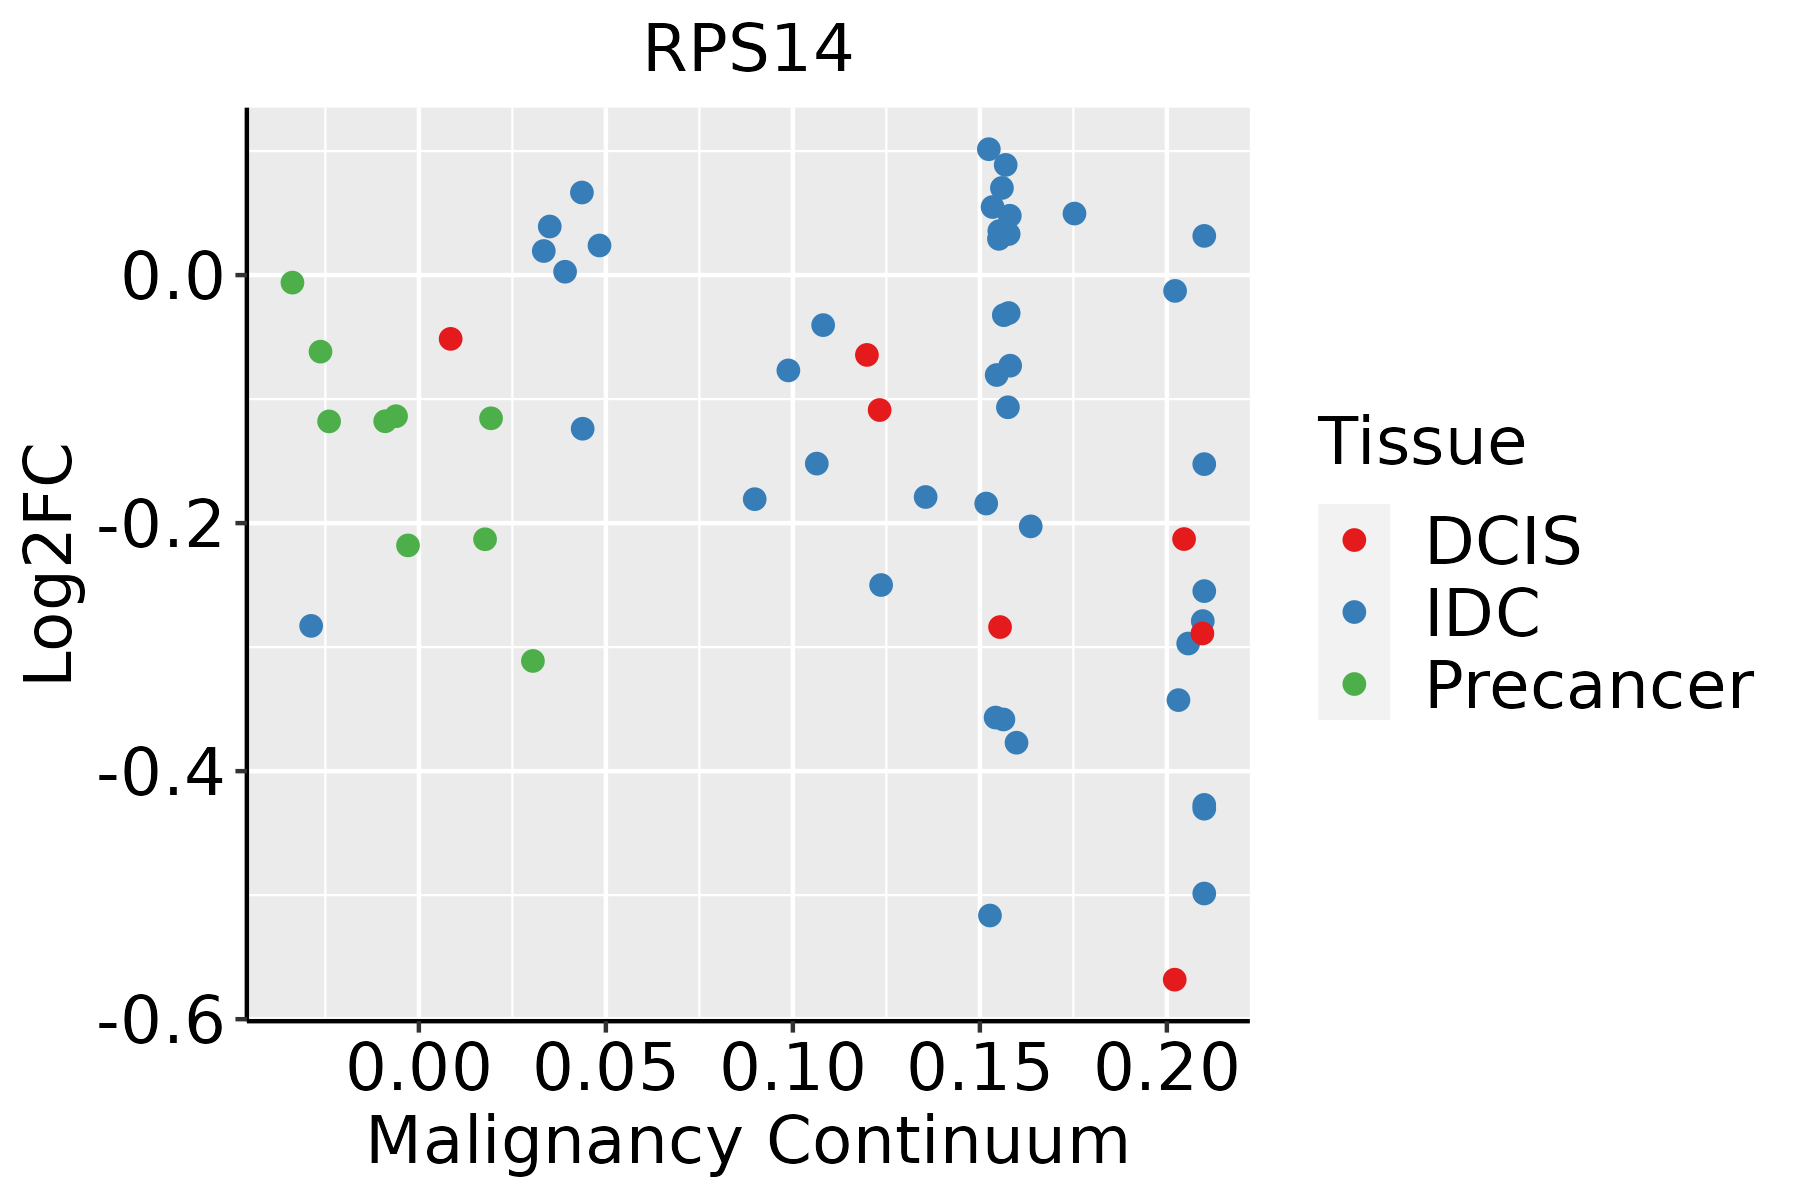 | IDC: Invasive ductal carcinoma |
| DCIS: Ductal carcinoma in situ |
| Precancer(BRCA1-mut): Precancerous lesion from BRCA1 mutation carriers |
| Cervix | 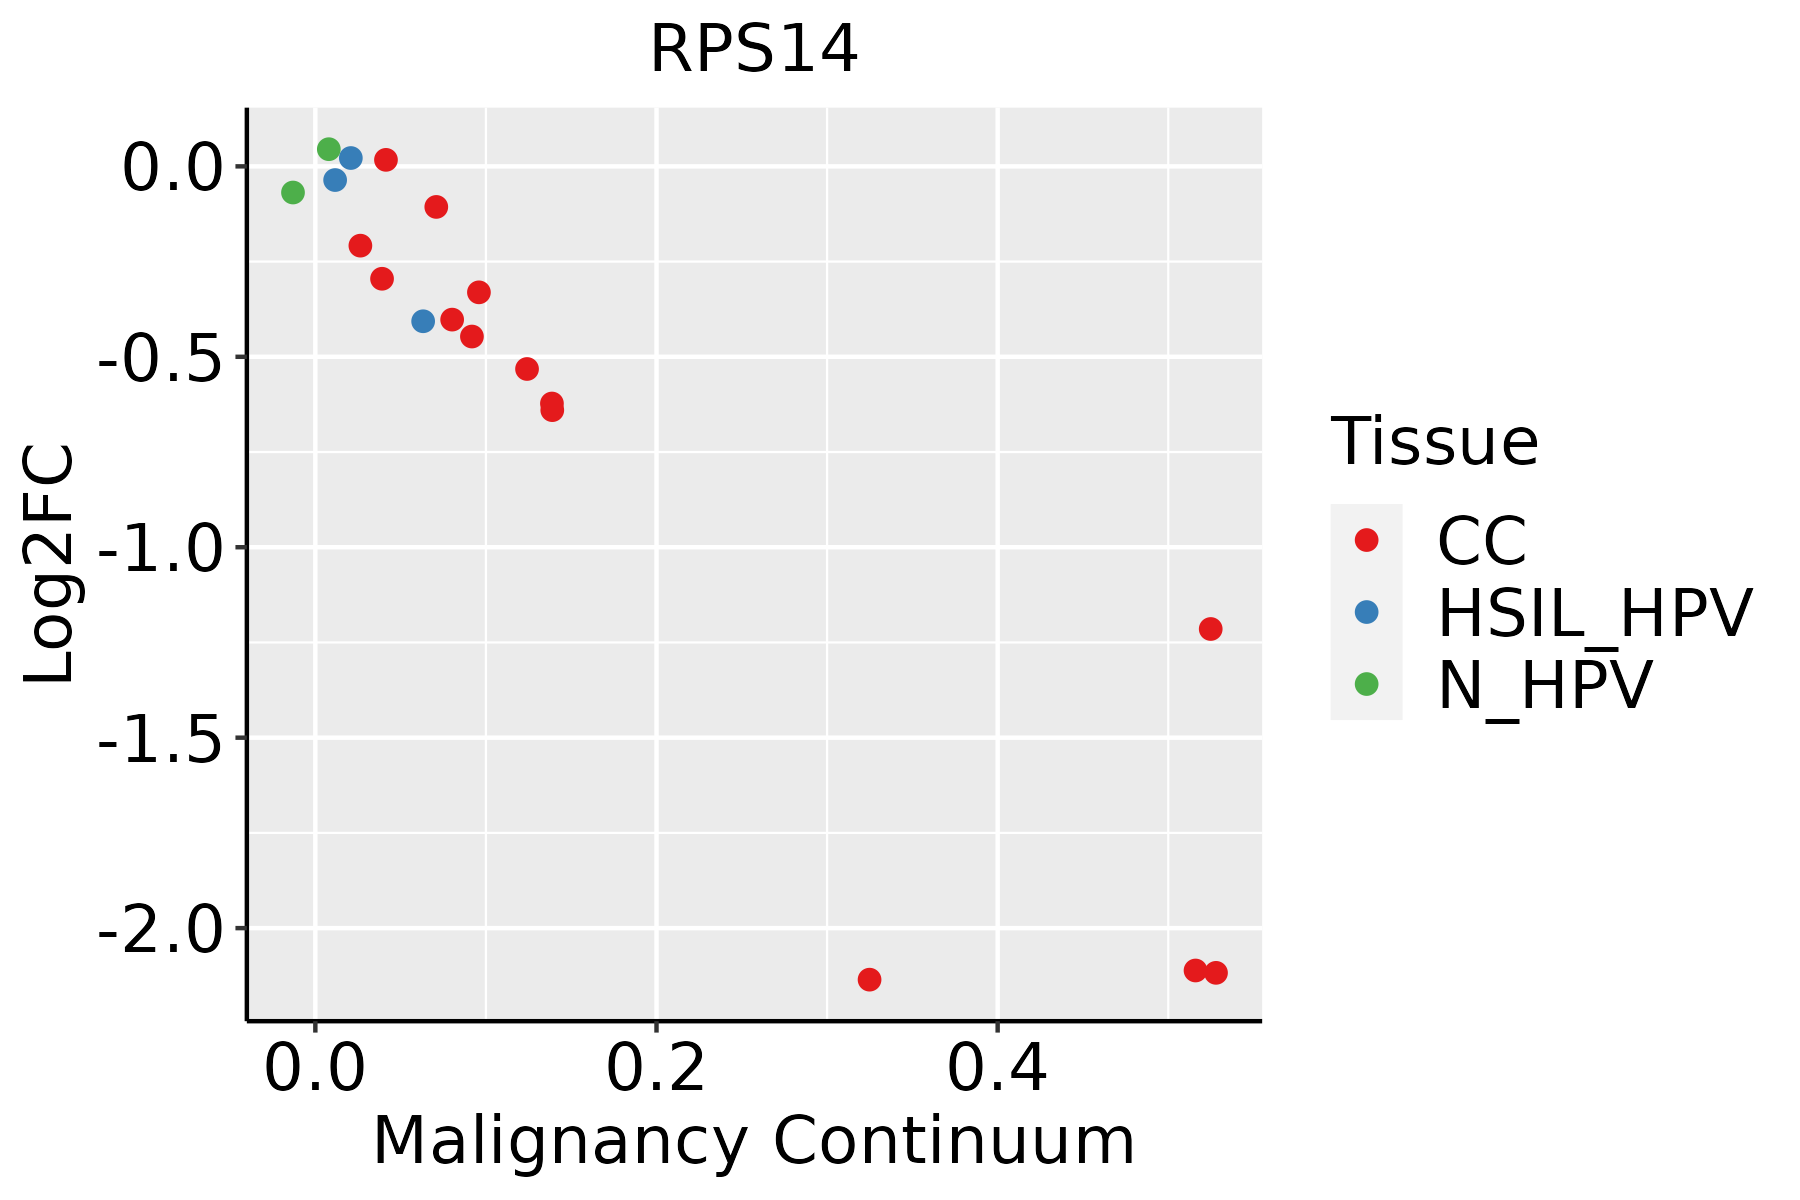 | CC: Cervix cancer |
| HSIL_HPV: HPV-infected high-grade squamous intraepithelial lesions |
| N_HPV: HPV-infected normal cervix |
| Colorectum (GSE201348) |  | FAP: Familial adenomatous polyposis |
| CRC: Colorectal cancer |
| Colorectum (HTA11) |  | AD: Adenomas |
| SER: Sessile serrated lesions |
| MSI-H: Microsatellite-high colorectal cancer |
| MSS: Microsatellite stable colorectal cancer |
| Endometrium | 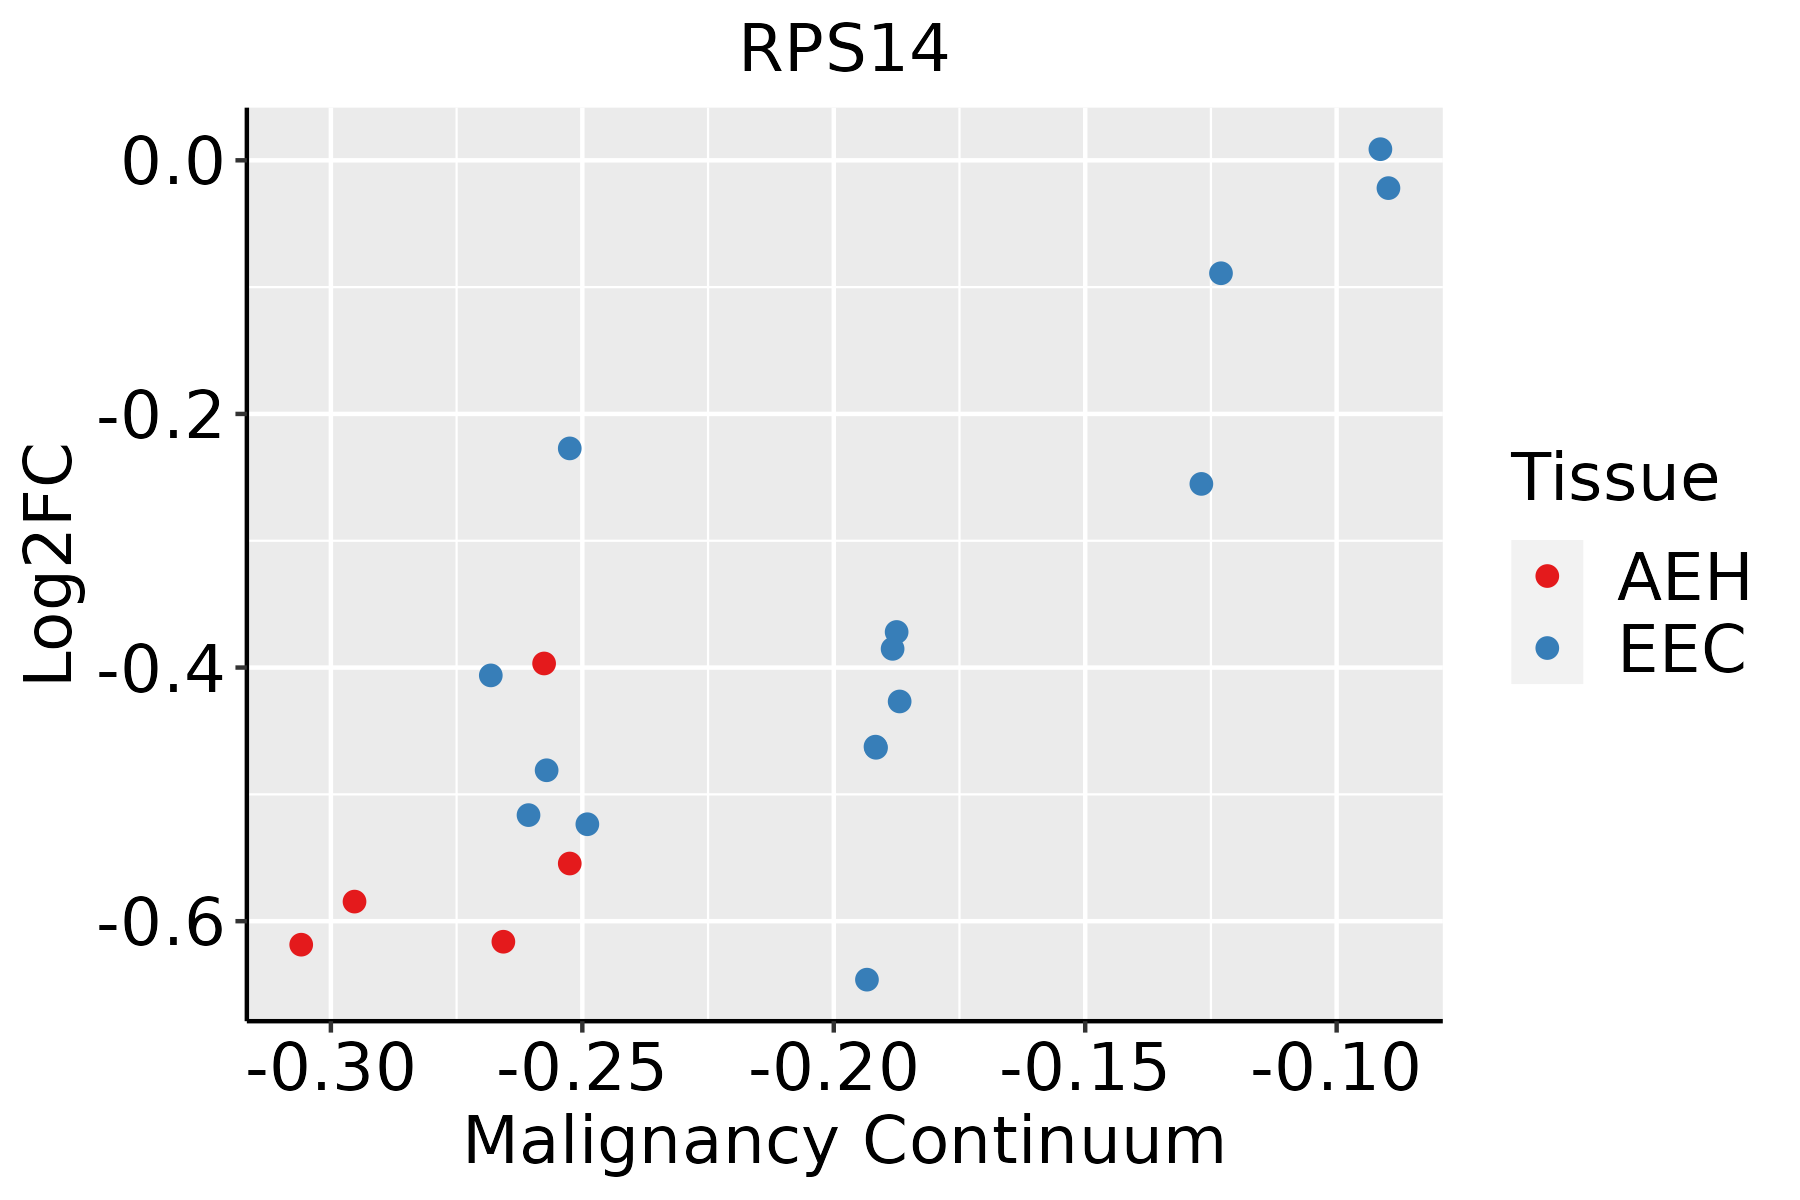 | AEH: Atypical endometrial hyperplasia |
| EEC: Endometrioid Cancer |
| Esophagus |  | ESCC: Esophageal squamous cell carcinoma |
| HGIN: High-grade intraepithelial neoplasias |
| LGIN: Low-grade intraepithelial neoplasias |
| GC | 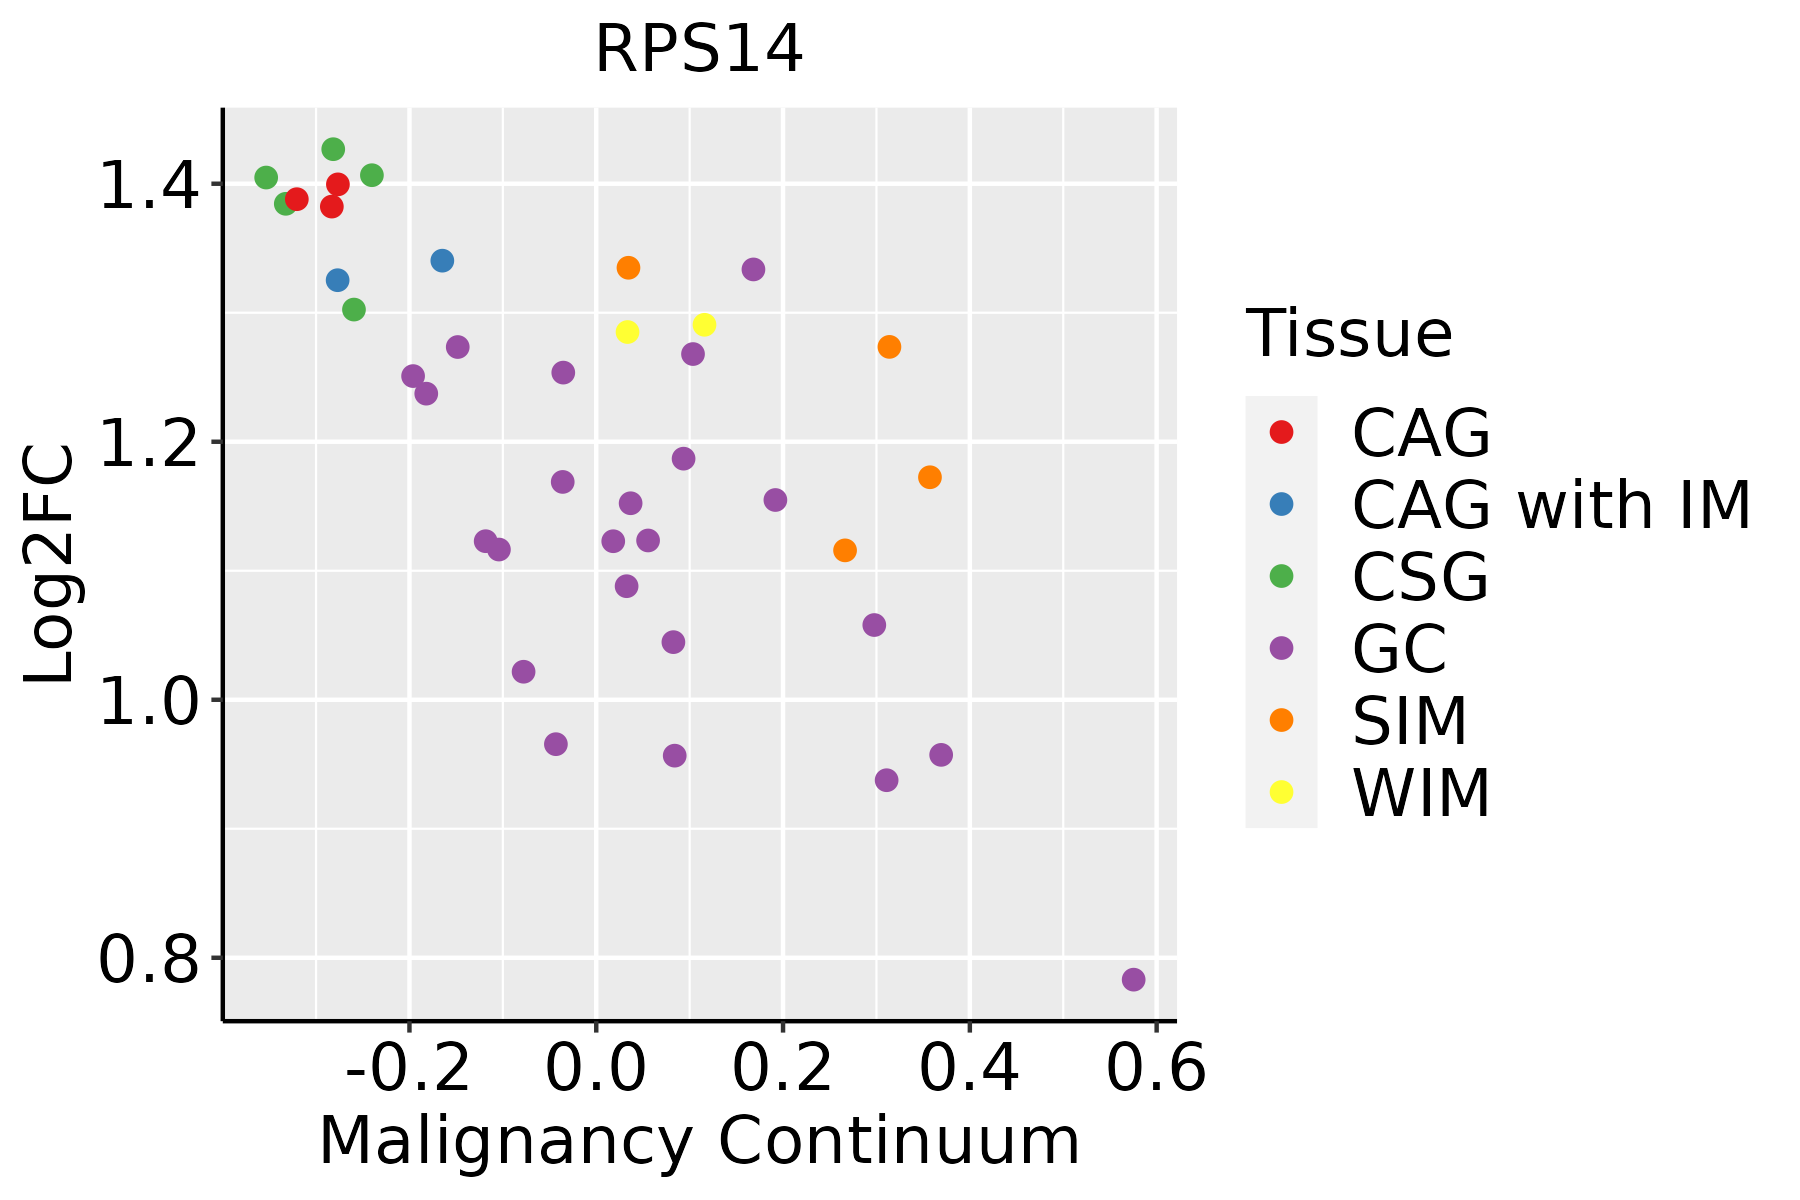 | CAG: Chronic atrophic gastritis |
| CAG with IM: Chronic atrophic gastritis with intestinal metaplasia |
| CSG: Chronic superficial gastritis |
| GC: Gastric cancer |
| SIM: Severe intestinal metaplasia |
| WIM: Wild intestinal metaplasia |
| Liver |  | HCC: Hepatocellular carcinoma |
| NAFLD: Non-alcoholic fatty liver disease |
| Lung | 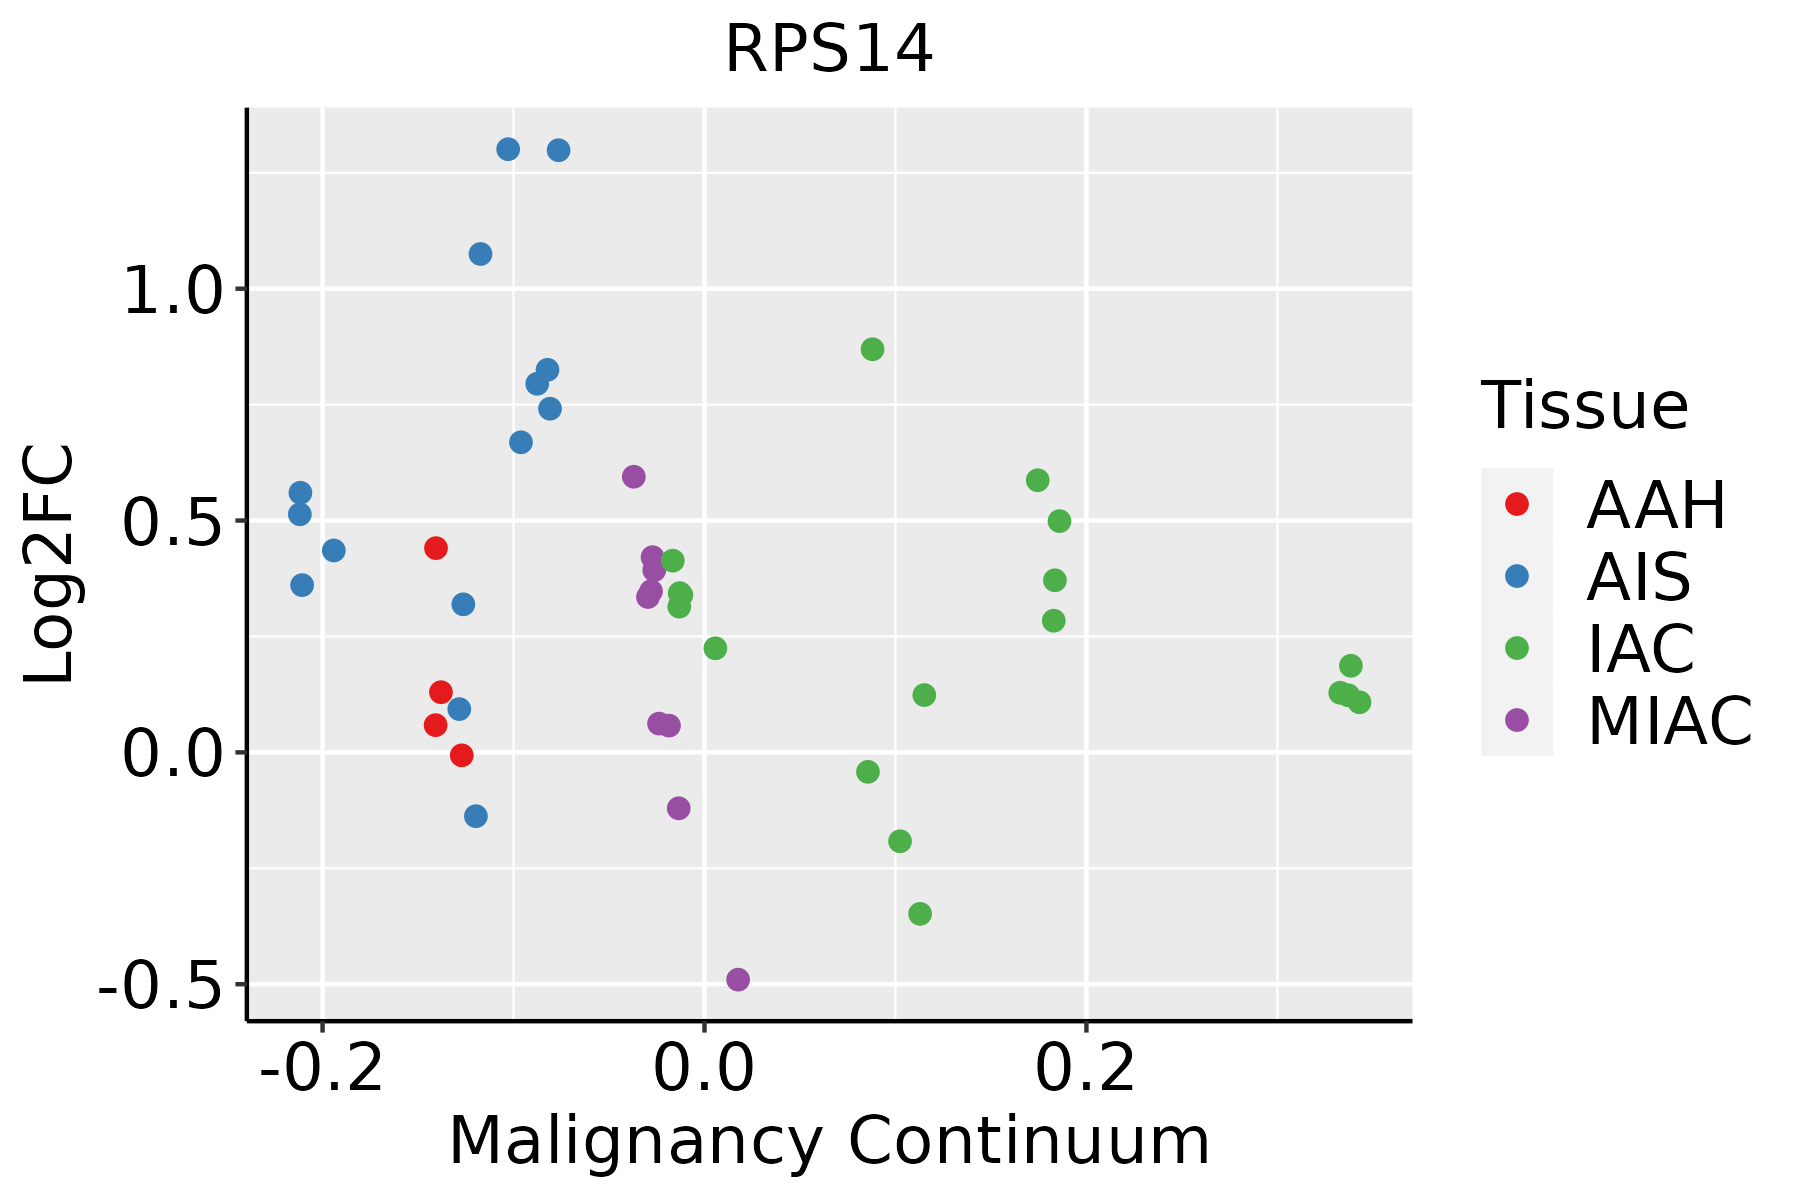 | AAH: Atypical adenomatous hyperplasia |
| AIS: Adenocarcinoma in situ |
| IAC: Invasive lung adenocarcinoma |
| MIA: Minimally invasive adenocarcinoma |
| Oral Cavity | 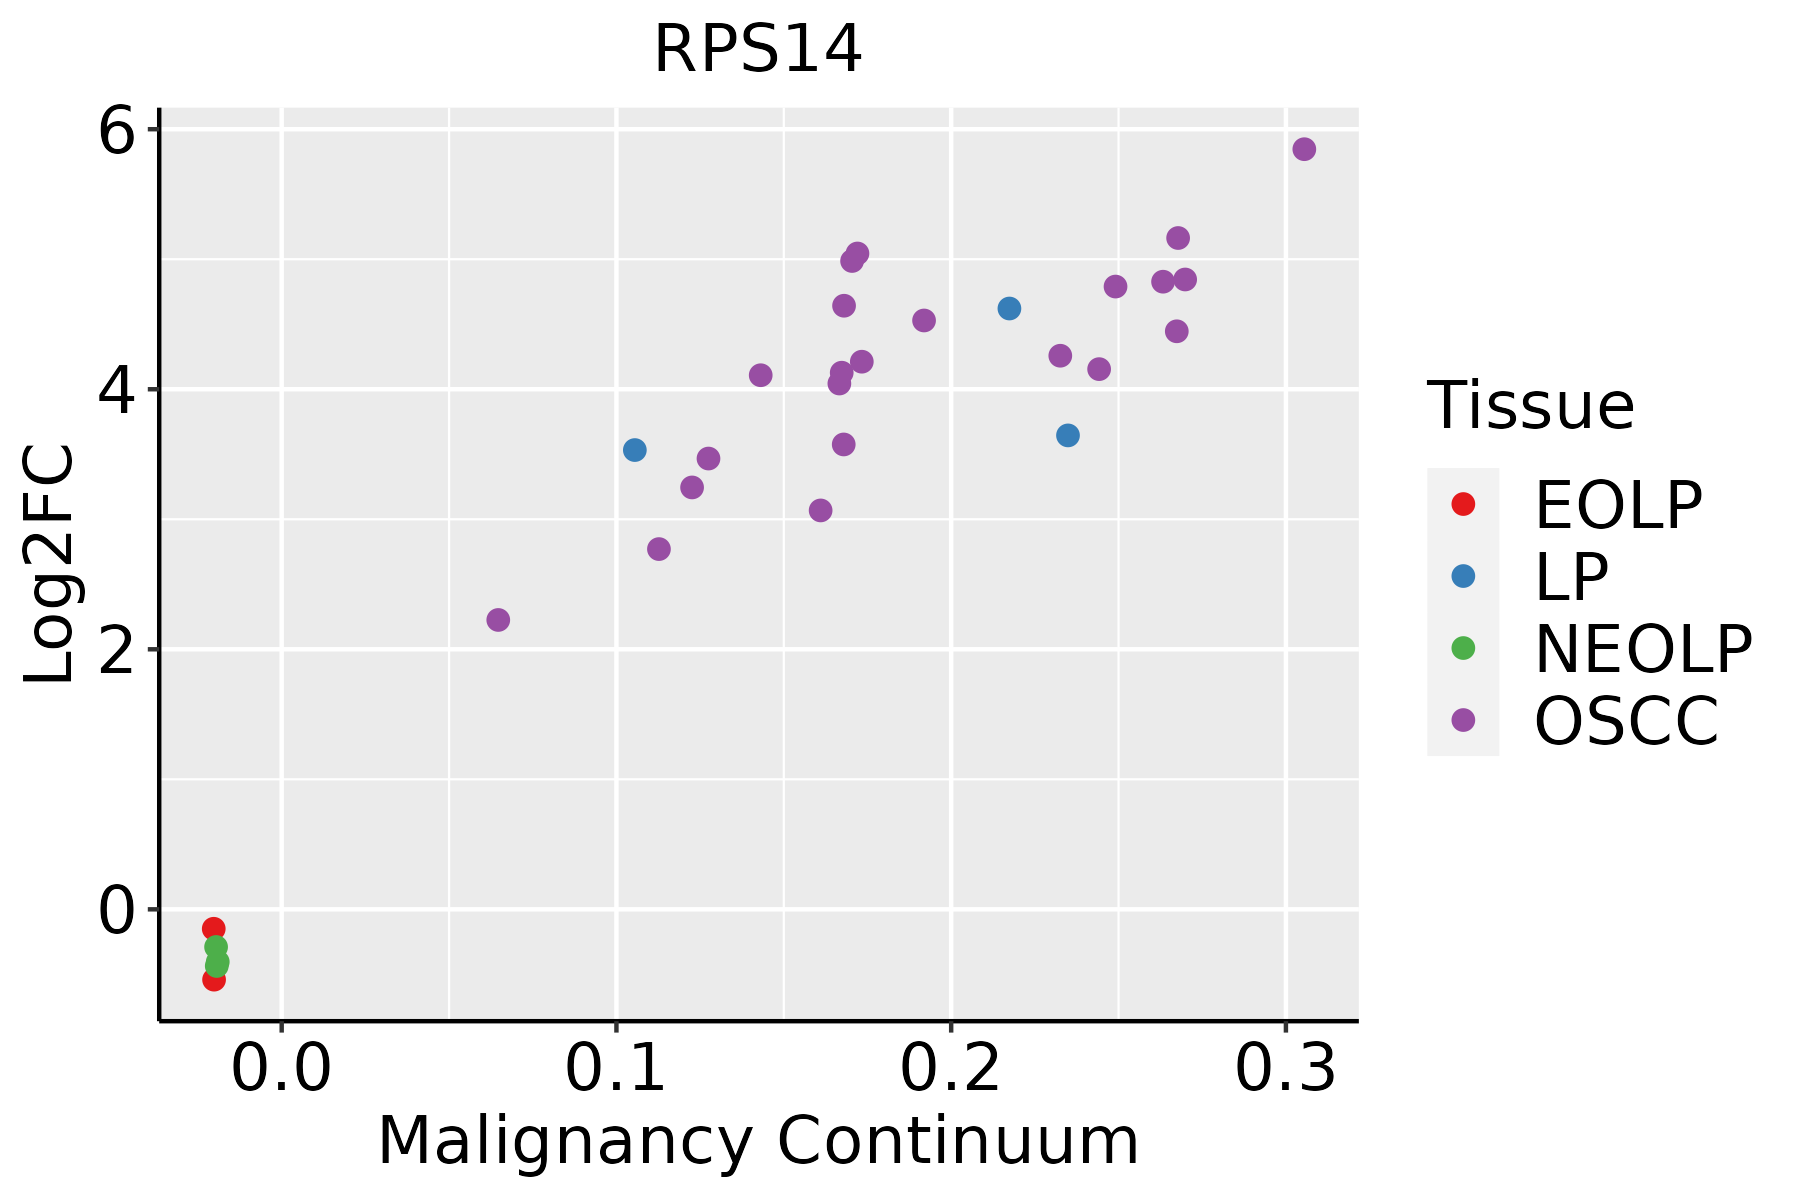 | EOLP: Erosive Oral lichen planus |
| LP: leukoplakia |
| NEOLP: Non-erosive oral lichen planus |
| OSCC: Oral squamous cell carcinoma |
| Prostate | 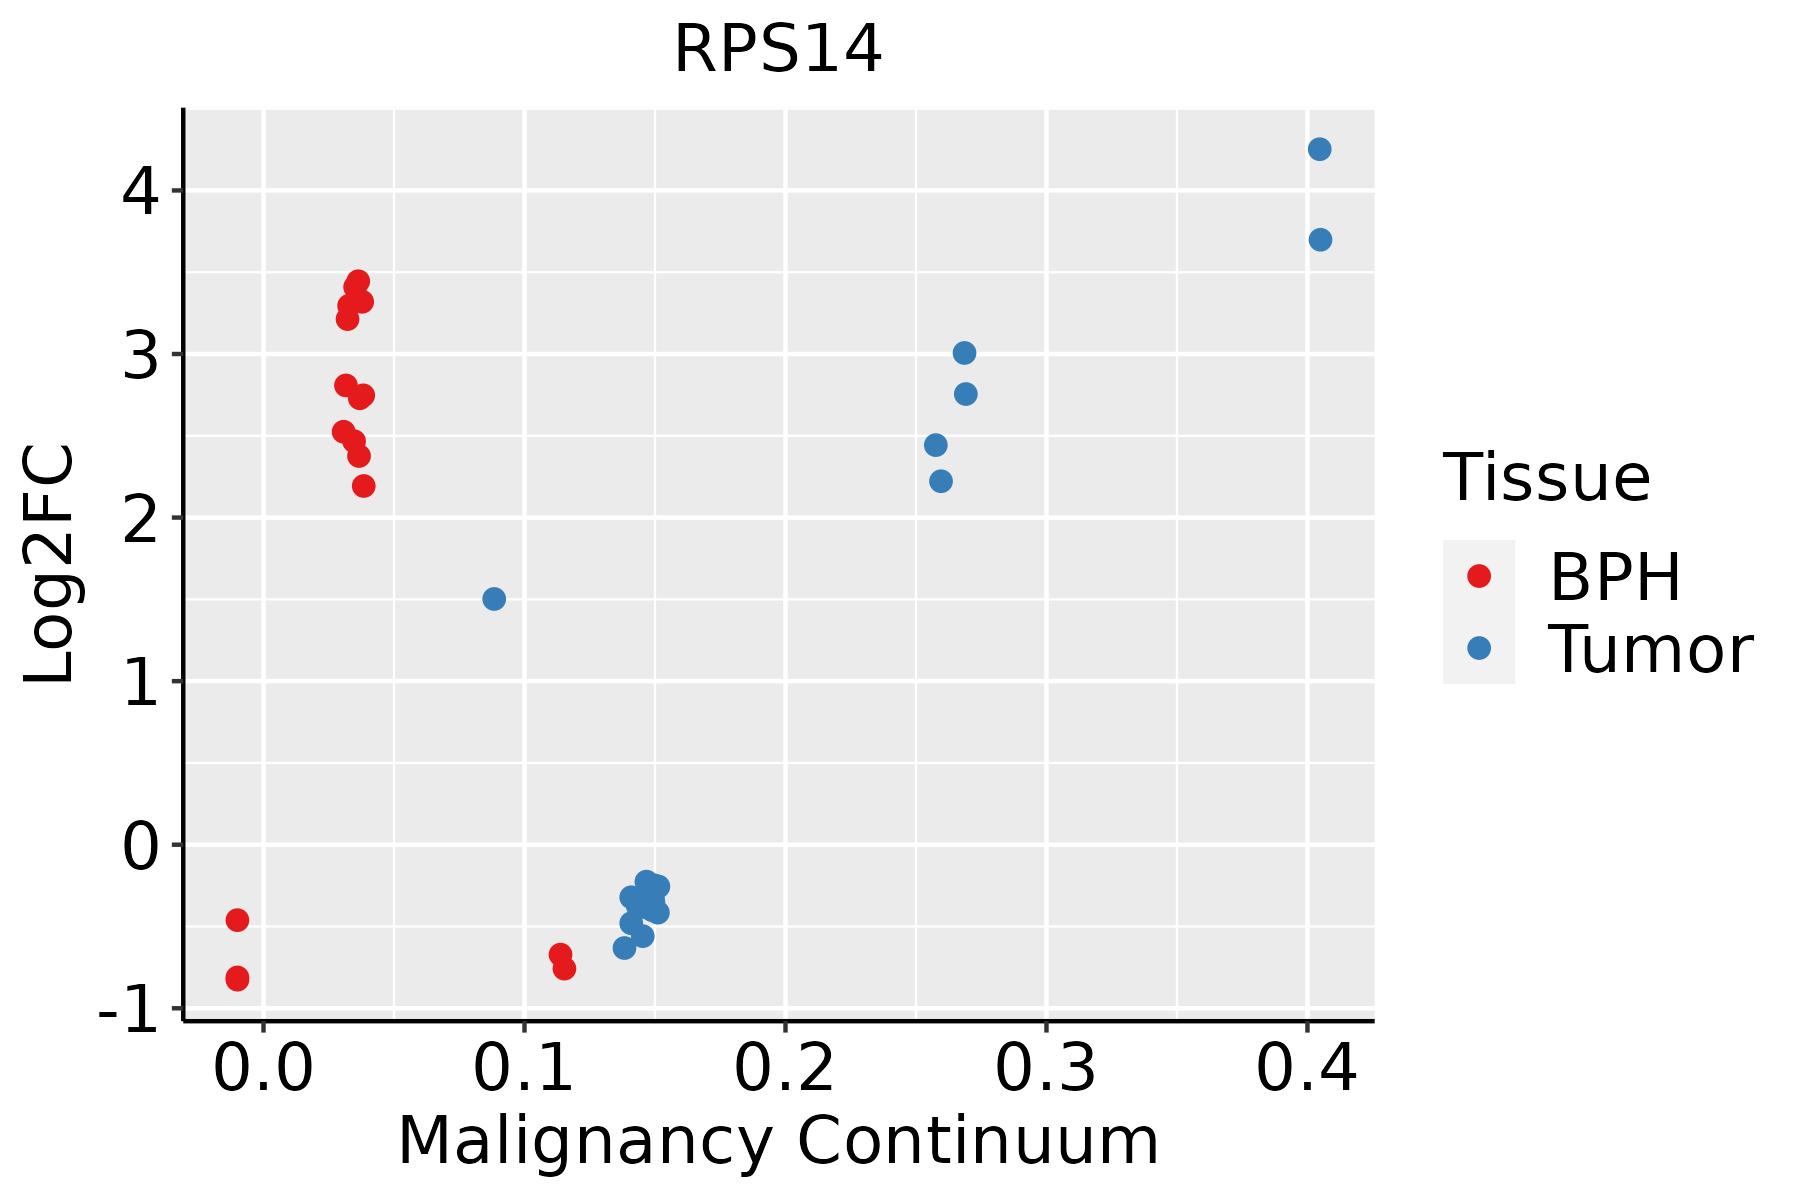 | BPH: Benign Prostatic Hyperplasia |
| Skin | 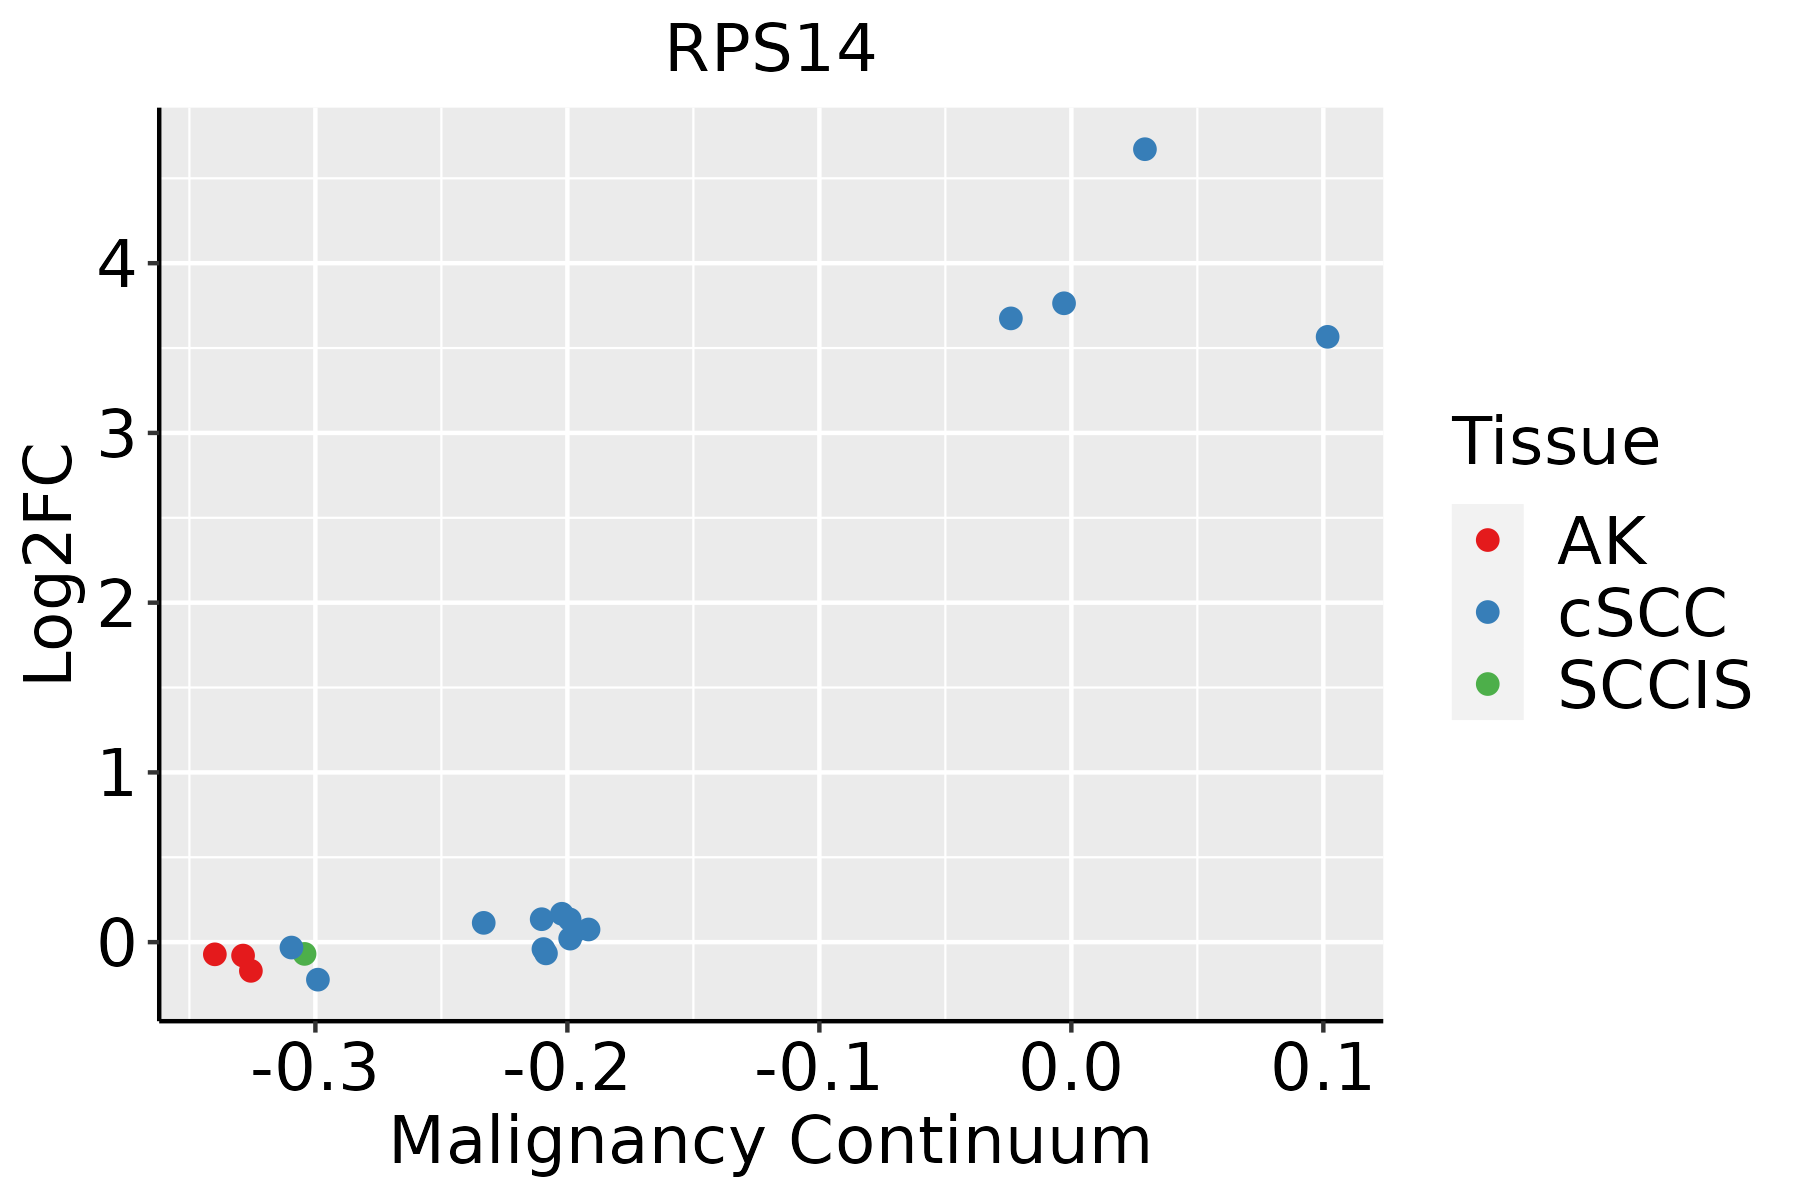 | AK: Actinic keratosis |
| cSCC: Cutaneous squamous cell carcinoma |
| SCCIS:squamous cell carcinoma in situ |
| Thyroid |  | ATC: Anaplastic thyroid cancer |
| HT: Hashimoto's thyroiditis |
| PTC: Papillary thyroid cancer |
| GO ID | Tissue | Disease Stage | Description | Gene Ratio | Bg Ratio | pvalue | p.adjust | Count |
| GO:00021819 | Breast | Precancer | cytoplasmic translation | 80/1080 | 148/18723 | 1.59e-59 | 8.54e-56 | 80 |
| GO:00226139 | Breast | Precancer | ribonucleoprotein complex biogenesis | 79/1080 | 463/18723 | 2.11e-18 | 1.03e-15 | 79 |
| GO:00718269 | Breast | Precancer | ribonucleoprotein complex subunit organization | 48/1080 | 227/18723 | 2.68e-15 | 8.45e-13 | 48 |
| GO:00226189 | Breast | Precancer | ribonucleoprotein complex assembly | 47/1080 | 220/18723 | 3.47e-15 | 1.03e-12 | 47 |
| GO:00422549 | Breast | Precancer | ribosome biogenesis | 52/1080 | 299/18723 | 7.35e-13 | 1.51e-10 | 52 |
| GO:00064179 | Breast | Precancer | regulation of translation | 67/1080 | 468/18723 | 4.71e-12 | 7.64e-10 | 67 |
| GO:00422559 | Breast | Precancer | ribosome assembly | 21/1080 | 61/18723 | 1.06e-11 | 1.53e-09 | 21 |
| GO:00422749 | Breast | Precancer | ribosomal small subunit biogenesis | 21/1080 | 73/18723 | 4.84e-10 | 4.39e-08 | 21 |
| GO:00000289 | Breast | Precancer | ribosomal small subunit assembly | 10/1080 | 19/18723 | 2.24e-08 | 1.50e-06 | 10 |
| GO:00063646 | Breast | Precancer | rRNA processing | 35/1080 | 225/18723 | 7.90e-08 | 4.60e-06 | 35 |
| GO:00160726 | Breast | Precancer | rRNA metabolic process | 36/1080 | 236/18723 | 8.59e-08 | 4.84e-06 | 36 |
| GO:00022629 | Breast | Precancer | myeloid cell homeostasis | 27/1080 | 157/18723 | 3.10e-07 | 1.49e-05 | 27 |
| GO:00341019 | Breast | Precancer | erythrocyte homeostasis | 23/1080 | 129/18723 | 1.20e-06 | 4.60e-05 | 23 |
| GO:00300999 | Breast | Precancer | myeloid cell differentiation | 45/1080 | 381/18723 | 4.00e-06 | 1.25e-04 | 45 |
| GO:00344705 | Breast | Precancer | ncRNA processing | 42/1080 | 395/18723 | 9.91e-05 | 1.83e-03 | 42 |
| GO:00488729 | Breast | Precancer | homeostasis of number of cells | 32/1080 | 272/18723 | 1.03e-04 | 1.89e-03 | 32 |
| GO:00302189 | Breast | Precancer | erythrocyte differentiation | 18/1080 | 120/18723 | 1.76e-04 | 2.87e-03 | 18 |
| GO:00346604 | Breast | Precancer | ncRNA metabolic process | 45/1080 | 485/18723 | 1.15e-03 | 1.26e-02 | 45 |
| GO:00304902 | Breast | Precancer | maturation of SSU-rRNA | 8/1080 | 50/18723 | 7.39e-03 | 4.90e-02 | 8 |
| GO:000218114 | Breast | IDC | cytoplasmic translation | 82/1434 | 148/18723 | 2.60e-52 | 1.48e-48 | 82 |
| Pathway ID | Tissue | Disease Stage | Description | Gene Ratio | Bg Ratio | pvalue | p.adjust | qvalue | Count |
| hsa0301018 | Breast | Precancer | Ribosome | 80/684 | 167/8465 | 7.33e-44 | 2.32e-41 | 1.77e-41 | 80 |
| hsa0517118 | Breast | Precancer | Coronavirus disease - COVID-19 | 81/684 | 232/8465 | 3.74e-32 | 2.36e-30 | 1.81e-30 | 81 |
| hsa0301019 | Breast | Precancer | Ribosome | 80/684 | 167/8465 | 7.33e-44 | 2.32e-41 | 1.77e-41 | 80 |
| hsa0517119 | Breast | Precancer | Coronavirus disease - COVID-19 | 81/684 | 232/8465 | 3.74e-32 | 2.36e-30 | 1.81e-30 | 81 |
| hsa0301024 | Breast | IDC | Ribosome | 83/867 | 167/8465 | 6.07e-39 | 9.87e-37 | 7.38e-37 | 83 |
| hsa0517124 | Breast | IDC | Coronavirus disease - COVID-19 | 86/867 | 232/8465 | 1.50e-28 | 9.72e-27 | 7.27e-27 | 86 |
| hsa0301034 | Breast | IDC | Ribosome | 83/867 | 167/8465 | 6.07e-39 | 9.87e-37 | 7.38e-37 | 83 |
| hsa0517134 | Breast | IDC | Coronavirus disease - COVID-19 | 86/867 | 232/8465 | 1.50e-28 | 9.72e-27 | 7.27e-27 | 86 |
| hsa0301044 | Breast | DCIS | Ribosome | 82/846 | 167/8465 | 8.69e-39 | 1.40e-36 | 1.03e-36 | 82 |
| hsa0517144 | Breast | DCIS | Coronavirus disease - COVID-19 | 86/846 | 232/8465 | 2.42e-29 | 1.56e-27 | 1.15e-27 | 86 |
| hsa0301054 | Breast | DCIS | Ribosome | 82/846 | 167/8465 | 8.69e-39 | 1.40e-36 | 1.03e-36 | 82 |
| hsa0517154 | Breast | DCIS | Coronavirus disease - COVID-19 | 86/846 | 232/8465 | 2.42e-29 | 1.56e-27 | 1.15e-27 | 86 |
| hsa0517120 | Cervix | CC | Coronavirus disease - COVID-19 | 111/1267 | 232/8465 | 1.82e-33 | 5.90e-31 | 3.49e-31 | 111 |
| hsa0301020 | Cervix | CC | Ribosome | 85/1267 | 167/8465 | 3.17e-28 | 5.14e-26 | 3.04e-26 | 85 |
| hsa05171110 | Cervix | CC | Coronavirus disease - COVID-19 | 111/1267 | 232/8465 | 1.82e-33 | 5.90e-31 | 3.49e-31 | 111 |
| hsa03010110 | Cervix | CC | Ribosome | 85/1267 | 167/8465 | 3.17e-28 | 5.14e-26 | 3.04e-26 | 85 |
| hsa0301025 | Cervix | HSIL_HPV | Ribosome | 80/459 | 167/8465 | 9.61e-58 | 2.82e-55 | 2.28e-55 | 80 |
| hsa0517125 | Cervix | HSIL_HPV | Coronavirus disease - COVID-19 | 91/459 | 232/8465 | 2.14e-56 | 3.13e-54 | 2.53e-54 | 91 |
| hsa0301035 | Cervix | HSIL_HPV | Ribosome | 80/459 | 167/8465 | 9.61e-58 | 2.82e-55 | 2.28e-55 | 80 |
| hsa0517135 | Cervix | HSIL_HPV | Coronavirus disease - COVID-19 | 91/459 | 232/8465 | 2.14e-56 | 3.13e-54 | 2.53e-54 | 91 |
| Hugo Symbol | Variant Class | Variant Classification | dbSNP RS | HGVSc | HGVSp | HGVSp Short | SWISSPROT | BIOTYPE | SIFT | PolyPhen | Tumor Sample Barcode | Tissue | Histology | Sex | Age | Stage | Therapy Types | Drugs | Outcome |
| RPS14 | SNV | Missense_Mutation | rs137915903 | c.221N>G | p.Ala74Gly | p.A74G | P62263 | protein_coding | deleterious(0.01) | probably_damaging(0.928) | TCGA-BH-A0BG-01 | Breast | breast invasive carcinoma | Female | >=65 | I/II | Unknown | Unknown | SD |
| RPS14 | insertion | Frame_Shift_Ins | novel | c.364_365insTAAAAGATTTTTTCAGACTTTTTTTCAGTGTCTTTTTACTTAATGAA | p.Ser122LeufsTer19 | p.S122Lfs*19 | P62263 | protein_coding | | | TCGA-A8-A0A4-01 | Breast | breast invasive carcinoma | Female | >=65 | I/II | Hormone Therapy | tamoxiphen | CR |
| RPS14 | SNV | Missense_Mutation | novel | c.382N>T | p.Arg128Trp | p.R128W | P62263 | protein_coding | deleterious(0.04) | benign(0.056) | TCGA-VS-A9UJ-01 | Cervix | cervical & endocervical cancer | Female | <65 | I/II | Unknown | Unknown | PD |
| RPS14 | SNV | Missense_Mutation | | c.221N>A | p.Ala74Asp | p.A74D | P62263 | protein_coding | deleterious(0) | benign(0.443) | TCGA-A5-A0G2-01 | Endometrium | uterine corpus endometrioid carcinoma | Female | <65 | III/IV | Unknown | Unknown | SD |
| RPS14 | SNV | Missense_Mutation | novel | c.293G>A | p.Arg98Gln | p.R98Q | P62263 | protein_coding | tolerated(0.14) | benign(0.168) | TCGA-AJ-A3EK-01 | Endometrium | uterine corpus endometrioid carcinoma | Female | <65 | I/II | Chemotherapy | carboplatin | CR |
| RPS14 | SNV | Missense_Mutation | | c.64N>A | p.Ala22Thr | p.A22T | P62263 | protein_coding | tolerated(0.12) | benign(0.009) | TCGA-AP-A1DK-01 | Endometrium | uterine corpus endometrioid carcinoma | Female | <65 | I/II | Unknown | Unknown | SD |
| RPS14 | SNV | Missense_Mutation | | c.292C>T | p.Arg98Trp | p.R98W | P62263 | protein_coding | tolerated(0.06) | benign(0.159) | TCGA-AX-A2HD-01 | Endometrium | uterine corpus endometrioid carcinoma | Female | >=65 | III/IV | Unknown | Unknown | SD |
| RPS14 | SNV | Missense_Mutation | novel | c.421C>T | p.Arg141Cys | p.R141C | P62263 | protein_coding | tolerated(0.13) | possibly_damaging(0.898) | TCGA-EO-A22U-01 | Endometrium | uterine corpus endometrioid carcinoma | Female | >=65 | I/II | Unknown | Unknown | SD |
| RPS14 | SNV | Missense_Mutation | novel | c.55N>T | p.Pro19Ser | p.P19S | P62263 | protein_coding | deleterious(0.02) | benign(0.139) | TCGA-EY-A215-01 | Endometrium | uterine corpus endometrioid carcinoma | Female | <65 | I/II | Unknown | Unknown | SD |
| RPS14 | SNV | Missense_Mutation | novel | c.446N>A | p.Arg149His | p.R149H | P62263 | protein_coding | tolerated(0.34) | possibly_damaging(0.522) | TCGA-FI-A2D0-01 | Endometrium | uterine corpus endometrioid carcinoma | Female | <65 | I/II | Unknown | Unknown | SD |


