
|
|||||
|
 | |
| |
| |
| |
| |
| |
|
Gene: RPS11 |
Gene summary for RPS11 |
| Gene information | Species | Human | Gene symbol | RPS11 | Gene ID | 6205 |
| Gene name | ribosomal protein S11 | |
| Gene Alias | S11 | |
| Cytomap | 19q13.33 | |
| Gene Type | protein-coding | GO ID | GO:0002181 | UniProtAcc | P62280 |
Top |
Malignant transformation analysis |
| Identification of the aberrant gene expression in precancerous and cancerous lesions by comparing the gene expression of stem-like cells in diseased tissues with normal stem cells |
| Entrez ID | Symbol | Replicates | Species | Organ | Tissue | Adj P-value | Log2FC | Malignancy |
| 6205 | RPS11 | CA_HPV_1 | Human | Cervix | CC | 5.43e-11 | -3.05e-01 | 0.0264 |
| 6205 | RPS11 | HSIL_HPV_1 | Human | Cervix | HSIL_HPV | 3.91e-04 | 1.15e-01 | 0.0116 |
| 6205 | RPS11 | N_HPV_2 | Human | Cervix | N_HPV | 8.22e-22 | -2.38e-01 | -0.0131 |
| 6205 | RPS11 | CCI_1 | Human | Cervix | CC | 1.83e-54 | -1.81e+00 | 0.528 |
| 6205 | RPS11 | CCI_2 | Human | Cervix | CC | 4.65e-46 | -1.57e+00 | 0.5249 |
| 6205 | RPS11 | CCI_3 | Human | Cervix | CC | 1.73e-65 | -1.75e+00 | 0.516 |
| 6205 | RPS11 | CCII_1 | Human | Cervix | CC | 7.47e-86 | -1.75e+00 | 0.3249 |
| 6205 | RPS11 | Tumor | Human | Cervix | CC | 1.38e-09 | -1.77e-01 | 0.1241 |
| 6205 | RPS11 | sample1 | Human | Cervix | CC | 1.17e-21 | -5.02e-01 | 0.0959 |
| 6205 | RPS11 | sample3 | Human | Cervix | CC | 1.31e-30 | -2.48e-01 | 0.1387 |
| 6205 | RPS11 | H2 | Human | Cervix | HSIL_HPV | 9.94e-29 | -3.90e-01 | 0.0632 |
| 6205 | RPS11 | L1 | Human | Cervix | CC | 1.57e-04 | -2.85e-01 | 0.0802 |
| 6205 | RPS11 | T1 | Human | Cervix | CC | 1.11e-44 | -5.71e-01 | 0.0918 |
| 6205 | RPS11 | T3 | Human | Cervix | CC | 1.01e-32 | -2.71e-01 | 0.1389 |
| 6205 | RPS11 | HTA11_3410_2000001011 | Human | Colorectum | AD | 3.72e-96 | 1.88e+00 | 0.0155 |
| 6205 | RPS11 | HTA11_2487_2000001011 | Human | Colorectum | SER | 2.47e-64 | 2.69e+00 | -0.1808 |
| 6205 | RPS11 | HTA11_2951_2000001011 | Human | Colorectum | AD | 1.37e-33 | 2.77e+00 | 0.0216 |
| 6205 | RPS11 | HTA11_1938_2000001011 | Human | Colorectum | AD | 1.17e-62 | 2.69e+00 | -0.0811 |
| 6205 | RPS11 | HTA11_78_2000001011 | Human | Colorectum | AD | 4.82e-41 | 1.37e+00 | -0.1088 |
| 6205 | RPS11 | HTA11_347_2000001011 | Human | Colorectum | AD | 1.23e-97 | 2.72e+00 | -0.1954 |
| Page: 1 2 3 4 5 6 7 8 9 10 11 12 13 14 15 16 17 |
| Tissue | Expression Dynamics | Abbreviation |
| Cervix |  | CC: Cervix cancer |
| HSIL_HPV: HPV-infected high-grade squamous intraepithelial lesions | ||
| N_HPV: HPV-infected normal cervix | ||
| Colorectum (GSE201348) |  | FAP: Familial adenomatous polyposis |
| CRC: Colorectal cancer | ||
| Colorectum (HTA11) |  | AD: Adenomas |
| SER: Sessile serrated lesions | ||
| MSI-H: Microsatellite-high colorectal cancer | ||
| MSS: Microsatellite stable colorectal cancer | ||
| Endometrium | 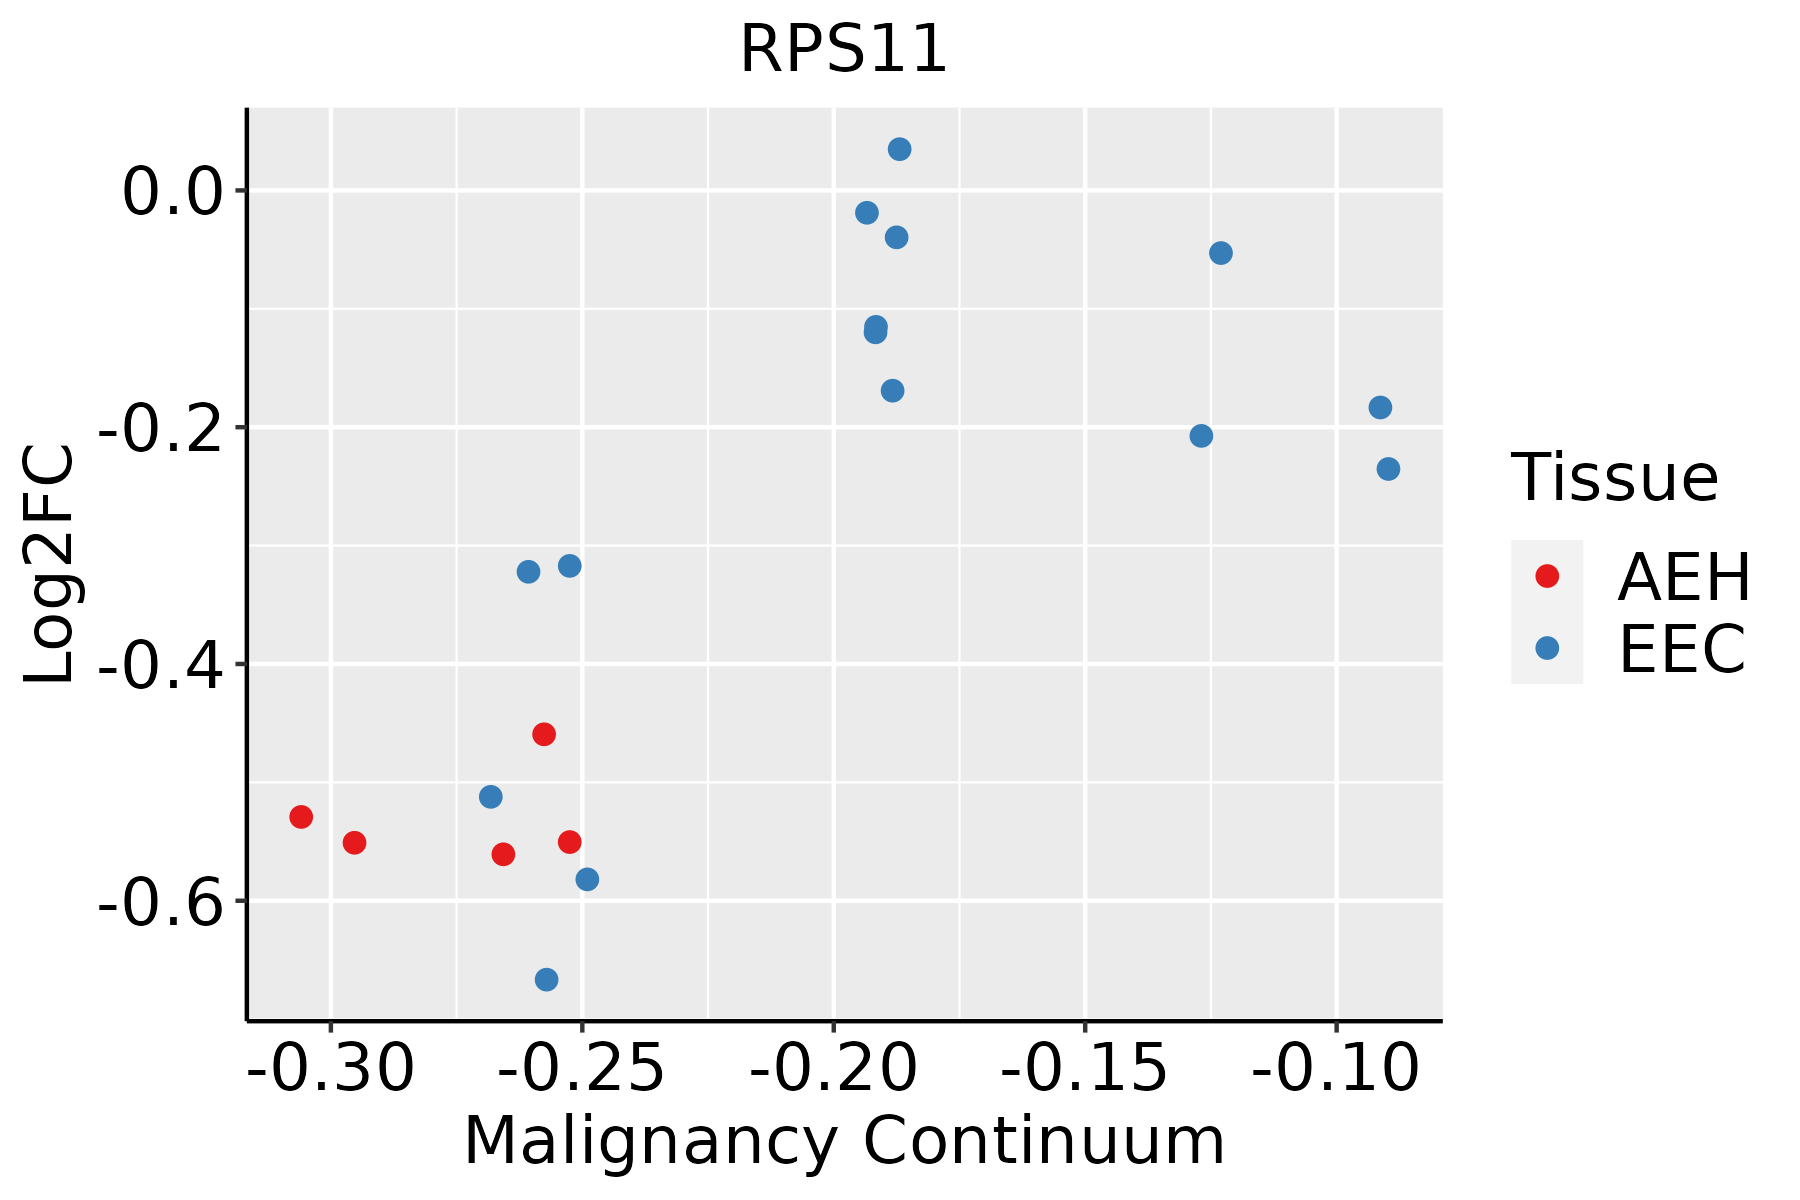 | AEH: Atypical endometrial hyperplasia |
| EEC: Endometrioid Cancer | ||
| Esophagus |  | ESCC: Esophageal squamous cell carcinoma |
| HGIN: High-grade intraepithelial neoplasias | ||
| LGIN: Low-grade intraepithelial neoplasias | ||
| Liver | 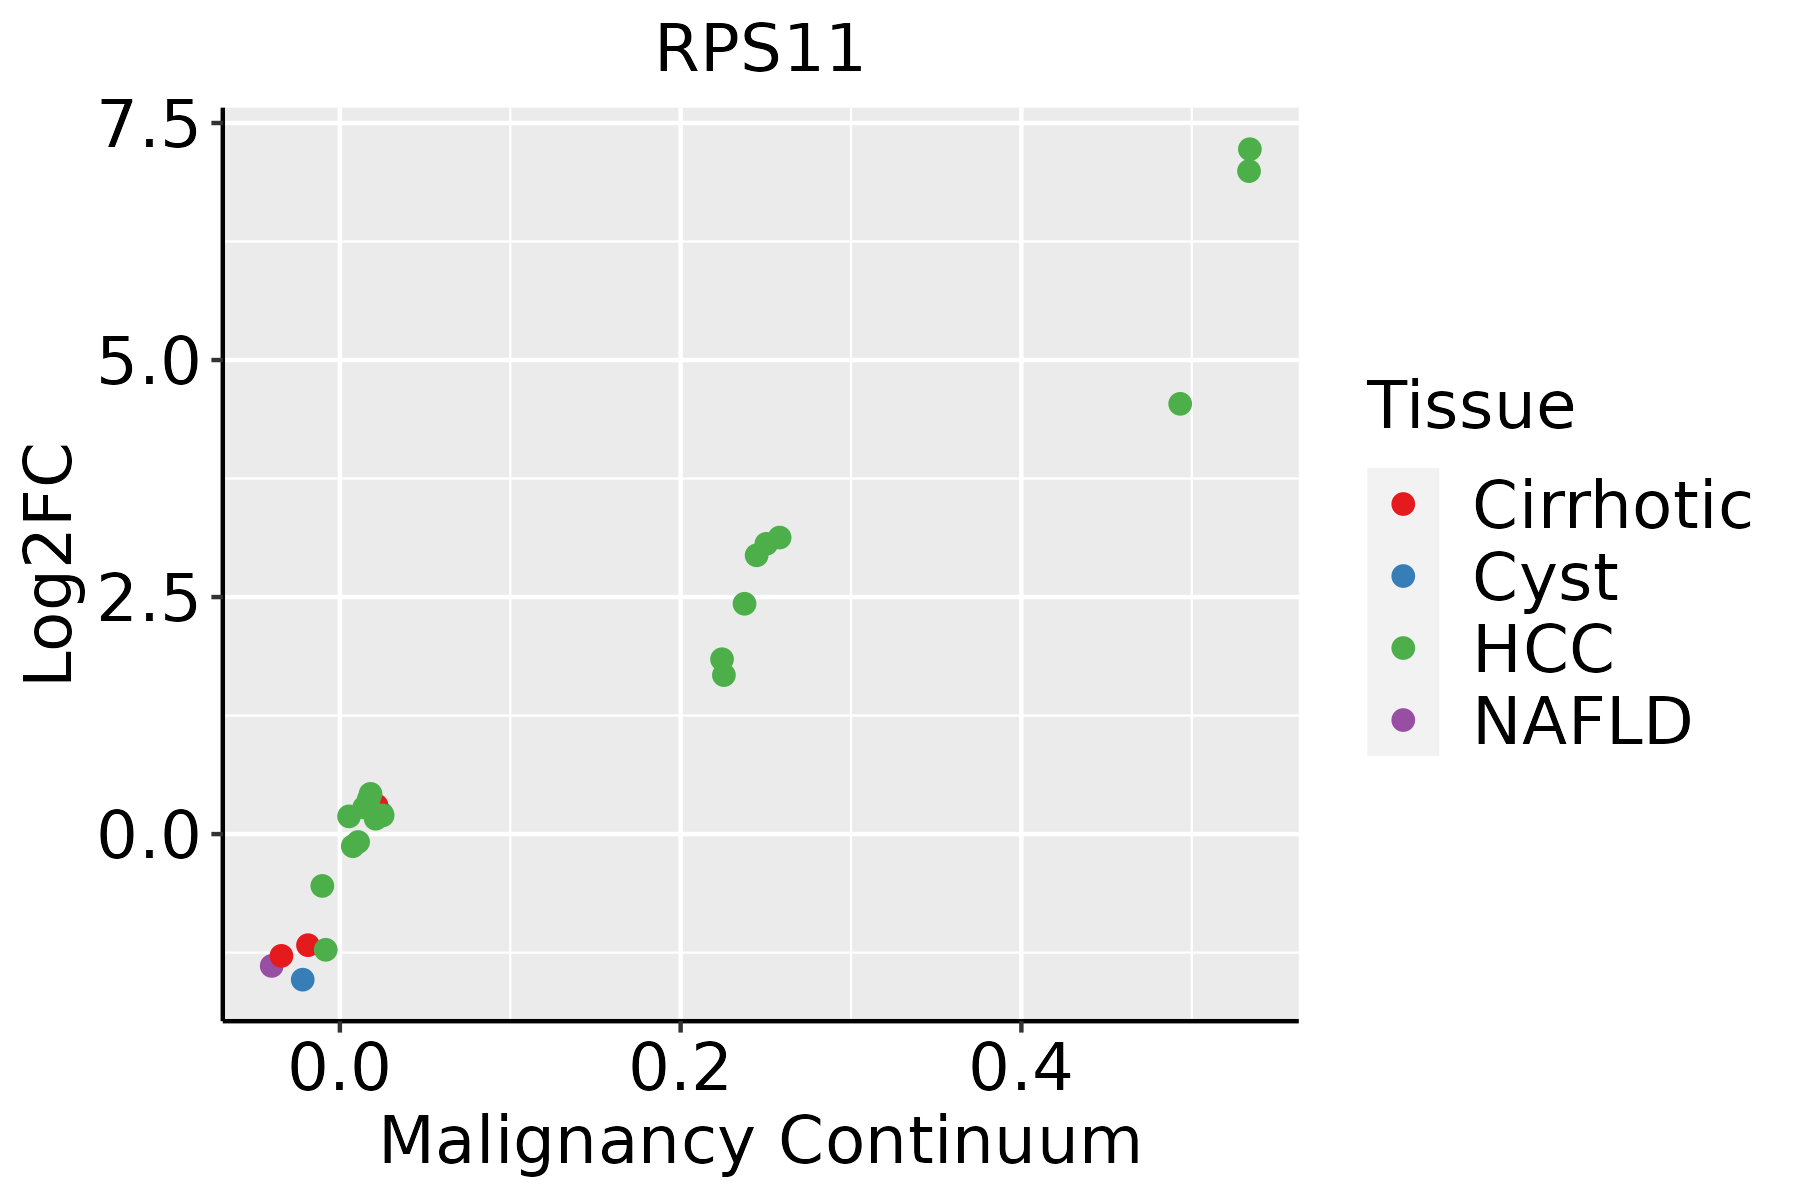 | HCC: Hepatocellular carcinoma |
| NAFLD: Non-alcoholic fatty liver disease | ||
| Lung | 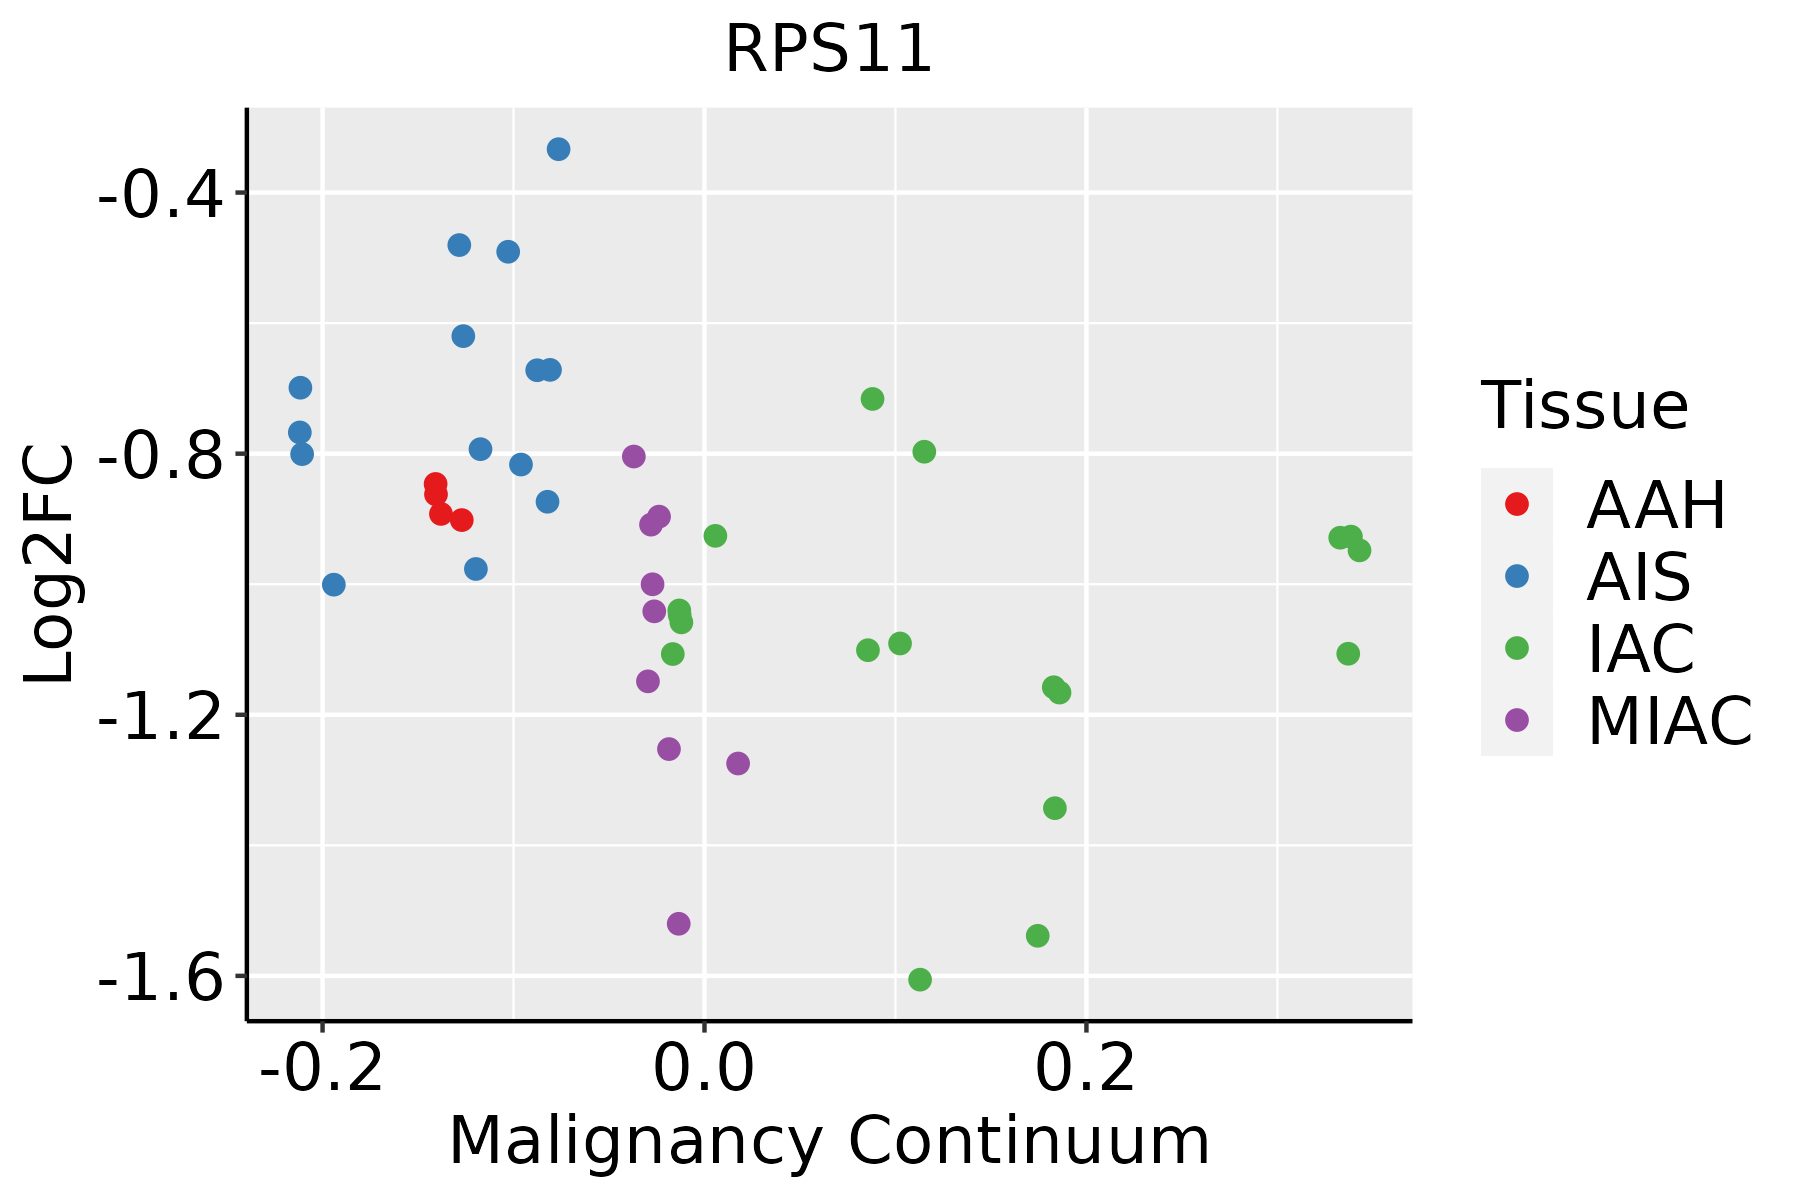 | AAH: Atypical adenomatous hyperplasia |
| AIS: Adenocarcinoma in situ | ||
| IAC: Invasive lung adenocarcinoma | ||
| MIA: Minimally invasive adenocarcinoma | ||
| Oral Cavity |  | EOLP: Erosive Oral lichen planus |
| LP: leukoplakia | ||
| NEOLP: Non-erosive oral lichen planus | ||
| OSCC: Oral squamous cell carcinoma | ||
| Prostate | 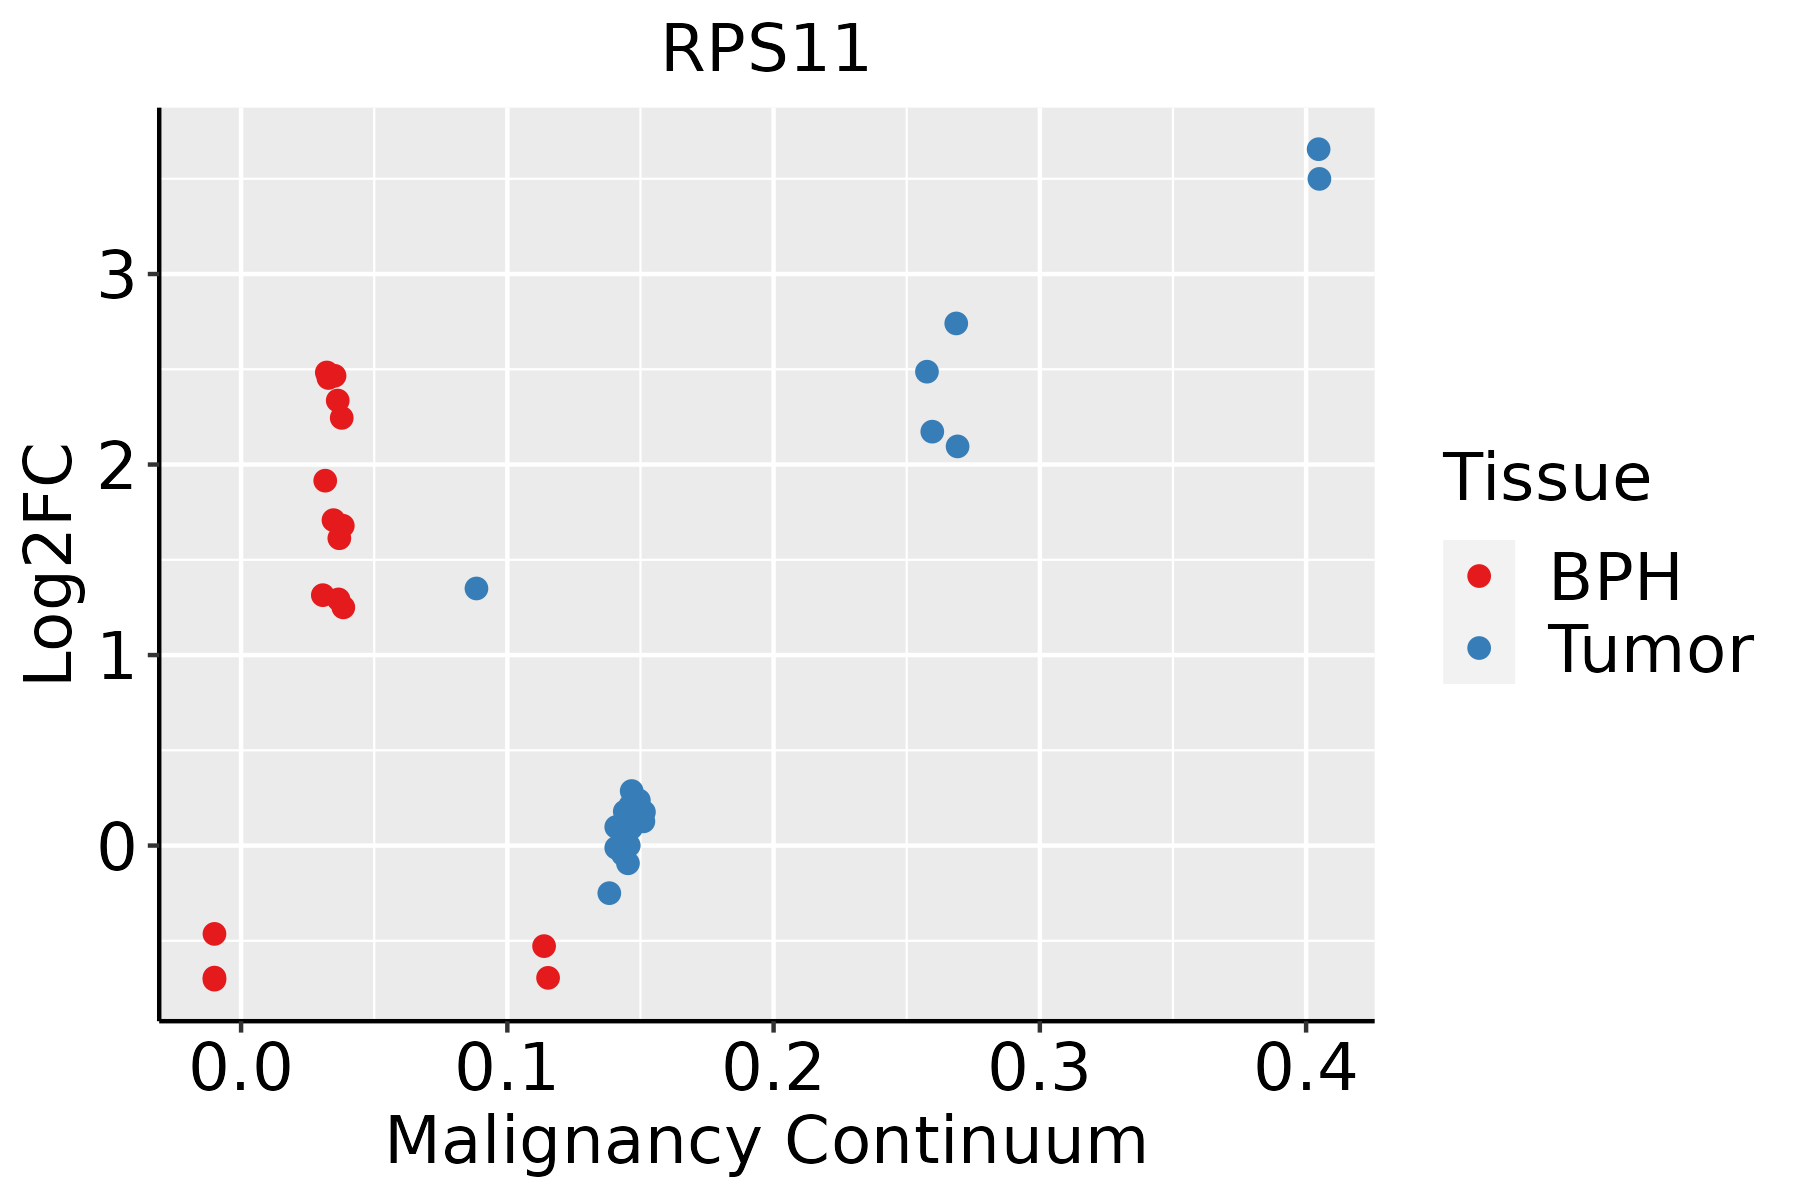 | BPH: Benign Prostatic Hyperplasia |
| Skin | 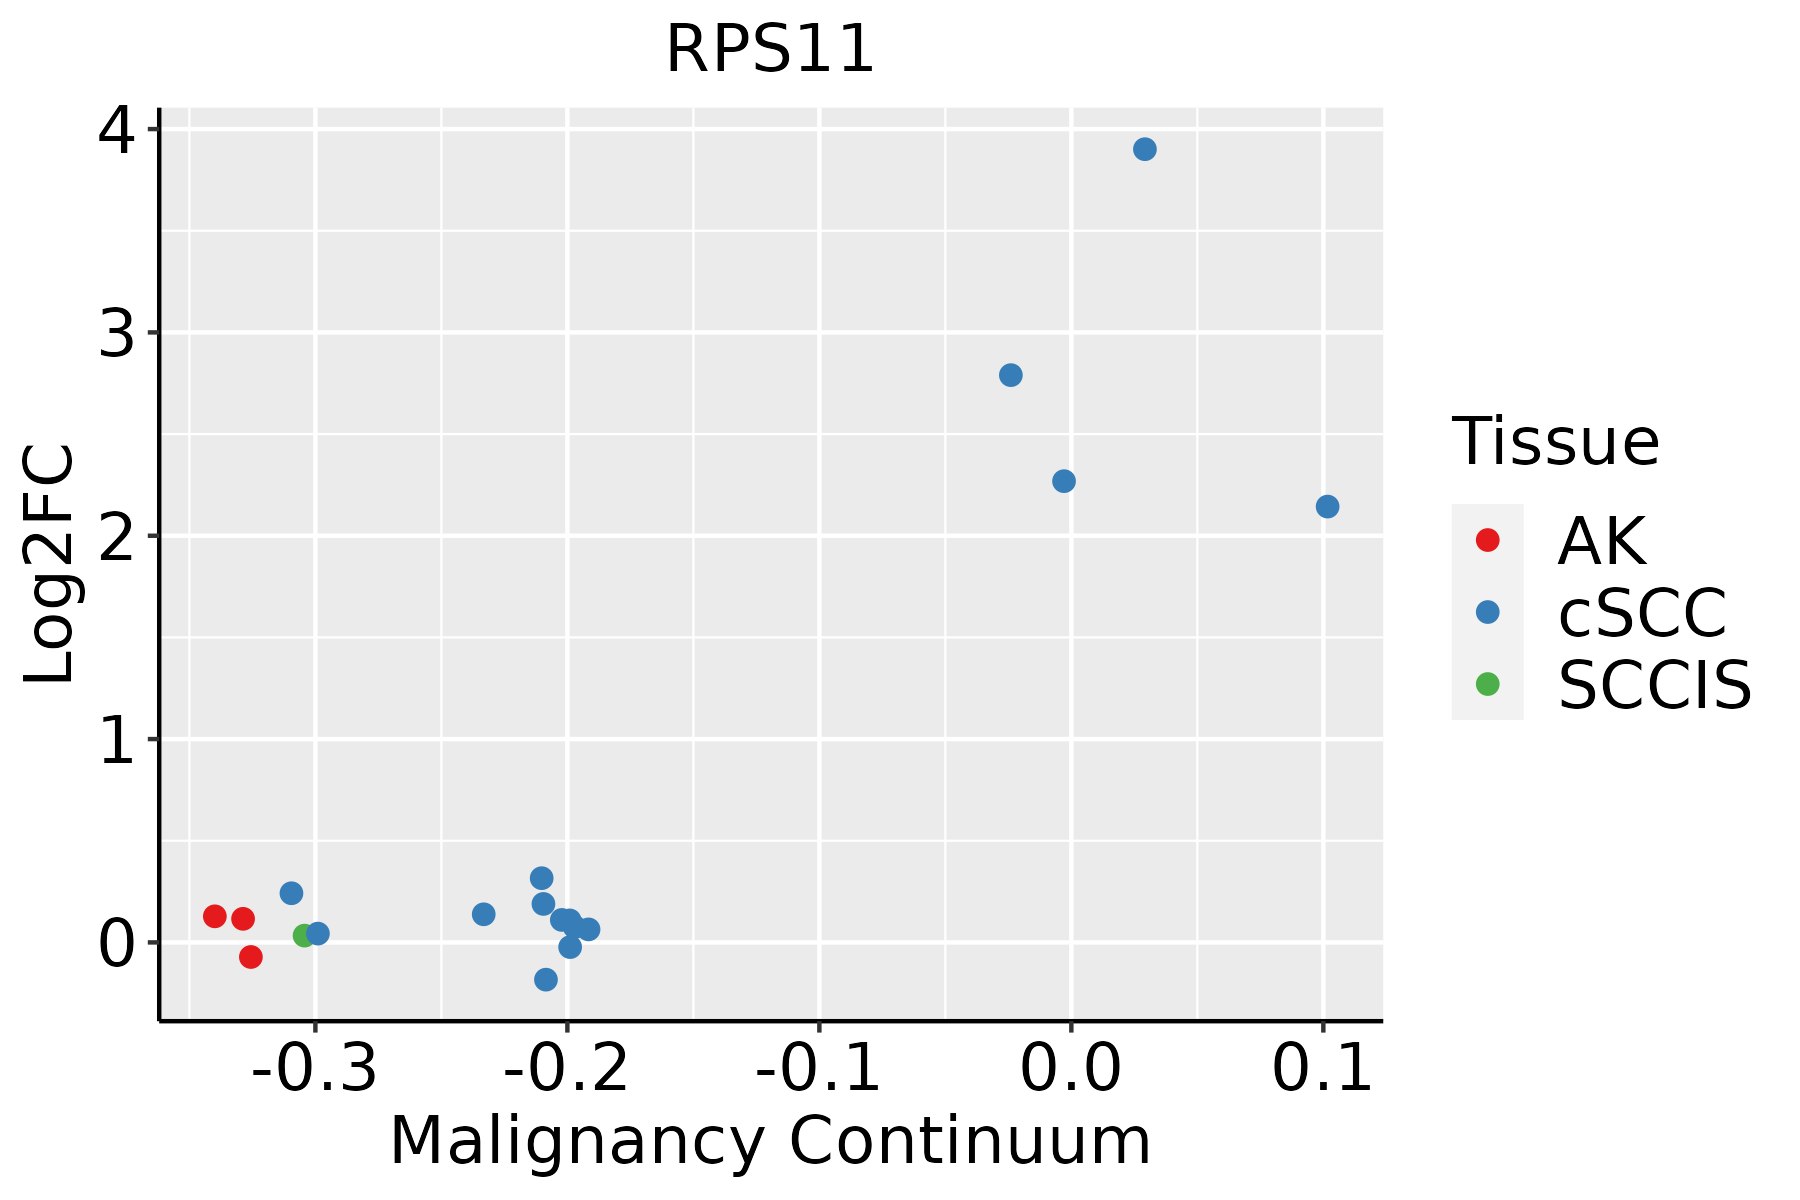 | AK: Actinic keratosis |
| cSCC: Cutaneous squamous cell carcinoma | ||
| SCCIS:squamous cell carcinoma in situ | ||
| Thyroid | 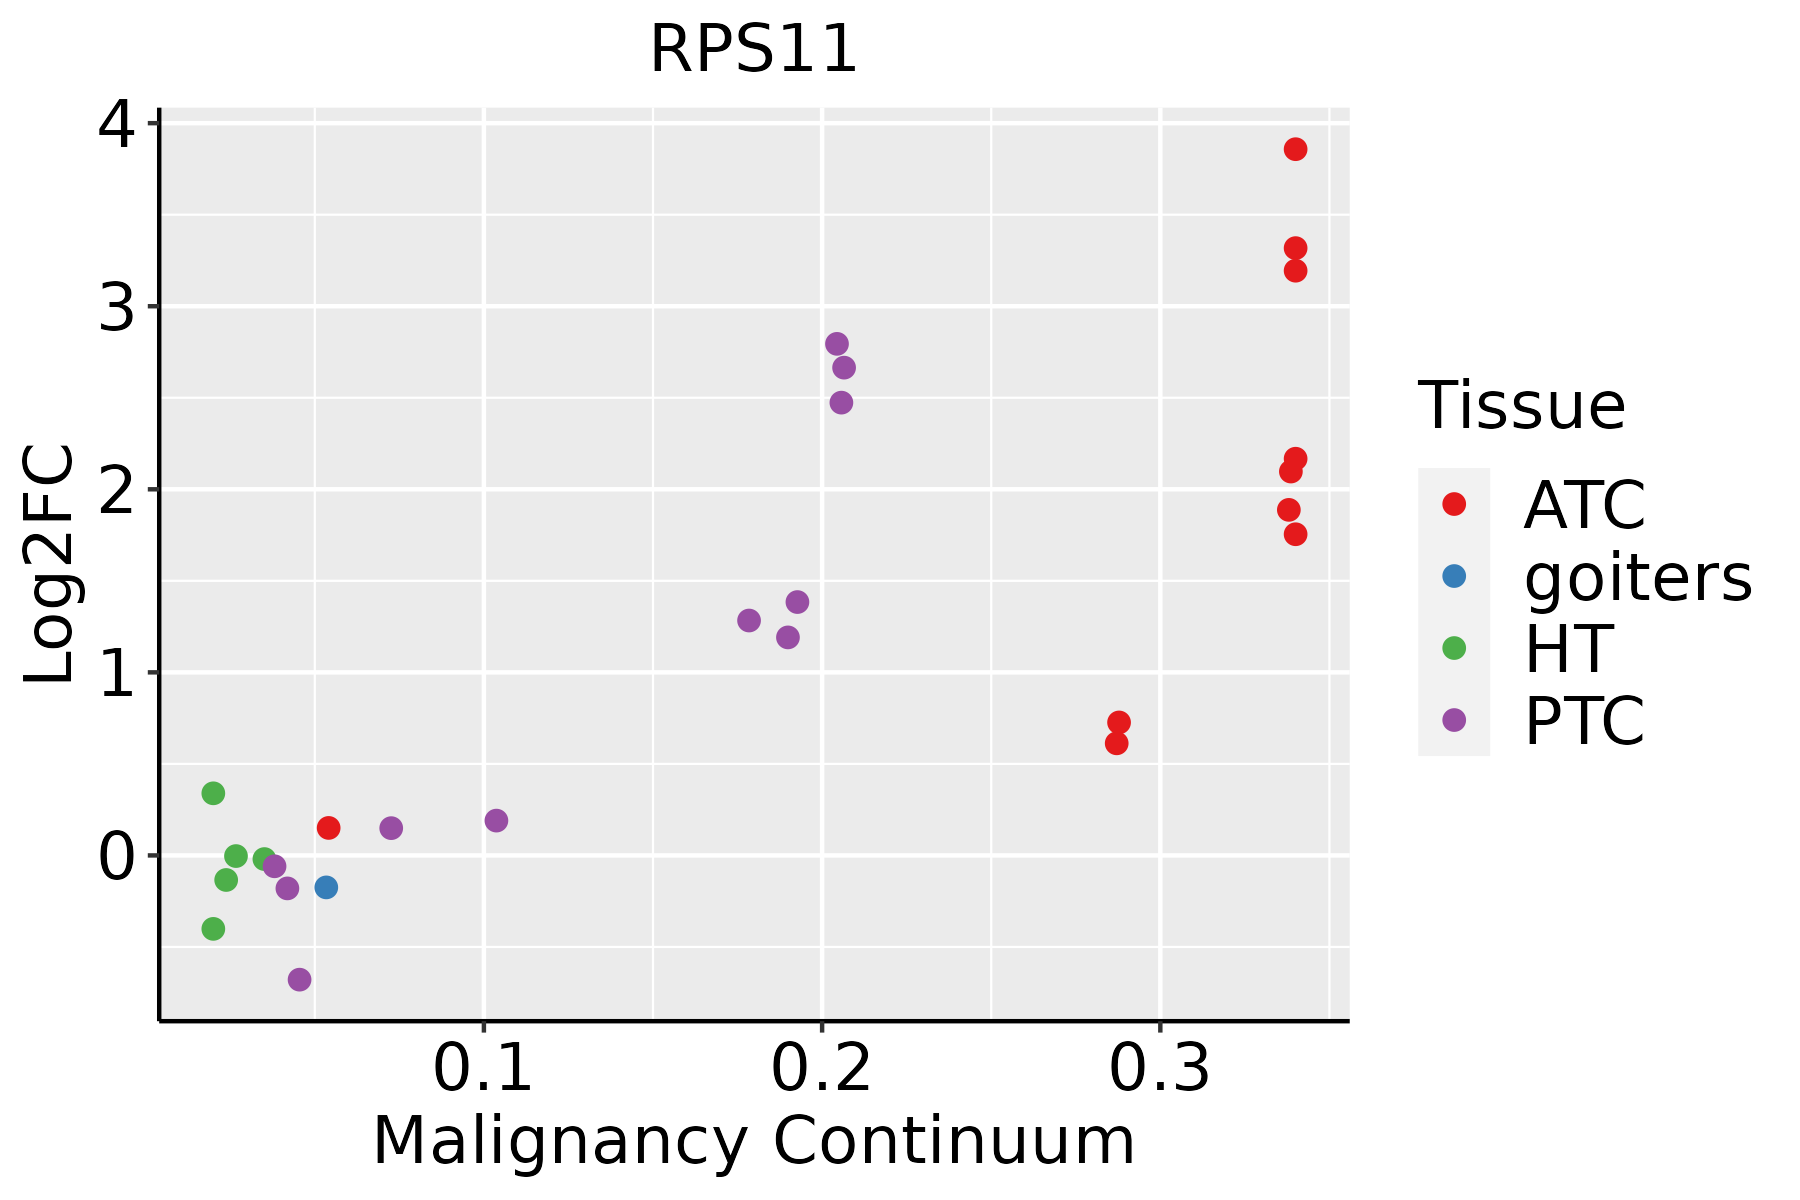 | ATC: Anaplastic thyroid cancer |
| HT: Hashimoto's thyroiditis | ||
| PTC: Papillary thyroid cancer |
| ∗log2FC in expression of this searched gene in stem-like cells from each diseased tissue sample relative to stem-like cells in normal samples in each tissue plotted against the malignancy continuum. Samples are colored based on if they are from different disease stage. |
Top |
Malignant transformation related pathway analysis |
| Find out the enriched GO biological processes and KEGG pathways involved in transition from healthy to precancer to cancer |
| Tissue | Disease Stage | Enriched GO biological Processes |
| Colorectum | AD |  |
| Colorectum | SER |  |
| Colorectum | MSS |  |
| Colorectum | MSI-H |  |
| Colorectum | FAP |  |
| ∗Top 15 enriched GO BP terms are showed in the bar plot of each disease state in each tissue. Each row represents a significant GO biological process which is colored according to the -log10(p.adjust). |
| Page: 1 2 3 4 5 6 7 8 9 |
| GO ID | Tissue | Disease Stage | Description | Gene Ratio | Bg Ratio | pvalue | p.adjust | Count |
| GO:000218110 | Cervix | CC | cytoplasmic translation | 96/2311 | 148/18723 | 4.87e-51 | 2.91e-47 | 96 |
| GO:000218115 | Cervix | HSIL_HPV | cytoplasmic translation | 86/737 | 148/18723 | 3.97e-82 | 1.91e-78 | 86 |
| GO:000218125 | Cervix | N_HPV | cytoplasmic translation | 42/534 | 148/18723 | 2.61e-30 | 1.19e-26 | 42 |
| GO:0002181 | Colorectum | AD | cytoplasmic translation | 109/3918 | 148/18723 | 3.40e-43 | 2.13e-39 | 109 |
| GO:00021811 | Colorectum | SER | cytoplasmic translation | 102/2897 | 148/18723 | 1.38e-48 | 8.49e-45 | 102 |
| GO:00021812 | Colorectum | MSS | cytoplasmic translation | 108/3467 | 148/18723 | 1.78e-47 | 1.11e-43 | 108 |
| GO:00021813 | Colorectum | MSI-H | cytoplasmic translation | 100/1319 | 148/18723 | 1.50e-79 | 8.31e-76 | 100 |
| GO:00021814 | Colorectum | FAP | cytoplasmic translation | 76/2622 | 148/18723 | 3.31e-27 | 2.03e-23 | 76 |
| GO:00021815 | Colorectum | CRC | cytoplasmic translation | 70/2078 | 148/18723 | 1.53e-28 | 9.16e-25 | 70 |
| GO:000218116 | Endometrium | AEH | cytoplasmic translation | 104/2100 | 148/18723 | 1.01e-64 | 6.07e-61 | 104 |
| GO:000218117 | Endometrium | EEC | cytoplasmic translation | 104/2168 | 148/18723 | 2.53e-63 | 1.52e-59 | 104 |
| GO:000218127 | Esophagus | HGIN | cytoplasmic translation | 108/2587 | 148/18723 | 1.70e-60 | 1.02e-56 | 108 |
| GO:0022613111 | Esophagus | ESCC | ribonucleoprotein complex biogenesis | 365/8552 | 463/18723 | 1.74e-49 | 1.11e-45 | 365 |
| GO:0042254111 | Esophagus | ESCC | ribosome biogenesis | 252/8552 | 299/18723 | 3.27e-44 | 1.04e-40 | 252 |
| GO:003447015 | Esophagus | ESCC | ncRNA processing | 300/8552 | 395/18723 | 3.09e-35 | 3.26e-32 | 300 |
| GO:0016072110 | Esophagus | ESCC | rRNA metabolic process | 197/8552 | 236/18723 | 1.31e-33 | 1.18e-30 | 197 |
| GO:0006364110 | Esophagus | ESCC | rRNA processing | 189/8552 | 225/18723 | 4.88e-33 | 3.87e-30 | 189 |
| GO:0002181111 | Esophagus | ESCC | cytoplasmic translation | 135/8552 | 148/18723 | 4.17e-32 | 2.65e-29 | 135 |
| GO:003466012 | Esophagus | ESCC | ncRNA metabolic process | 346/8552 | 485/18723 | 4.35e-31 | 2.51e-28 | 346 |
| GO:014005313 | Esophagus | ESCC | mitochondrial gene expression | 93/8552 | 108/18723 | 1.96e-18 | 2.03e-16 | 93 |
| Page: 1 2 3 4 5 6 7 8 |
| Pathway ID | Tissue | Disease Stage | Description | Gene Ratio | Bg Ratio | pvalue | p.adjust | qvalue | Count |
| hsa0517120 | Cervix | CC | Coronavirus disease - COVID-19 | 111/1267 | 232/8465 | 1.82e-33 | 5.90e-31 | 3.49e-31 | 111 |
| hsa0301020 | Cervix | CC | Ribosome | 85/1267 | 167/8465 | 3.17e-28 | 5.14e-26 | 3.04e-26 | 85 |
| hsa05171110 | Cervix | CC | Coronavirus disease - COVID-19 | 111/1267 | 232/8465 | 1.82e-33 | 5.90e-31 | 3.49e-31 | 111 |
| hsa03010110 | Cervix | CC | Ribosome | 85/1267 | 167/8465 | 3.17e-28 | 5.14e-26 | 3.04e-26 | 85 |
| hsa0301025 | Cervix | HSIL_HPV | Ribosome | 80/459 | 167/8465 | 9.61e-58 | 2.82e-55 | 2.28e-55 | 80 |
| hsa0517125 | Cervix | HSIL_HPV | Coronavirus disease - COVID-19 | 91/459 | 232/8465 | 2.14e-56 | 3.13e-54 | 2.53e-54 | 91 |
| hsa0301035 | Cervix | HSIL_HPV | Ribosome | 80/459 | 167/8465 | 9.61e-58 | 2.82e-55 | 2.28e-55 | 80 |
| hsa0517135 | Cervix | HSIL_HPV | Coronavirus disease - COVID-19 | 91/459 | 232/8465 | 2.14e-56 | 3.13e-54 | 2.53e-54 | 91 |
| hsa0517145 | Cervix | N_HPV | Coronavirus disease - COVID-19 | 47/349 | 232/8465 | 1.79e-20 | 4.86e-18 | 3.80e-18 | 47 |
| hsa0301045 | Cervix | N_HPV | Ribosome | 39/349 | 167/8465 | 2.05e-19 | 2.79e-17 | 2.18e-17 | 39 |
| hsa0517155 | Cervix | N_HPV | Coronavirus disease - COVID-19 | 47/349 | 232/8465 | 1.79e-20 | 4.86e-18 | 3.80e-18 | 47 |
| hsa0301055 | Cervix | N_HPV | Ribosome | 39/349 | 167/8465 | 2.05e-19 | 2.79e-17 | 2.18e-17 | 39 |
| hsa03010 | Colorectum | AD | Ribosome | 96/2092 | 167/8465 | 8.28e-20 | 5.54e-18 | 3.54e-18 | 96 |
| hsa05171 | Colorectum | AD | Coronavirus disease - COVID-19 | 113/2092 | 232/8465 | 9.90e-16 | 2.55e-14 | 1.63e-14 | 113 |
| hsa030101 | Colorectum | AD | Ribosome | 96/2092 | 167/8465 | 8.28e-20 | 5.54e-18 | 3.54e-18 | 96 |
| hsa051711 | Colorectum | AD | Coronavirus disease - COVID-19 | 113/2092 | 232/8465 | 9.90e-16 | 2.55e-14 | 1.63e-14 | 113 |
| hsa030102 | Colorectum | SER | Ribosome | 92/1580 | 167/8465 | 2.21e-26 | 3.66e-24 | 2.66e-24 | 92 |
| hsa051712 | Colorectum | SER | Coronavirus disease - COVID-19 | 98/1580 | 232/8465 | 3.33e-17 | 8.50e-16 | 6.17e-16 | 98 |
| hsa030103 | Colorectum | SER | Ribosome | 92/1580 | 167/8465 | 2.21e-26 | 3.66e-24 | 2.66e-24 | 92 |
| hsa051713 | Colorectum | SER | Coronavirus disease - COVID-19 | 98/1580 | 232/8465 | 3.33e-17 | 8.50e-16 | 6.17e-16 | 98 |
| Page: 1 2 3 4 5 6 |
Top |
Cell-cell communication analysis |
| Identification of potential cell-cell interactions between two cell types and their ligand-receptor pairs for different disease states |
| Ligand | Receptor | LRpair | Pathway | Tissue | Disease Stage |
| Page: 1 |
Top |
Single-cell gene regulatory network inference analysis |
| Find out the significant the regulons (TFs) and the target genes of each regulon across cell types for different disease states |
| TF | Cell Type | Tissue | Disease Stage | Target Gene | RSS | Regulon Activity |
| ∗The dot plots of a searched regulon are shown for all cell subpopulations in each disease state of each tissue based on the regulon specific score inferred using pySCENIC and by calculating the average expression. |
| Page: 1 |
Top |
Somatic mutation of malignant transformation related genes |
| Annotation of somatic variants for genes involved in malignant transformation |
| Hugo Symbol | Variant Class | Variant Classification | dbSNP RS | HGVSc | HGVSp | HGVSp Short | SWISSPROT | BIOTYPE | SIFT | PolyPhen | Tumor Sample Barcode | Tissue | Histology | Sex | Age | Stage | Therapy Types | Drugs | Outcome |
| RPS11 | SNV | Missense_Mutation | rs11549537 | c.415N>T | p.Arg139Cys | p.R139C | P62280 | protein_coding | tolerated(0.09) | benign(0.029) | TCGA-AD-A5EJ-01 | Colorectum | colon adenocarcinoma | Female | >=65 | I/II | Unknown | Unknown | SD |
| RPS11 | SNV | Missense_Mutation | c.107N>G | p.Tyr36Cys | p.Y36C | P62280 | protein_coding | deleterious(0) | possibly_damaging(0.765) | TCGA-AZ-4308-01 | Colorectum | colon adenocarcinoma | Female | <65 | III/IV | Targeted Molecular therapy | avastin | CR | |
| RPS11 | deletion | Frame_Shift_Del | c.158_161delNNNN | p.Gly53AlafsTer24 | p.G53Afs*24 | P62280 | protein_coding | TCGA-AA-A01K-01 | Colorectum | colon adenocarcinoma | Female | >=65 | III/IV | Chemotherapy | folinic | CR | |||
| RPS11 | SNV | Missense_Mutation | rs746359465 | c.290G>A | p.Arg97His | p.R97H | P62280 | protein_coding | tolerated(0.15) | possibly_damaging(0.903) | TCGA-AX-A1C5-01 | Endometrium | uterine corpus endometrioid carcinoma | Female | <65 | III/IV | Unspecific | Carboplatin | SD |
| RPS11 | SNV | Missense_Mutation | c.448G>A | p.Gly150Ser | p.G150S | P62280 | protein_coding | tolerated(0.23) | benign(0.056) | TCGA-B5-A11E-01 | Endometrium | uterine corpus endometrioid carcinoma | Female | <65 | I/II | Unknown | Unknown | SD | |
| RPS11 | SNV | Missense_Mutation | novel | c.153N>G | p.Ile51Met | p.I51M | P62280 | protein_coding | deleterious(0.01) | benign(0.015) | TCGA-B5-A1MR-01 | Endometrium | uterine corpus endometrioid carcinoma | Female | >=65 | III/IV | Unknown | Unknown | SD |
| RPS11 | SNV | Missense_Mutation | rs746359465 | c.290N>A | p.Arg97His | p.R97H | P62280 | protein_coding | tolerated(0.15) | possibly_damaging(0.903) | TCGA-FI-A2D0-01 | Endometrium | uterine corpus endometrioid carcinoma | Female | <65 | I/II | Unknown | Unknown | SD |
| RPS11 | SNV | Missense_Mutation | novel | c.409N>G | p.Thr137Ala | p.T137A | P62280 | protein_coding | deleterious(0) | possibly_damaging(0.682) | TCGA-05-4427-01 | Lung | lung adenocarcinoma | Female | >=65 | I/II | Chemotherapy | cisplatin | CR |
| RPS11 | SNV | Missense_Mutation | novel | c.208G>A | p.Gly70Arg | p.G70R | P62280 | protein_coding | deleterious(0.02) | probably_damaging(0.992) | TCGA-NC-A5HT-01 | Lung | lung squamous cell carcinoma | Male | >=65 | III/IV | Chemotherapy | carboplatin | PR |
| RPS11 | SNV | Missense_Mutation | c.95N>C | p.Lys32Thr | p.K32T | P62280 | protein_coding | deleterious(0.02) | benign(0.056) | TCGA-QU-A6IM-01 | Prostate | prostate adenocarcinoma | Male | <65 | 7 | Unknown | Unknown | SD |
| Page: 1 2 |
Top |
Related drugs of malignant transformation related genes |
| Identification of chemicals and drugs interact with genes involved in malignant transfromation |
| (DGIdb 4.0) |
| Entrez ID | Symbol | Category | Interaction Types | Drug Claim Name | Drug Name | PMIDs |
| Page: 1 |

Copyright 2023-Present -The University of Texas Health Science Center at Houston |