
|
|||||
|
 | |
| |
| |
| |
| |
| |
|
Gene: RPS10-NUDT3 |
Gene summary for RPS10-NUDT3 |
| Gene information | Species | Human | Gene symbol | RPS10-NUDT3 | Gene ID | 100529239 |
| Gene name | RPS10-NUDT3 readthrough | |
| Gene Alias | RPS10-NUDT3 | |
| Cytomap | 6p21.31 | |
| Gene Type | protein-coding | GO ID | NA | UniProtAcc | A0A1W2PQS6 |
Top |
Malignant transformation analysis |
| Identification of the aberrant gene expression in precancerous and cancerous lesions by comparing the gene expression of stem-like cells in diseased tissues with normal stem cells |
| Entrez ID | Symbol | Replicates | Species | Organ | Tissue | Adj P-value | Log2FC | Malignancy |
| 100529239 | RPS10-NUDT3 | LZE2T | Human | Esophagus | ESCC | 2.18e-04 | 4.66e-01 | 0.082 |
| 100529239 | RPS10-NUDT3 | LZE3D | Human | Esophagus | HGIN | 3.66e-03 | 5.85e-01 | 0.0668 |
| 100529239 | RPS10-NUDT3 | LZE4T | Human | Esophagus | ESCC | 1.86e-29 | 6.52e-01 | 0.0811 |
| 100529239 | RPS10-NUDT3 | LZE5T | Human | Esophagus | ESCC | 1.54e-04 | 3.89e-01 | 0.0514 |
| 100529239 | RPS10-NUDT3 | LZE7T | Human | Esophagus | ESCC | 2.68e-16 | 7.49e-01 | 0.0667 |
| 100529239 | RPS10-NUDT3 | LZE8T | Human | Esophagus | ESCC | 5.45e-16 | 4.71e-01 | 0.067 |
| 100529239 | RPS10-NUDT3 | LZE20T | Human | Esophagus | ESCC | 1.85e-18 | 5.17e-01 | 0.0662 |
| 100529239 | RPS10-NUDT3 | LZE21D1 | Human | Esophagus | HGIN | 3.53e-05 | 5.15e-01 | 0.0632 |
| 100529239 | RPS10-NUDT3 | LZE22D1 | Human | Esophagus | HGIN | 1.32e-09 | 3.26e-01 | 0.0595 |
| 100529239 | RPS10-NUDT3 | LZE22T | Human | Esophagus | ESCC | 8.47e-11 | 5.38e-01 | 0.068 |
| 100529239 | RPS10-NUDT3 | LZE24T | Human | Esophagus | ESCC | 6.51e-29 | 6.03e-01 | 0.0596 |
| 100529239 | RPS10-NUDT3 | LZE22D3 | Human | Esophagus | HGIN | 4.92e-04 | 7.16e-01 | 0.0653 |
| 100529239 | RPS10-NUDT3 | LZE21T | Human | Esophagus | ESCC | 2.14e-10 | 4.89e-01 | 0.0655 |
| 100529239 | RPS10-NUDT3 | LZE6T | Human | Esophagus | ESCC | 7.10e-29 | 1.02e+00 | 0.0845 |
| Page: 1 |
| Tissue | Expression Dynamics | Abbreviation |
| Esophagus | 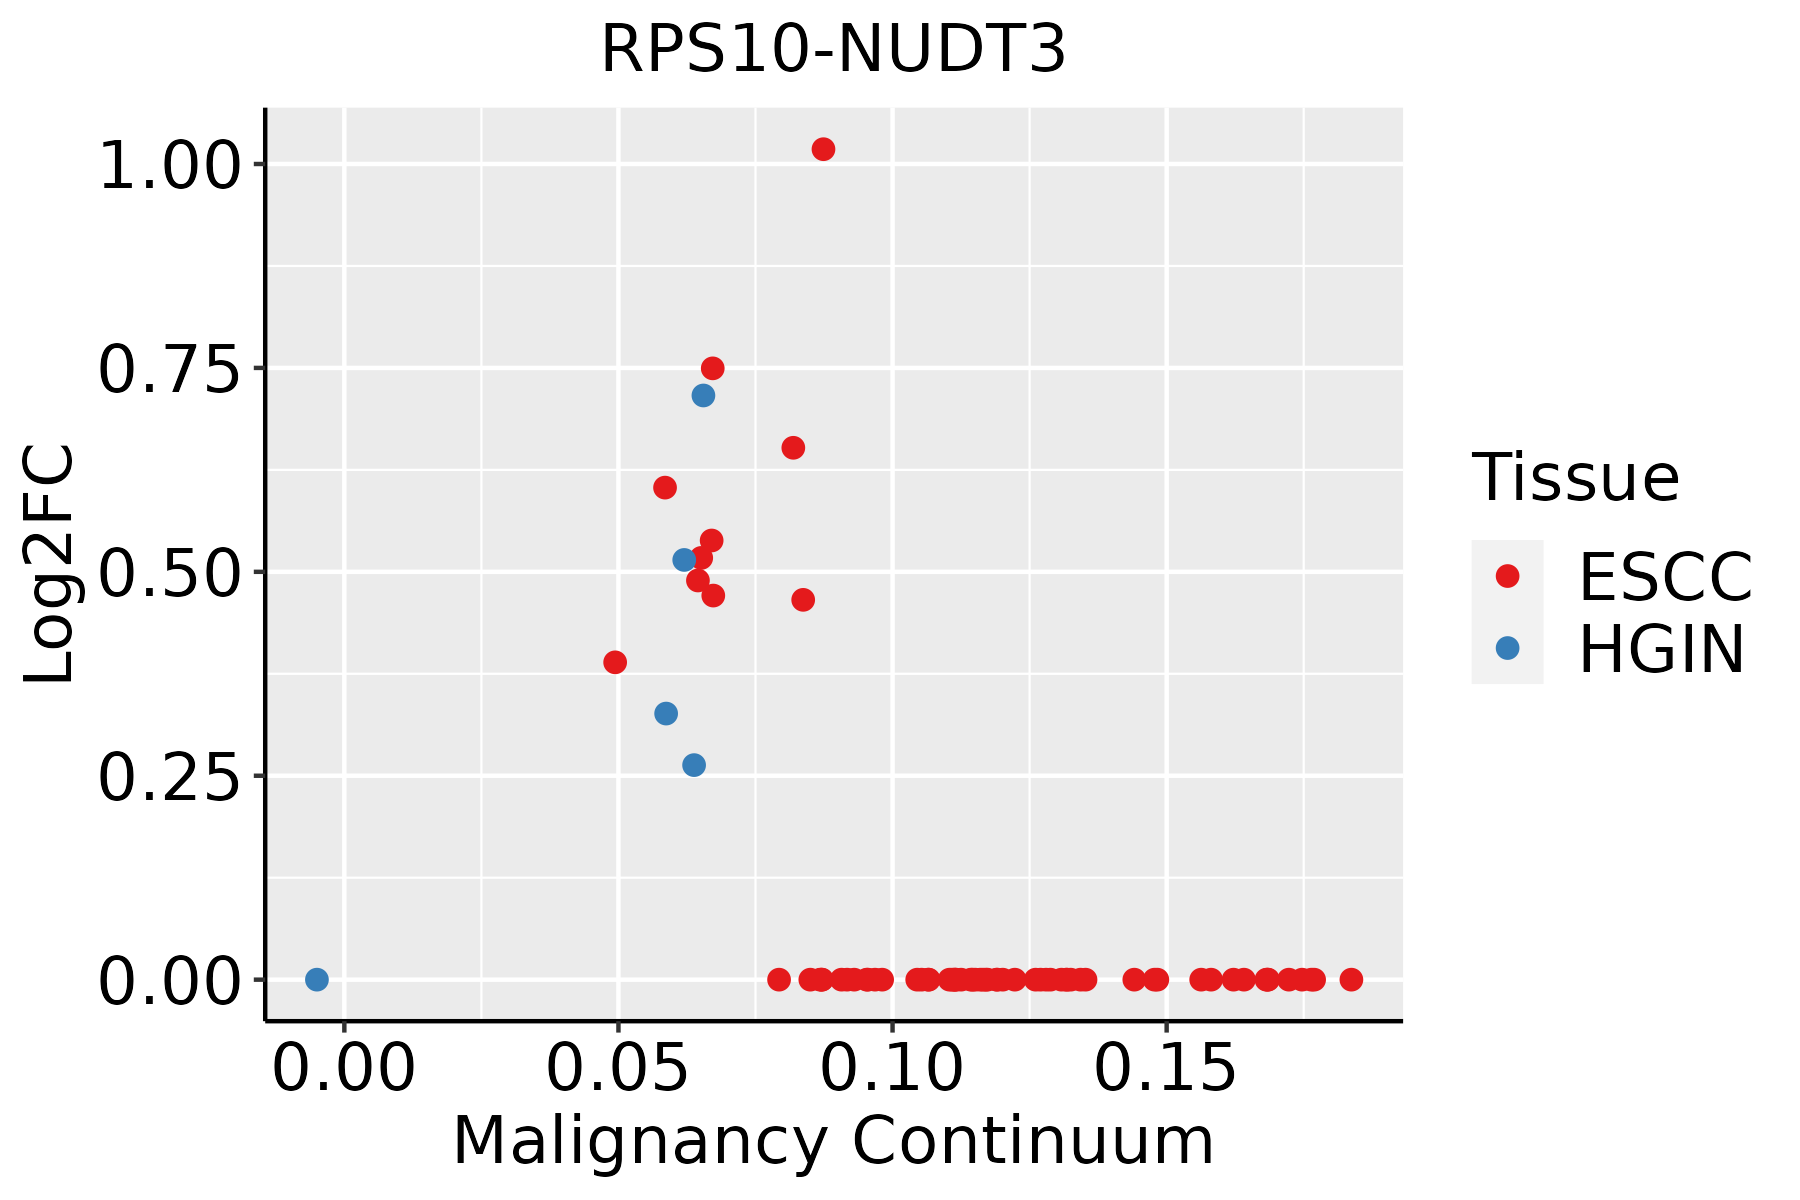 | ESCC: Esophageal squamous cell carcinoma |
| HGIN: High-grade intraepithelial neoplasias | ||
| LGIN: Low-grade intraepithelial neoplasias |
| ∗log2FC in expression of this searched gene in stem-like cells from each diseased tissue sample relative to stem-like cells in normal samples in each tissue plotted against the malignancy continuum. Samples are colored based on if they are from different disease stage. |
Top |
Malignant transformation related pathway analysis |
| Find out the enriched GO biological processes and KEGG pathways involved in transition from healthy to precancer to cancer |
| Tissue | Disease Stage | Enriched GO biological Processes |
| Colorectum | AD |  |
| Colorectum | SER |  |
| Colorectum | MSS |  |
| Colorectum | MSI-H |  |
| Colorectum | FAP |  |
| ∗Top 15 enriched GO BP terms are showed in the bar plot of each disease state in each tissue. Each row represents a significant GO biological process which is colored according to the -log10(p.adjust). |
| Page: 1 2 3 4 5 6 7 8 9 |
| GO ID | Tissue | Disease Stage | Description | Gene Ratio | Bg Ratio | pvalue | p.adjust | Count |
| Page: 1 |
| Pathway ID | Tissue | Disease Stage | Description | Gene Ratio | Bg Ratio | pvalue | p.adjust | qvalue | Count |
| hsa0301039 | Esophagus | HGIN | Ribosome | 108/1383 | 167/8465 | 1.44e-45 | 4.71e-43 | 3.74e-43 | 108 |
| hsa0517139 | Esophagus | HGIN | Coronavirus disease - COVID-19 | 105/1383 | 232/8465 | 7.84e-26 | 5.11e-24 | 4.06e-24 | 105 |
| hsa03010115 | Esophagus | HGIN | Ribosome | 108/1383 | 167/8465 | 1.44e-45 | 4.71e-43 | 3.74e-43 | 108 |
| hsa05171115 | Esophagus | HGIN | Coronavirus disease - COVID-19 | 105/1383 | 232/8465 | 7.84e-26 | 5.11e-24 | 4.06e-24 | 105 |
| hsa03010211 | Esophagus | ESCC | Ribosome | 129/4205 | 167/8465 | 1.43e-13 | 3.43e-12 | 1.75e-12 | 129 |
| hsa05171211 | Esophagus | ESCC | Coronavirus disease - COVID-19 | 156/4205 | 232/8465 | 3.18e-08 | 2.68e-07 | 1.37e-07 | 156 |
| hsa03010310 | Esophagus | ESCC | Ribosome | 129/4205 | 167/8465 | 1.43e-13 | 3.43e-12 | 1.75e-12 | 129 |
| hsa05171310 | Esophagus | ESCC | Coronavirus disease - COVID-19 | 156/4205 | 232/8465 | 3.18e-08 | 2.68e-07 | 1.37e-07 | 156 |
| Page: 1 |
Top |
Cell-cell communication analysis |
| Identification of potential cell-cell interactions between two cell types and their ligand-receptor pairs for different disease states |
| Ligand | Receptor | LRpair | Pathway | Tissue | Disease Stage |
| Page: 1 |
Top |
Single-cell gene regulatory network inference analysis |
| Find out the significant the regulons (TFs) and the target genes of each regulon across cell types for different disease states |
| TF | Cell Type | Tissue | Disease Stage | Target Gene | RSS | Regulon Activity |
| ∗The dot plots of a searched regulon are shown for all cell subpopulations in each disease state of each tissue based on the regulon specific score inferred using pySCENIC and by calculating the average expression. |
| Page: 1 |
Top |
Somatic mutation of malignant transformation related genes |
| Annotation of somatic variants for genes involved in malignant transformation |
| Hugo Symbol | Variant Class | Variant Classification | dbSNP RS | HGVSc | HGVSp | HGVSp Short | SWISSPROT | BIOTYPE | SIFT | PolyPhen | Tumor Sample Barcode | Tissue | Histology | Sex | Age | Stage | Therapy Types | Drugs | Outcome |
| RPS10-NUDT3 | deletion | Frame_Shift_Del | novel | c.686_696delNNNNNNNNNNN | p.Ser229TrpfsTer8 | p.S229Wfs*8 | protein_coding | TCGA-BH-A1F6-01 | Breast | breast invasive carcinoma | Female | <65 | III/IV | Unknown | Unknown | SD | |||
| RPS10-NUDT3 | SNV | Missense_Mutation | rs770994608 | c.730G>A | p.Ala244Thr | p.A244T | protein_coding | deleterious_low_confidence(0) | possibly_damaging(0.576) | TCGA-NH-A5IV-01 | Colorectum | colon adenocarcinoma | Female | >=65 | I/II | Unknown | Unknown | SD | |
| RPS10-NUDT3 | SNV | Missense_Mutation | novel | c.731N>T | p.Ala244Val | p.A244V | protein_coding | deleterious_low_confidence(0) | possibly_damaging(0.525) | TCGA-A5-A0G2-01 | Endometrium | uterine corpus endometrioid carcinoma | Female | <65 | III/IV | Unknown | Unknown | SD | |
| RPS10-NUDT3 | SNV | Missense_Mutation | novel | c.737N>C | p.Lys246Thr | p.K246T | protein_coding | tolerated_low_confidence(0.09) | possibly_damaging(0.593) | TCGA-AX-A1CE-01 | Endometrium | uterine corpus endometrioid carcinoma | Female | <65 | I/II | Unspecific | Paclitaxel | SD | |
| RPS10-NUDT3 | SNV | Missense_Mutation | rs770994608 | c.730N>A | p.Ala244Thr | p.A244T | protein_coding | deleterious_low_confidence(0) | possibly_damaging(0.576) | TCGA-B5-A1MR-01 | Endometrium | uterine corpus endometrioid carcinoma | Female | >=65 | III/IV | Unknown | Unknown | SD | |
| RPS10-NUDT3 | SNV | Missense_Mutation | novel | c.698G>T | p.Gly233Val | p.G233V | protein_coding | deleterious_low_confidence(0) | probably_damaging(0.98) | TCGA-55-A493-01 | Lung | lung adenocarcinoma | Female | <65 | I/II | Unknown | Unknown | SD | |
| RPS10-NUDT3 | SNV | Missense_Mutation | c.738A>T | p.Lys246Asn | p.K246N | protein_coding | tolerated_low_confidence(0.1) | possibly_damaging(0.593) | TCGA-HU-A4GF-01 | Stomach | stomach adenocarcinoma | Male | >=65 | I/II | Unknown | Unknown | SD |
| Page: 1 |
Top |
Related drugs of malignant transformation related genes |
| Identification of chemicals and drugs interact with genes involved in malignant transfromation |
| (DGIdb 4.0) |
| Entrez ID | Symbol | Category | Interaction Types | Drug Claim Name | Drug Name | PMIDs |
| Page: 1 |

Copyright 2023-Present -The University of Texas Health Science Center at Houston |