
|
|||||
|
 | |
| |
| |
| |
| |
| |
|
Gene: RPRD1A |
Gene summary for RPRD1A |
| Gene information | Species | Human | Gene symbol | RPRD1A | Gene ID | 55197 |
| Gene name | regulation of nuclear pre-mRNA domain containing 1A | |
| Gene Alias | HsT3101 | |
| Cytomap | 18q12.2 | |
| Gene Type | protein-coding | GO ID | GO:0006139 | UniProtAcc | Q96P16 |
Top |
Malignant transformation analysis |
| Identification of the aberrant gene expression in precancerous and cancerous lesions by comparing the gene expression of stem-like cells in diseased tissues with normal stem cells |
| Entrez ID | Symbol | Replicates | Species | Organ | Tissue | Adj P-value | Log2FC | Malignancy |
| 55197 | RPRD1A | CCI_2 | Human | Cervix | CC | 1.09e-04 | 7.23e-01 | 0.5249 |
| 55197 | RPRD1A | CCI_3 | Human | Cervix | CC | 4.86e-03 | 6.07e-01 | 0.516 |
| 55197 | RPRD1A | LZE2T | Human | Esophagus | ESCC | 1.69e-02 | 2.96e-01 | 0.082 |
| 55197 | RPRD1A | LZE4T | Human | Esophagus | ESCC | 7.74e-10 | 2.44e-01 | 0.0811 |
| 55197 | RPRD1A | LZE7T | Human | Esophagus | ESCC | 1.71e-13 | 6.68e-01 | 0.0667 |
| 55197 | RPRD1A | LZE8T | Human | Esophagus | ESCC | 7.56e-05 | 3.72e-02 | 0.067 |
| 55197 | RPRD1A | LZE24T | Human | Esophagus | ESCC | 5.37e-11 | 2.48e-01 | 0.0596 |
| 55197 | RPRD1A | LZE21T | Human | Esophagus | ESCC | 9.49e-03 | 1.58e-01 | 0.0655 |
| 55197 | RPRD1A | P1T-E | Human | Esophagus | ESCC | 1.08e-09 | 4.52e-01 | 0.0875 |
| 55197 | RPRD1A | P2T-E | Human | Esophagus | ESCC | 5.50e-26 | 5.21e-01 | 0.1177 |
| 55197 | RPRD1A | P4T-E | Human | Esophagus | ESCC | 6.92e-30 | 4.96e-01 | 0.1323 |
| 55197 | RPRD1A | P5T-E | Human | Esophagus | ESCC | 2.81e-21 | 1.69e-01 | 0.1327 |
| 55197 | RPRD1A | P8T-E | Human | Esophagus | ESCC | 1.24e-23 | 3.47e-01 | 0.0889 |
| 55197 | RPRD1A | P9T-E | Human | Esophagus | ESCC | 1.07e-34 | 6.68e-01 | 0.1131 |
| 55197 | RPRD1A | P10T-E | Human | Esophagus | ESCC | 7.93e-38 | 6.26e-01 | 0.116 |
| 55197 | RPRD1A | P11T-E | Human | Esophagus | ESCC | 7.82e-08 | 1.04e-01 | 0.1426 |
| 55197 | RPRD1A | P12T-E | Human | Esophagus | ESCC | 4.08e-19 | 3.29e-01 | 0.1122 |
| 55197 | RPRD1A | P15T-E | Human | Esophagus | ESCC | 1.78e-14 | 2.96e-01 | 0.1149 |
| 55197 | RPRD1A | P16T-E | Human | Esophagus | ESCC | 3.96e-27 | 3.03e-01 | 0.1153 |
| 55197 | RPRD1A | P17T-E | Human | Esophagus | ESCC | 1.06e-11 | 4.03e-01 | 0.1278 |
| Page: 1 2 3 4 5 6 |
| Tissue | Expression Dynamics | Abbreviation |
| Cervix | 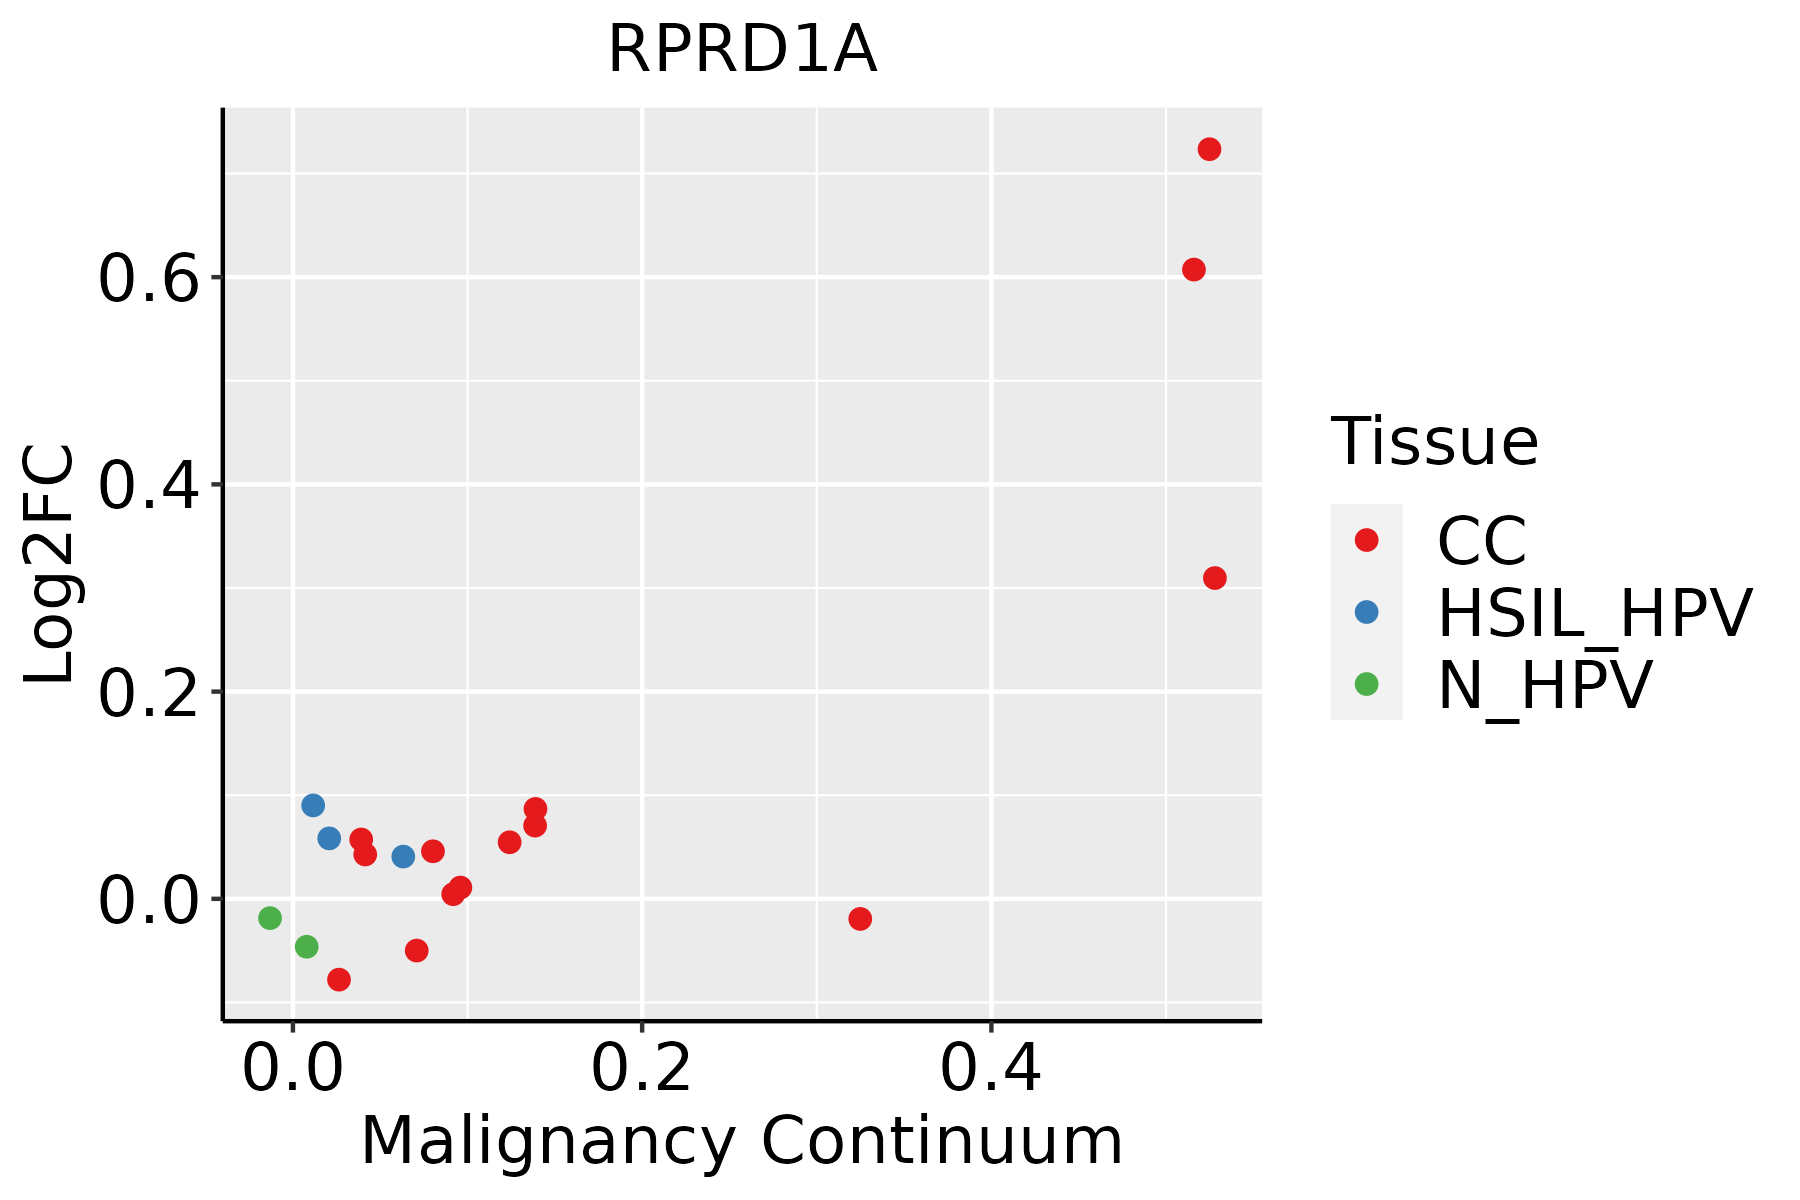 | CC: Cervix cancer |
| HSIL_HPV: HPV-infected high-grade squamous intraepithelial lesions | ||
| N_HPV: HPV-infected normal cervix | ||
| Esophagus | 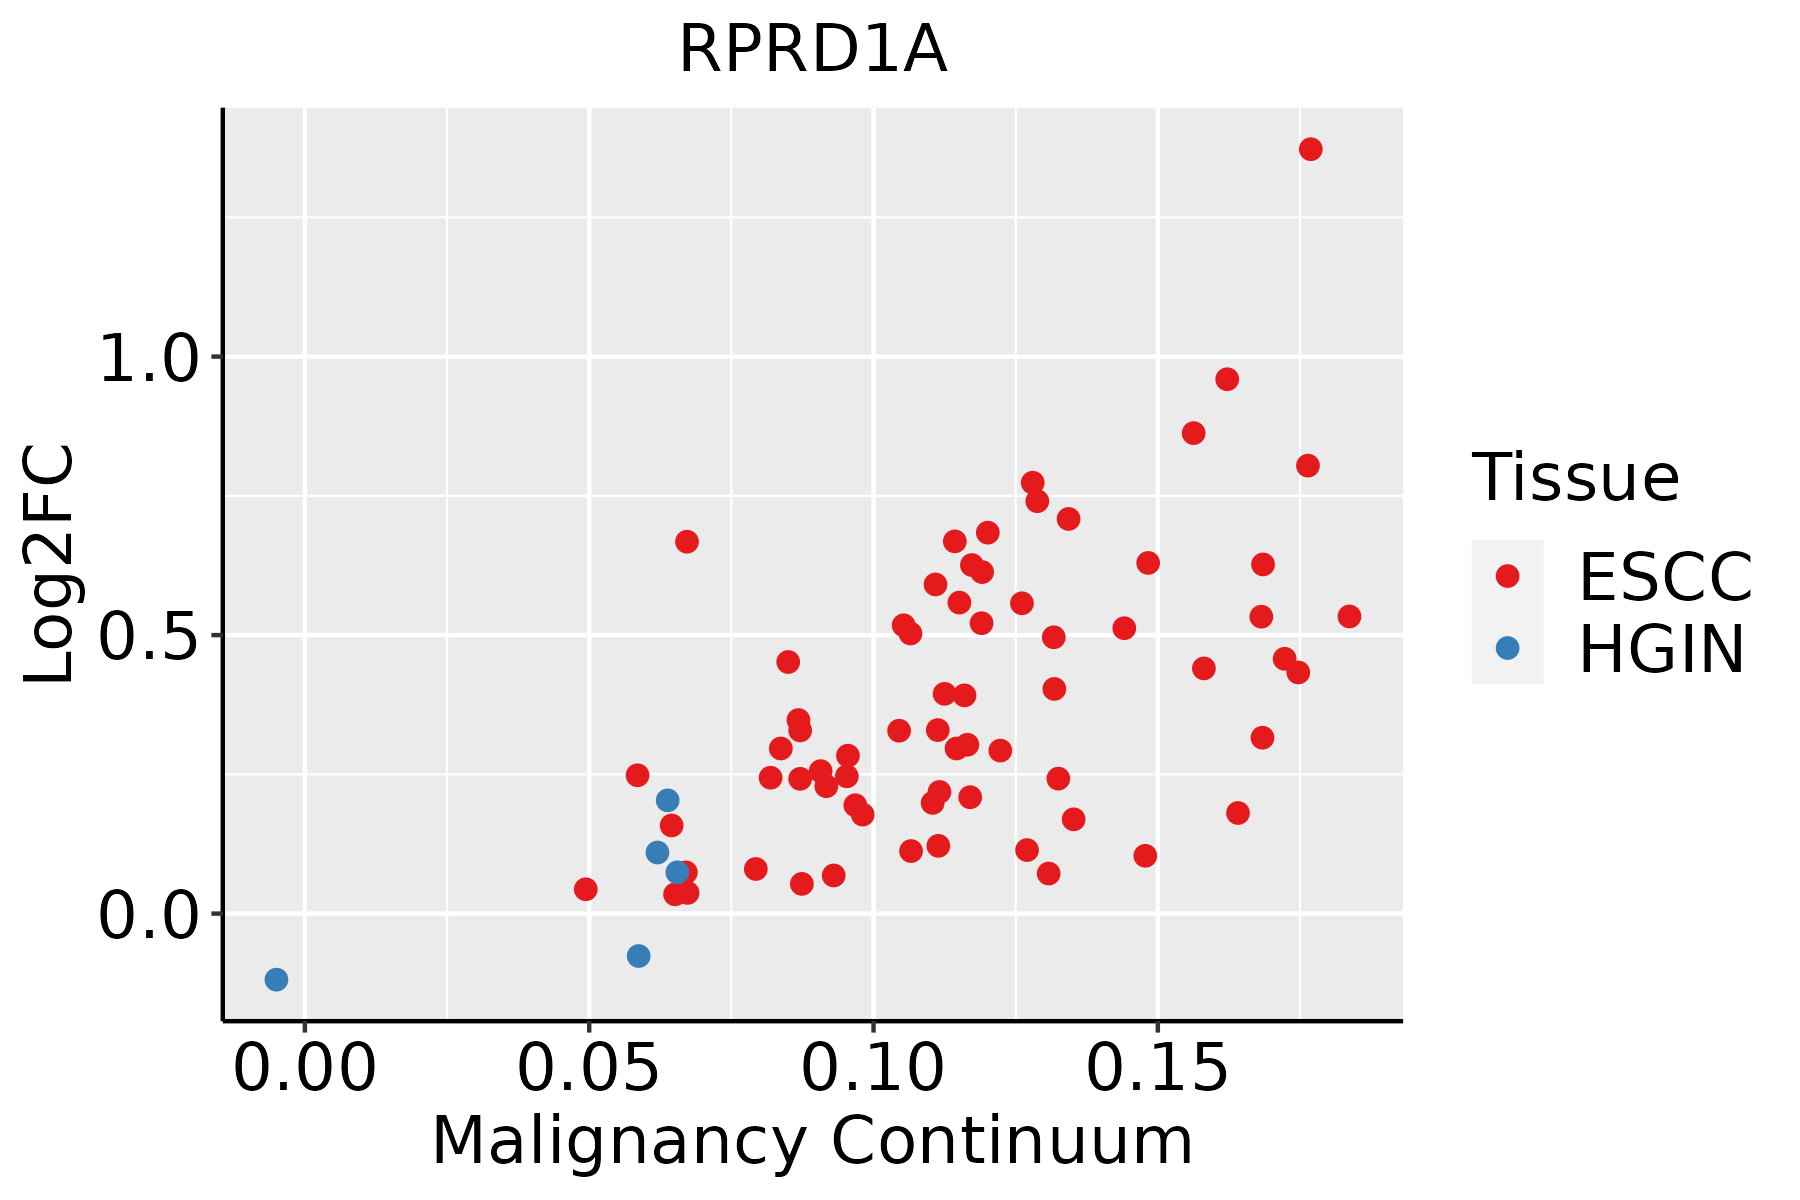 | ESCC: Esophageal squamous cell carcinoma |
| HGIN: High-grade intraepithelial neoplasias | ||
| LGIN: Low-grade intraepithelial neoplasias | ||
| Liver | 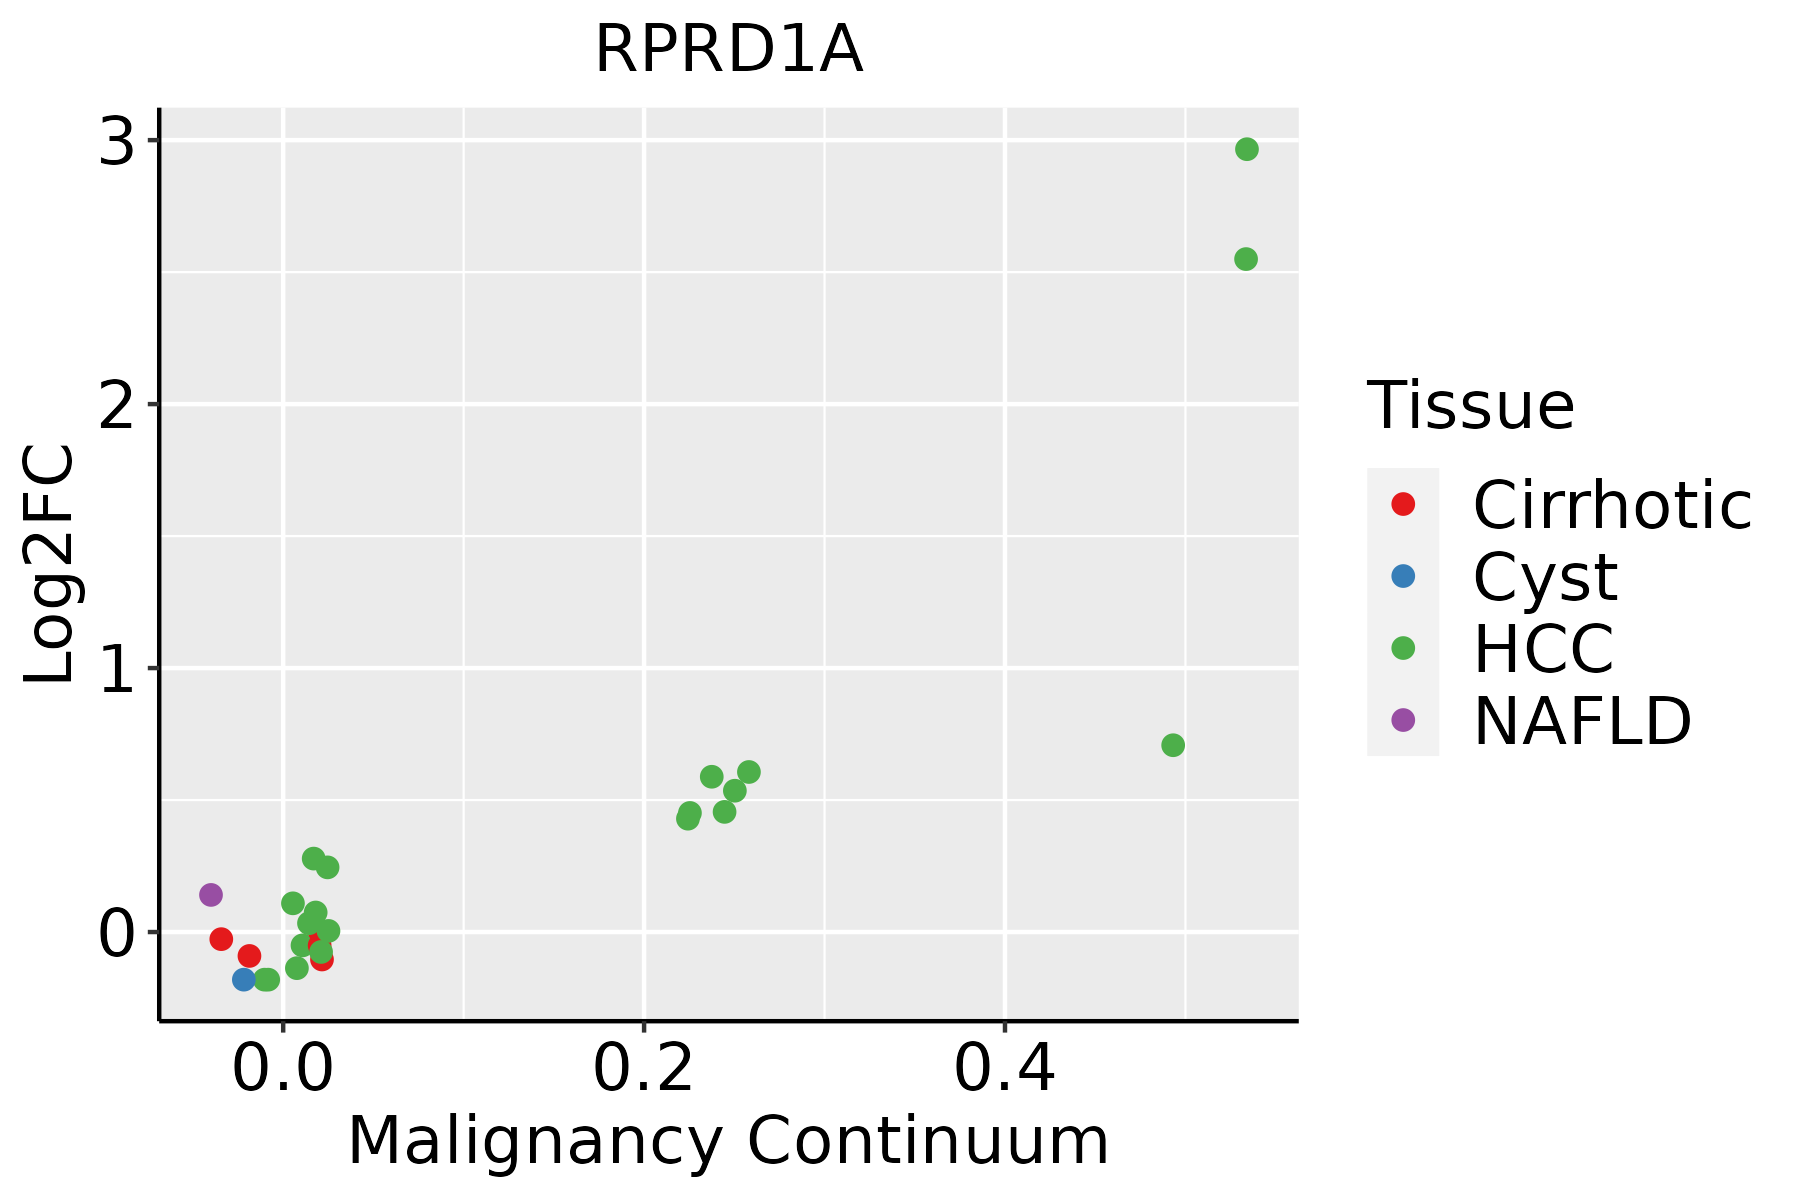 | HCC: Hepatocellular carcinoma |
| NAFLD: Non-alcoholic fatty liver disease | ||
| Oral Cavity |  | EOLP: Erosive Oral lichen planus |
| LP: leukoplakia | ||
| NEOLP: Non-erosive oral lichen planus | ||
| OSCC: Oral squamous cell carcinoma | ||
| Skin | 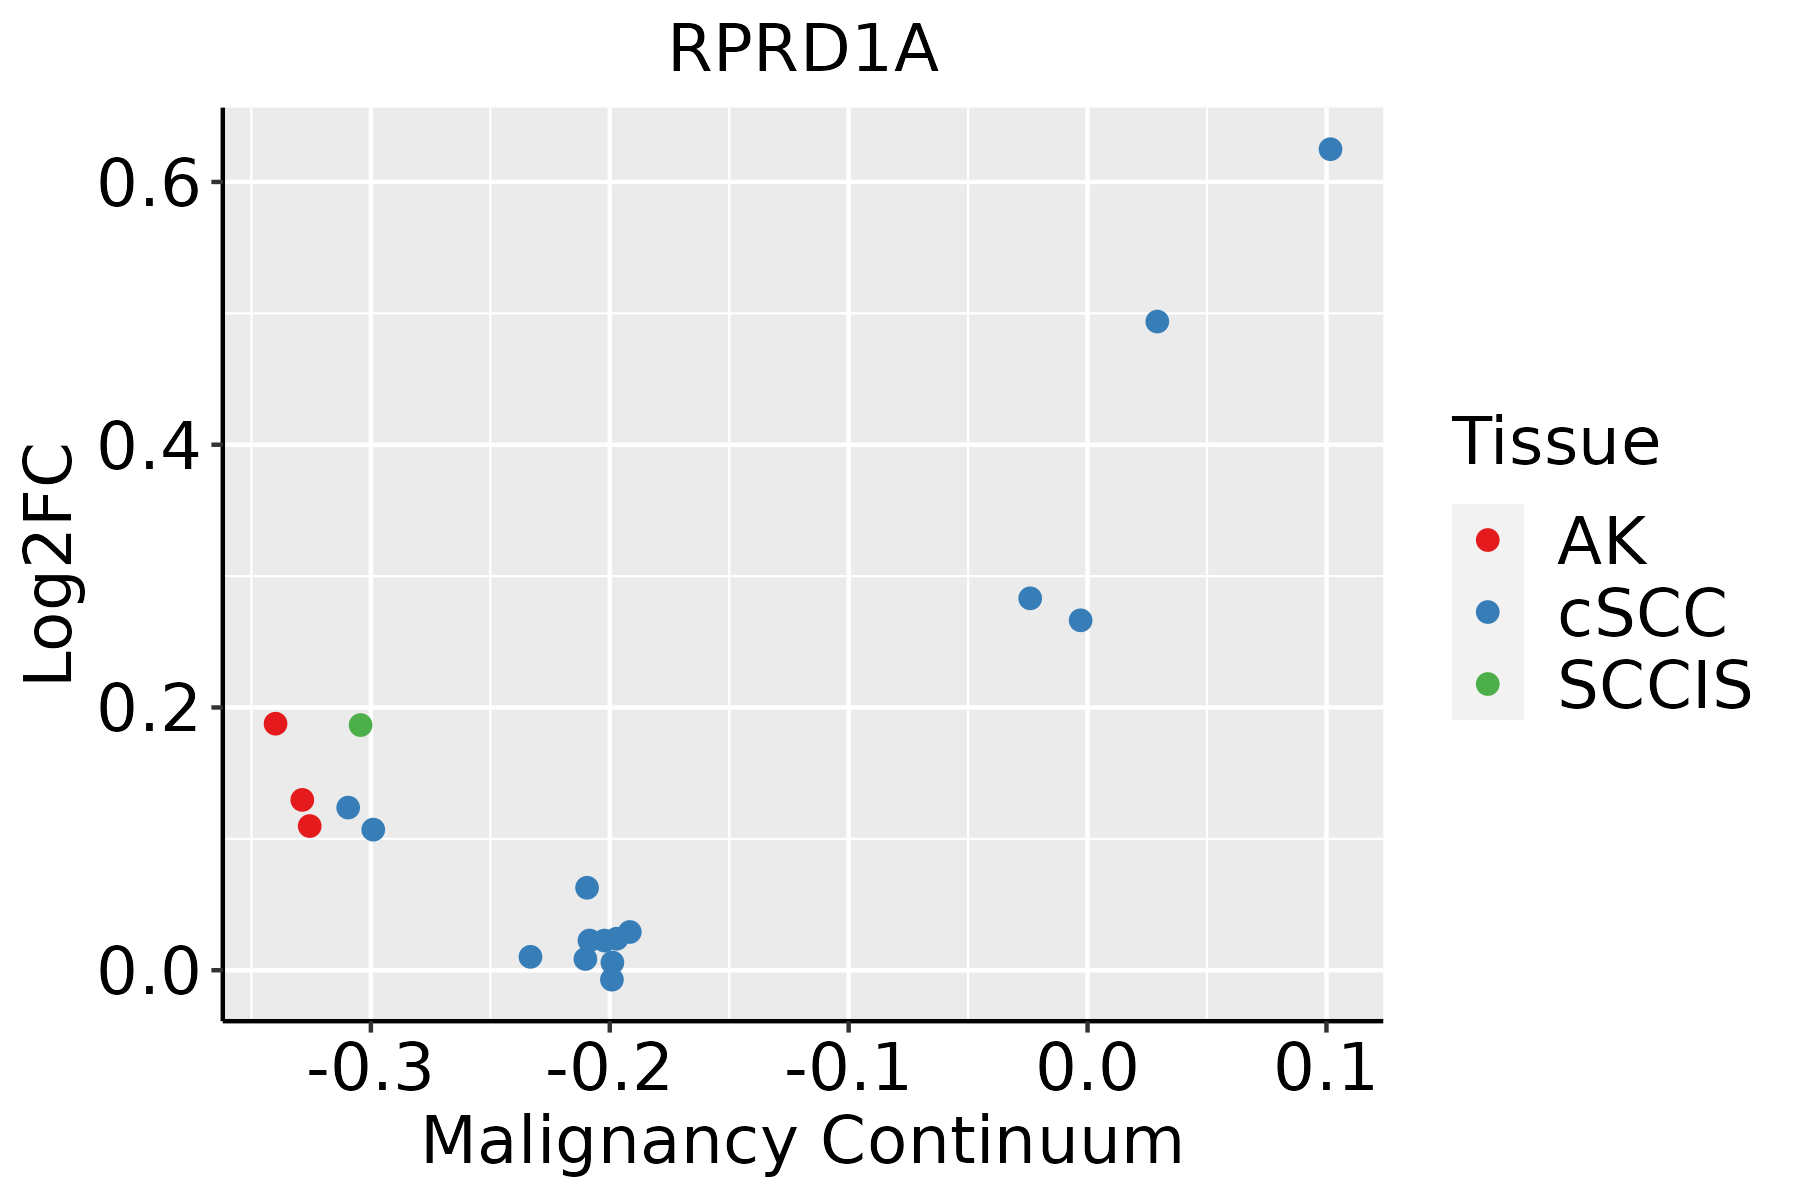 | AK: Actinic keratosis |
| cSCC: Cutaneous squamous cell carcinoma | ||
| SCCIS:squamous cell carcinoma in situ | ||
| Thyroid |  | ATC: Anaplastic thyroid cancer |
| HT: Hashimoto's thyroiditis | ||
| PTC: Papillary thyroid cancer |
| ∗log2FC in expression of this searched gene in stem-like cells from each diseased tissue sample relative to stem-like cells in normal samples in each tissue plotted against the malignancy continuum. Samples are colored based on if they are from different disease stage. |
Top |
Malignant transformation related pathway analysis |
| Find out the enriched GO biological processes and KEGG pathways involved in transition from healthy to precancer to cancer |
| Tissue | Disease Stage | Enriched GO biological Processes |
| Colorectum | AD |  |
| Colorectum | SER |  |
| Colorectum | MSS |  |
| Colorectum | MSI-H |  |
| Colorectum | FAP |  |
| ∗Top 15 enriched GO BP terms are showed in the bar plot of each disease state in each tissue. Each row represents a significant GO biological process which is colored according to the -log10(p.adjust). |
| Page: 1 2 3 4 5 6 7 8 9 |
| GO ID | Tissue | Disease Stage | Description | Gene Ratio | Bg Ratio | pvalue | p.adjust | Count |
| GO:00064708 | Cervix | CC | protein dephosphorylation | 60/2311 | 281/18723 | 1.33e-05 | 2.68e-04 | 60 |
| GO:00163117 | Cervix | CC | dephosphorylation | 73/2311 | 417/18723 | 1.23e-03 | 9.87e-03 | 73 |
| GO:001631110 | Esophagus | ESCC | dephosphorylation | 251/8552 | 417/18723 | 1.26e-09 | 2.99e-08 | 251 |
| GO:000647018 | Esophagus | ESCC | protein dephosphorylation | 177/8552 | 281/18723 | 3.13e-09 | 6.72e-08 | 177 |
| GO:003112412 | Esophagus | ESCC | mRNA 3'-end processing | 47/8552 | 62/18723 | 1.29e-06 | 1.58e-05 | 47 |
| GO:00311233 | Esophagus | ESCC | RNA 3'-end processing | 76/8552 | 116/18723 | 1.25e-05 | 1.15e-04 | 76 |
| GO:00311241 | Liver | HCC | mRNA 3'-end processing | 50/7958 | 62/18723 | 8.44e-10 | 2.60e-08 | 50 |
| GO:00311231 | Liver | HCC | RNA 3'-end processing | 81/7958 | 116/18723 | 2.27e-09 | 6.32e-08 | 81 |
| GO:001631121 | Liver | HCC | dephosphorylation | 230/7958 | 417/18723 | 1.00e-07 | 1.96e-06 | 230 |
| GO:000647021 | Liver | HCC | protein dephosphorylation | 162/7958 | 281/18723 | 1.91e-07 | 3.46e-06 | 162 |
| GO:00311242 | Oral cavity | OSCC | mRNA 3'-end processing | 49/7305 | 62/18723 | 1.40e-10 | 4.14e-09 | 49 |
| GO:000647015 | Oral cavity | OSCC | protein dephosphorylation | 162/7305 | 281/18723 | 1.56e-10 | 4.56e-09 | 162 |
| GO:00163119 | Oral cavity | OSCC | dephosphorylation | 220/7305 | 417/18723 | 6.33e-09 | 1.34e-07 | 220 |
| GO:00311232 | Oral cavity | OSCC | RNA 3'-end processing | 75/7305 | 116/18723 | 1.93e-08 | 3.79e-07 | 75 |
| GO:00311234 | Skin | cSCC | RNA 3'-end processing | 58/4864 | 116/18723 | 2.47e-08 | 6.89e-07 | 58 |
| GO:000647024 | Skin | cSCC | protein dephosphorylation | 111/4864 | 281/18723 | 4.10e-07 | 7.96e-06 | 111 |
| GO:00311244 | Skin | cSCC | mRNA 3'-end processing | 34/4864 | 62/18723 | 1.27e-06 | 2.20e-05 | 34 |
| GO:001631115 | Skin | cSCC | dephosphorylation | 134/4864 | 417/18723 | 2.65e-03 | 1.50e-02 | 134 |
| GO:00311235 | Thyroid | PTC | RNA 3'-end processing | 65/5968 | 116/18723 | 6.24e-08 | 1.30e-06 | 65 |
| GO:00311245 | Thyroid | PTC | mRNA 3'-end processing | 40/5968 | 62/18723 | 1.28e-07 | 2.48e-06 | 40 |
| Page: 1 2 |
| Pathway ID | Tissue | Disease Stage | Description | Gene Ratio | Bg Ratio | pvalue | p.adjust | qvalue | Count |
| Page: 1 |
Top |
Cell-cell communication analysis |
| Identification of potential cell-cell interactions between two cell types and their ligand-receptor pairs for different disease states |
| Ligand | Receptor | LRpair | Pathway | Tissue | Disease Stage |
| Page: 1 |
Top |
Single-cell gene regulatory network inference analysis |
| Find out the significant the regulons (TFs) and the target genes of each regulon across cell types for different disease states |
| TF | Cell Type | Tissue | Disease Stage | Target Gene | RSS | Regulon Activity |
| ∗The dot plots of a searched regulon are shown for all cell subpopulations in each disease state of each tissue based on the regulon specific score inferred using pySCENIC and by calculating the average expression. |
| Page: 1 |
Top |
Somatic mutation of malignant transformation related genes |
| Annotation of somatic variants for genes involved in malignant transformation |
| Hugo Symbol | Variant Class | Variant Classification | dbSNP RS | HGVSc | HGVSp | HGVSp Short | SWISSPROT | BIOTYPE | SIFT | PolyPhen | Tumor Sample Barcode | Tissue | Histology | Sex | Age | Stage | Therapy Types | Drugs | Outcome |
| RPRD1A | SNV | Missense_Mutation | novel | c.894N>G | p.Ser298Arg | p.S298R | Q96P16 | protein_coding | deleterious(0) | possibly_damaging(0.514) | TCGA-E2-A1B4-01 | Breast | breast invasive carcinoma | Female | >=65 | III/IV | Hormone Therapy | arimidex | SD |
| RPRD1A | SNV | Missense_Mutation | rs754314786 | c.656C>T | p.Ala219Val | p.A219V | Q96P16 | protein_coding | deleterious(0) | probably_damaging(0.992) | TCGA-E9-A1ND-01 | Breast | breast invasive carcinoma | Female | >=65 | I/II | Hormone Therapy | aromasin | SD |
| RPRD1A | SNV | Missense_Mutation | novel | c.634C>T | p.Leu212Phe | p.L212F | Q96P16 | protein_coding | deleterious(0) | probably_damaging(0.917) | TCGA-EX-A8YF-01 | Cervix | cervical & endocervical cancer | Female | <65 | I/II | Unknown | Unknown | PD |
| RPRD1A | SNV | Missense_Mutation | c.826N>T | p.Arg276Cys | p.R276C | Q96P16 | protein_coding | deleterious(0.04) | probably_damaging(0.993) | TCGA-AA-A00N-01 | Colorectum | colon adenocarcinoma | Male | >=65 | I/II | Unknown | Unknown | PD | |
| RPRD1A | SNV | Missense_Mutation | novel | c.156N>C | p.Lys52Asn | p.K52N | Q96P16 | protein_coding | tolerated(0.09) | benign(0.058) | TCGA-AZ-4315-01 | Colorectum | colon adenocarcinoma | Male | <65 | I/II | Unknown | Unknown | SD |
| RPRD1A | SNV | Missense_Mutation | rs781199117 | c.358G>A | p.Asp120Asn | p.D120N | Q96P16 | protein_coding | tolerated(0.22) | benign(0.007) | TCGA-AG-3725-01 | Colorectum | rectum adenocarcinoma | Female | >=65 | III/IV | Unknown | Unknown | SD |
| RPRD1A | SNV | Missense_Mutation | novel | c.869C>A | p.Ser290Tyr | p.S290Y | Q96P16 | protein_coding | deleterious(0) | possibly_damaging(0.905) | TCGA-AG-A002-01 | Colorectum | rectum adenocarcinoma | Male | <65 | I/II | Unknown | Unknown | SD |
| RPRD1A | SNV | Missense_Mutation | rs752379681 | c.914C>T | p.Ala305Val | p.A305V | Q96P16 | protein_coding | deleterious(0) | benign(0.228) | TCGA-A5-A0G2-01 | Endometrium | uterine corpus endometrioid carcinoma | Female | <65 | III/IV | Unknown | Unknown | SD |
| RPRD1A | SNV | Missense_Mutation | novel | c.472N>C | p.Ser158Arg | p.S158R | Q96P16 | protein_coding | tolerated(0.57) | benign(0) | TCGA-A5-A1OF-01 | Endometrium | uterine corpus endometrioid carcinoma | Female | <65 | I/II | Unknown | Unknown | SD |
| RPRD1A | SNV | Missense_Mutation | novel | c.777N>T | p.Glu259Asp | p.E259D | Q96P16 | protein_coding | deleterious(0.02) | possibly_damaging(0.566) | TCGA-AX-A06F-01 | Endometrium | uterine corpus endometrioid carcinoma | Female | <65 | III/IV | Chemotherapy | carboplatin | SD |
| Page: 1 2 3 4 |
Top |
Related drugs of malignant transformation related genes |
| Identification of chemicals and drugs interact with genes involved in malignant transfromation |
| (DGIdb 4.0) |
| Entrez ID | Symbol | Category | Interaction Types | Drug Claim Name | Drug Name | PMIDs |
| Page: 1 |

Copyright 2023-Present -The University of Texas Health Science Center at Houston |