
|
|||||
|
 | |
| |
| |
| |
| |
| |
|
Gene: RPP25 |
Gene summary for RPP25 |
| Gene information | Species | Human | Gene symbol | RPP25 | Gene ID | 54913 |
| Gene name | ribonuclease P and MRP subunit p25 | |
| Gene Alias | RPP25 | |
| Cytomap | 15q24.2 | |
| Gene Type | protein-coding | GO ID | GO:0000966 | UniProtAcc | Q9BUL9 |
Top |
Malignant transformation analysis |
| Identification of the aberrant gene expression in precancerous and cancerous lesions by comparing the gene expression of stem-like cells in diseased tissues with normal stem cells |
| Entrez ID | Symbol | Replicates | Species | Organ | Tissue | Adj P-value | Log2FC | Malignancy |
| 54913 | RPP25 | LZE4T | Human | Esophagus | ESCC | 2.41e-05 | 2.01e-01 | 0.0811 |
| 54913 | RPP25 | LZE20T | Human | Esophagus | ESCC | 1.68e-02 | 7.81e-02 | 0.0662 |
| 54913 | RPP25 | LZE22T | Human | Esophagus | ESCC | 6.53e-05 | 3.99e-01 | 0.068 |
| 54913 | RPP25 | LZE24T | Human | Esophagus | ESCC | 1.64e-09 | 2.50e-01 | 0.0596 |
| 54913 | RPP25 | P1T-E | Human | Esophagus | ESCC | 1.40e-10 | 6.96e-01 | 0.0875 |
| 54913 | RPP25 | P4T-E | Human | Esophagus | ESCC | 1.53e-16 | 2.93e-01 | 0.1323 |
| 54913 | RPP25 | P5T-E | Human | Esophagus | ESCC | 1.08e-13 | 3.01e-01 | 0.1327 |
| 54913 | RPP25 | P8T-E | Human | Esophagus | ESCC | 6.26e-05 | 1.05e-01 | 0.0889 |
| 54913 | RPP25 | P9T-E | Human | Esophagus | ESCC | 7.71e-19 | 3.26e-01 | 0.1131 |
| 54913 | RPP25 | P10T-E | Human | Esophagus | ESCC | 7.83e-28 | 4.97e-01 | 0.116 |
| 54913 | RPP25 | P11T-E | Human | Esophagus | ESCC | 4.42e-05 | 2.67e-01 | 0.1426 |
| 54913 | RPP25 | P15T-E | Human | Esophagus | ESCC | 1.14e-46 | 9.16e-01 | 0.1149 |
| 54913 | RPP25 | P17T-E | Human | Esophagus | ESCC | 6.47e-04 | 1.33e-01 | 0.1278 |
| 54913 | RPP25 | P19T-E | Human | Esophagus | ESCC | 4.17e-05 | 5.31e-01 | 0.1662 |
| 54913 | RPP25 | P20T-E | Human | Esophagus | ESCC | 1.85e-19 | 4.42e-01 | 0.1124 |
| 54913 | RPP25 | P21T-E | Human | Esophagus | ESCC | 2.63e-17 | 4.08e-01 | 0.1617 |
| 54913 | RPP25 | P22T-E | Human | Esophagus | ESCC | 1.12e-12 | 1.77e-01 | 0.1236 |
| 54913 | RPP25 | P23T-E | Human | Esophagus | ESCC | 9.67e-46 | 1.44e+00 | 0.108 |
| 54913 | RPP25 | P24T-E | Human | Esophagus | ESCC | 1.47e-12 | 3.59e-01 | 0.1287 |
| 54913 | RPP25 | P26T-E | Human | Esophagus | ESCC | 9.13e-42 | 7.78e-01 | 0.1276 |
| Page: 1 2 3 4 |
| Tissue | Expression Dynamics | Abbreviation |
| Esophagus |  | ESCC: Esophageal squamous cell carcinoma |
| HGIN: High-grade intraepithelial neoplasias | ||
| LGIN: Low-grade intraepithelial neoplasias | ||
| Liver | 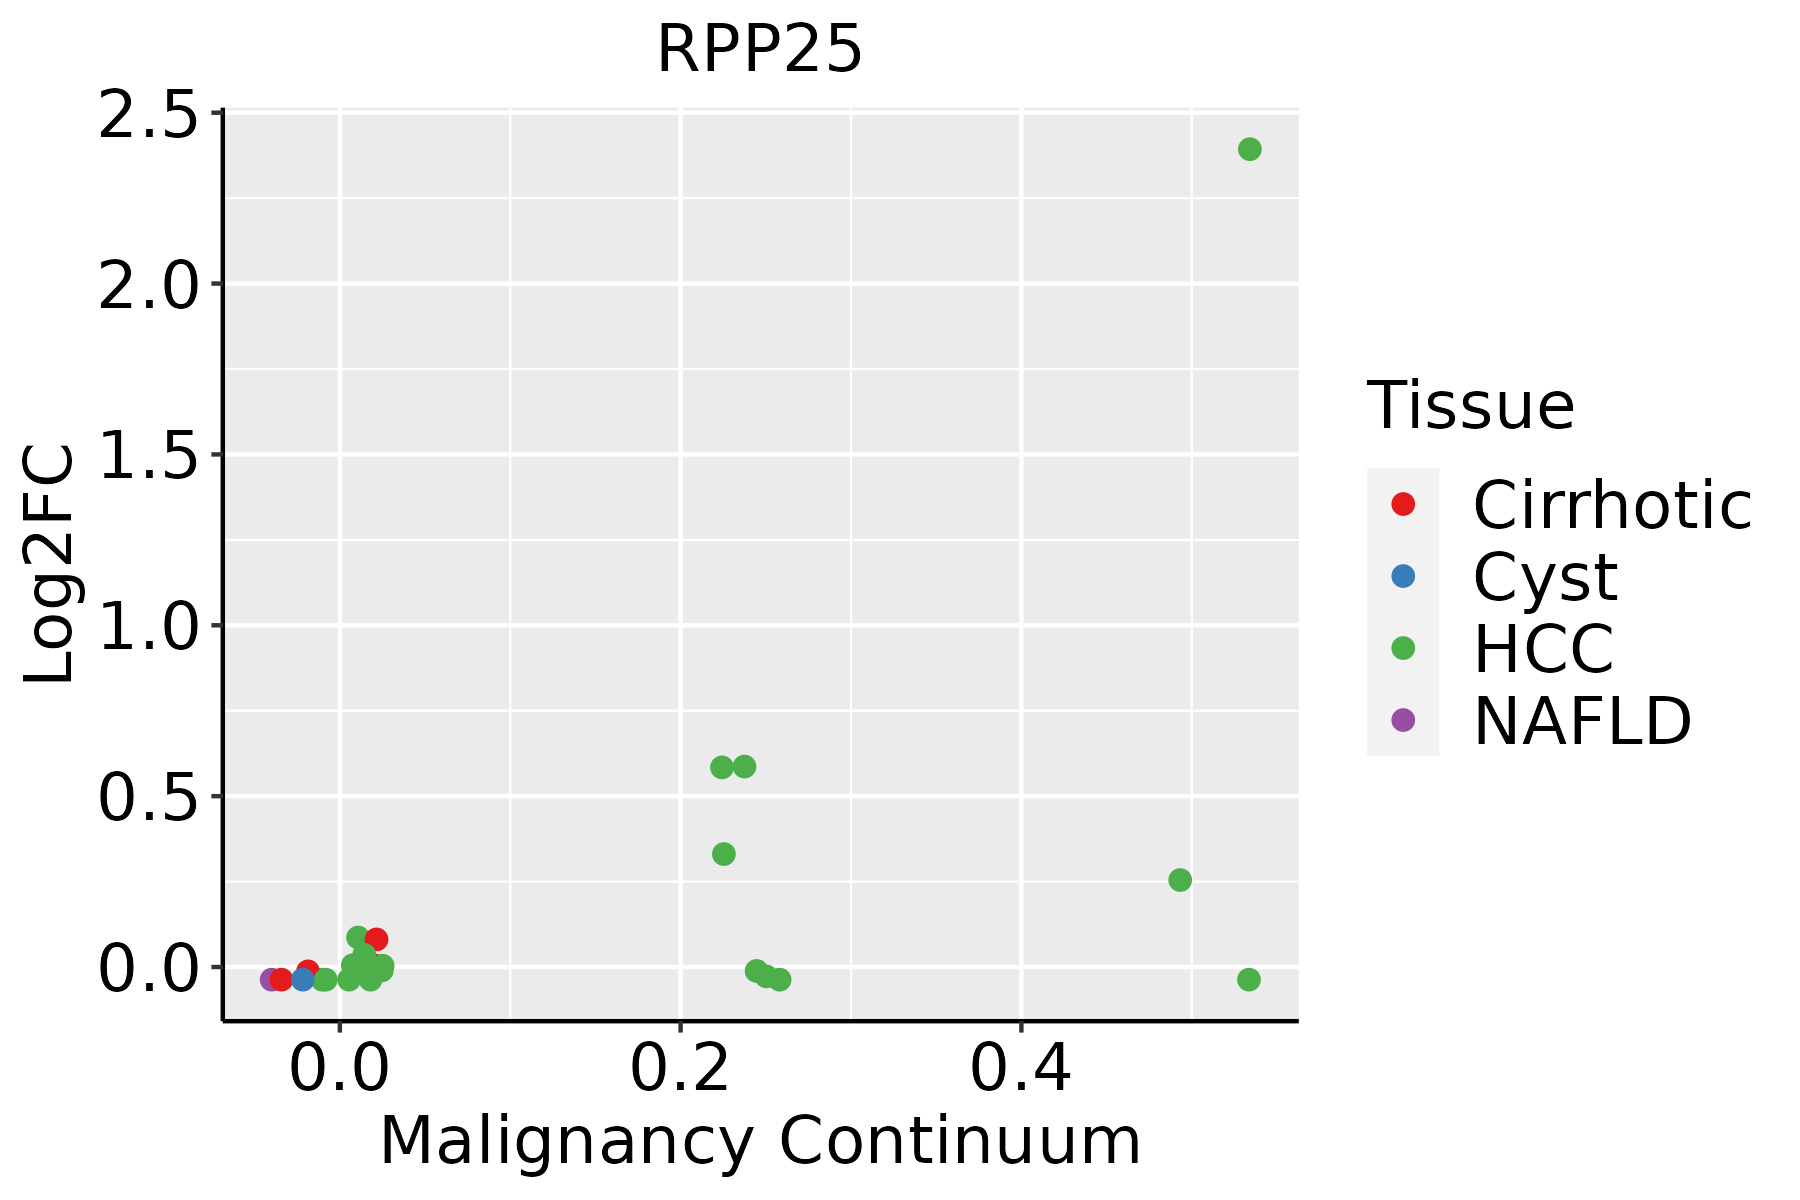 | HCC: Hepatocellular carcinoma |
| NAFLD: Non-alcoholic fatty liver disease | ||
| Oral Cavity |  | EOLP: Erosive Oral lichen planus |
| LP: leukoplakia | ||
| NEOLP: Non-erosive oral lichen planus | ||
| OSCC: Oral squamous cell carcinoma |
| ∗log2FC in expression of this searched gene in stem-like cells from each diseased tissue sample relative to stem-like cells in normal samples in each tissue plotted against the malignancy continuum. Samples are colored based on if they are from different disease stage. |
Top |
Malignant transformation related pathway analysis |
| Find out the enriched GO biological processes and KEGG pathways involved in transition from healthy to precancer to cancer |
| Tissue | Disease Stage | Enriched GO biological Processes |
| Colorectum | AD |  |
| Colorectum | SER |  |
| Colorectum | MSS |  |
| Colorectum | MSI-H |  |
| Colorectum | FAP |  |
| ∗Top 15 enriched GO BP terms are showed in the bar plot of each disease state in each tissue. Each row represents a significant GO biological process which is colored according to the -log10(p.adjust). |
| Page: 1 2 3 4 5 6 7 8 9 |
| GO ID | Tissue | Disease Stage | Description | Gene Ratio | Bg Ratio | pvalue | p.adjust | Count |
| GO:0034470 | Colorectum | MSI-H | ncRNA processing | 48/1319 | 395/18723 | 1.54e-04 | 4.47e-03 | 48 |
| GO:0034660 | Colorectum | MSI-H | ncRNA metabolic process | 53/1319 | 485/18723 | 9.66e-04 | 1.68e-02 | 53 |
| GO:0022613111 | Esophagus | ESCC | ribonucleoprotein complex biogenesis | 365/8552 | 463/18723 | 1.74e-49 | 1.11e-45 | 365 |
| GO:0042254111 | Esophagus | ESCC | ribosome biogenesis | 252/8552 | 299/18723 | 3.27e-44 | 1.04e-40 | 252 |
| GO:003447015 | Esophagus | ESCC | ncRNA processing | 300/8552 | 395/18723 | 3.09e-35 | 3.26e-32 | 300 |
| GO:0016072110 | Esophagus | ESCC | rRNA metabolic process | 197/8552 | 236/18723 | 1.31e-33 | 1.18e-30 | 197 |
| GO:0006364110 | Esophagus | ESCC | rRNA processing | 189/8552 | 225/18723 | 4.88e-33 | 3.87e-30 | 189 |
| GO:003466012 | Esophagus | ESCC | ncRNA metabolic process | 346/8552 | 485/18723 | 4.35e-31 | 2.51e-28 | 346 |
| GO:00905013 | Esophagus | ESCC | RNA phosphodiester bond hydrolysis | 110/8552 | 152/18723 | 1.95e-11 | 6.81e-10 | 110 |
| GO:00080333 | Esophagus | ESCC | tRNA processing | 92/8552 | 127/18723 | 7.83e-10 | 1.93e-08 | 92 |
| GO:00063992 | Esophagus | ESCC | tRNA metabolic process | 122/8552 | 179/18723 | 9.03e-10 | 2.19e-08 | 122 |
| GO:00903053 | Esophagus | ESCC | nucleic acid phosphodiester bond hydrolysis | 163/8552 | 261/18723 | 3.07e-08 | 5.73e-07 | 163 |
| GO:00905023 | Esophagus | ESCC | RNA phosphodiester bond hydrolysis, endonucleolytic | 55/8552 | 82/18723 | 7.34e-05 | 5.51e-04 | 55 |
| GO:00344713 | Esophagus | ESCC | ncRNA 5'-end processing | 18/8552 | 21/18723 | 1.81e-04 | 1.16e-03 | 18 |
| GO:00009663 | Esophagus | ESCC | RNA 5'-end processing | 19/8552 | 23/18723 | 3.12e-04 | 1.85e-03 | 19 |
| GO:00991163 | Esophagus | ESCC | tRNA 5'-end processing | 14/8552 | 16/18723 | 6.78e-04 | 3.56e-03 | 14 |
| GO:00016823 | Esophagus | ESCC | tRNA 5'-leader removal | 11/8552 | 13/18723 | 4.76e-03 | 1.85e-02 | 11 |
| GO:00344701 | Liver | Cirrhotic | ncRNA processing | 158/4634 | 395/18723 | 1.09e-11 | 6.96e-10 | 158 |
| GO:00346603 | Liver | Cirrhotic | ncRNA metabolic process | 173/4634 | 485/18723 | 3.64e-08 | 1.21e-06 | 173 |
| GO:002261322 | Liver | HCC | ribonucleoprotein complex biogenesis | 355/7958 | 463/18723 | 7.76e-52 | 4.92e-48 | 355 |
| Page: 1 2 3 4 |
| Pathway ID | Tissue | Disease Stage | Description | Gene Ratio | Bg Ratio | pvalue | p.adjust | qvalue | Count |
| Page: 1 |
Top |
Cell-cell communication analysis |
| Identification of potential cell-cell interactions between two cell types and their ligand-receptor pairs for different disease states |
| Ligand | Receptor | LRpair | Pathway | Tissue | Disease Stage |
| Page: 1 |
Top |
Single-cell gene regulatory network inference analysis |
| Find out the significant the regulons (TFs) and the target genes of each regulon across cell types for different disease states |
| TF | Cell Type | Tissue | Disease Stage | Target Gene | RSS | Regulon Activity |
| ∗The dot plots of a searched regulon are shown for all cell subpopulations in each disease state of each tissue based on the regulon specific score inferred using pySCENIC and by calculating the average expression. |
| Page: 1 |
Top |
Somatic mutation of malignant transformation related genes |
| Annotation of somatic variants for genes involved in malignant transformation |
| Hugo Symbol | Variant Class | Variant Classification | dbSNP RS | HGVSc | HGVSp | HGVSp Short | SWISSPROT | BIOTYPE | SIFT | PolyPhen | Tumor Sample Barcode | Tissue | Histology | Sex | Age | Stage | Therapy Types | Drugs | Outcome |
| RPP25 | SNV | Missense_Mutation | novel | c.382N>C | p.Val128Leu | p.V128L | Q9BUL9 | protein_coding | deleterious(0.04) | probably_damaging(0.976) | TCGA-C5-A7XC-01 | Cervix | cervical & endocervical cancer | Female | <65 | I/II | Unknown | Unknown | SD |
| RPP25 | SNV | Missense_Mutation | novel | c.497C>T | p.Ala166Val | p.A166V | Q9BUL9 | protein_coding | tolerated(0.16) | benign(0) | TCGA-VS-A9U7-01 | Cervix | cervical & endocervical cancer | Female | <65 | I/II | Chemotherapy | cisplatin | CR |
| RPP25 | deletion | Frame_Shift_Del | c.329delN | p.Pro110ArgfsTer64 | p.P110Rfs*64 | Q9BUL9 | protein_coding | TCGA-G4-6588-01 | Colorectum | colon adenocarcinoma | Female | <65 | I/II | Unknown | Unknown | SD | |||
| RPP25 | insertion | Frame_Shift_Ins | novel | c.124_131dupGAAGGCAG | p.Ser44ArgfsTer9 | p.S44Rfs*9 | Q9BUL9 | protein_coding | TCGA-AH-6897-01 | Colorectum | rectum adenocarcinoma | Male | <65 | I/II | Unknown | Unknown | SD | ||
| RPP25 | SNV | Missense_Mutation | novel | c.548C>T | p.Ala183Val | p.A183V | Q9BUL9 | protein_coding | deleterious(0.04) | benign(0.072) | TCGA-AX-A1CE-01 | Endometrium | uterine corpus endometrioid carcinoma | Female | <65 | I/II | Unspecific | Paclitaxel | SD |
| RPP25 | SNV | Missense_Mutation | novel | c.548C>T | p.Ala183Val | p.A183V | Q9BUL9 | protein_coding | deleterious(0.04) | benign(0.072) | TCGA-AX-A2HC-01 | Endometrium | uterine corpus endometrioid carcinoma | Female | <65 | III/IV | Chemotherapy | paclitaxel | PD |
| RPP25 | SNV | Missense_Mutation | novel | c.496N>A | p.Ala166Thr | p.A166T | Q9BUL9 | protein_coding | tolerated(0.62) | benign(0) | TCGA-EY-A1GU-01 | Endometrium | uterine corpus endometrioid carcinoma | Female | >=65 | I/II | Unknown | Unknown | SD |
| RPP25 | SNV | Missense_Mutation | c.526C>A | p.Pro176Thr | p.P176T | Q9BUL9 | protein_coding | tolerated(0.08) | benign(0) | TCGA-CD-A4MG-01 | Stomach | stomach adenocarcinoma | Male | >=65 | I/II | Unknown | Unknown | PD |
| Page: 1 |
Top |
Related drugs of malignant transformation related genes |
| Identification of chemicals and drugs interact with genes involved in malignant transfromation |
| (DGIdb 4.0) |
| Entrez ID | Symbol | Category | Interaction Types | Drug Claim Name | Drug Name | PMIDs |
| Page: 1 |

Copyright 2023-Present -The University of Texas Health Science Center at Houston |