
|
|||||
|
 | |
| |
| |
| |
| |
| |
|
Gene: RPP14 |
Gene summary for RPP14 |
| Gene information | Species | Human | Gene symbol | RPP14 | Gene ID | 11102 |
| Gene name | ribonuclease P/MRP subunit p14 | |
| Gene Alias | P14 | |
| Cytomap | 3p14.3 | |
| Gene Type | protein-coding | GO ID | GO:0000966 | UniProtAcc | O95059 |
Top |
Malignant transformation analysis |
| Identification of the aberrant gene expression in precancerous and cancerous lesions by comparing the gene expression of stem-like cells in diseased tissues with normal stem cells |
| Entrez ID | Symbol | Replicates | Species | Organ | Tissue | Adj P-value | Log2FC | Malignancy |
| 11102 | RPP14 | HCC1_Meng | Human | Liver | HCC | 1.81e-43 | 4.80e-02 | 0.0246 |
| 11102 | RPP14 | HCC1 | Human | Liver | HCC | 5.24e-23 | 3.62e+00 | 0.5336 |
| 11102 | RPP14 | HCC2 | Human | Liver | HCC | 4.55e-44 | 3.87e+00 | 0.5341 |
| 11102 | RPP14 | HCC5 | Human | Liver | HCC | 1.07e-46 | 2.56e+00 | 0.4932 |
| 11102 | RPP14 | Pt13.b | Human | Liver | HCC | 1.91e-03 | 8.58e-02 | 0.0251 |
| 11102 | RPP14 | Pt14.b | Human | Liver | HCC | 3.71e-02 | 2.26e-01 | 0.018 |
| 11102 | RPP14 | S014 | Human | Liver | HCC | 2.83e-09 | 3.54e-01 | 0.2254 |
| 11102 | RPP14 | S015 | Human | Liver | HCC | 4.79e-11 | 4.64e-01 | 0.2375 |
| 11102 | RPP14 | S016 | Human | Liver | HCC | 2.35e-16 | 5.43e-01 | 0.2243 |
| 11102 | RPP14 | S027 | Human | Liver | HCC | 1.09e-03 | 5.09e-01 | 0.2446 |
| 11102 | RPP14 | S028 | Human | Liver | HCC | 1.08e-23 | 9.69e-01 | 0.2503 |
| 11102 | RPP14 | S029 | Human | Liver | HCC | 6.60e-17 | 7.28e-01 | 0.2581 |
| 11102 | RPP14 | P1_cSCC | Human | Skin | cSCC | 1.41e-17 | 6.25e-01 | 0.0292 |
| 11102 | RPP14 | P2_cSCC | Human | Skin | cSCC | 1.00e-11 | 4.06e-01 | -0.024 |
| 11102 | RPP14 | P4_cSCC | Human | Skin | cSCC | 8.75e-17 | 3.66e-01 | -0.00290000000000005 |
| 11102 | RPP14 | P10_cSCC | Human | Skin | cSCC | 2.08e-11 | 4.24e-01 | 0.1017 |
| Page: 1 |
| Tissue | Expression Dynamics | Abbreviation |
| Liver | 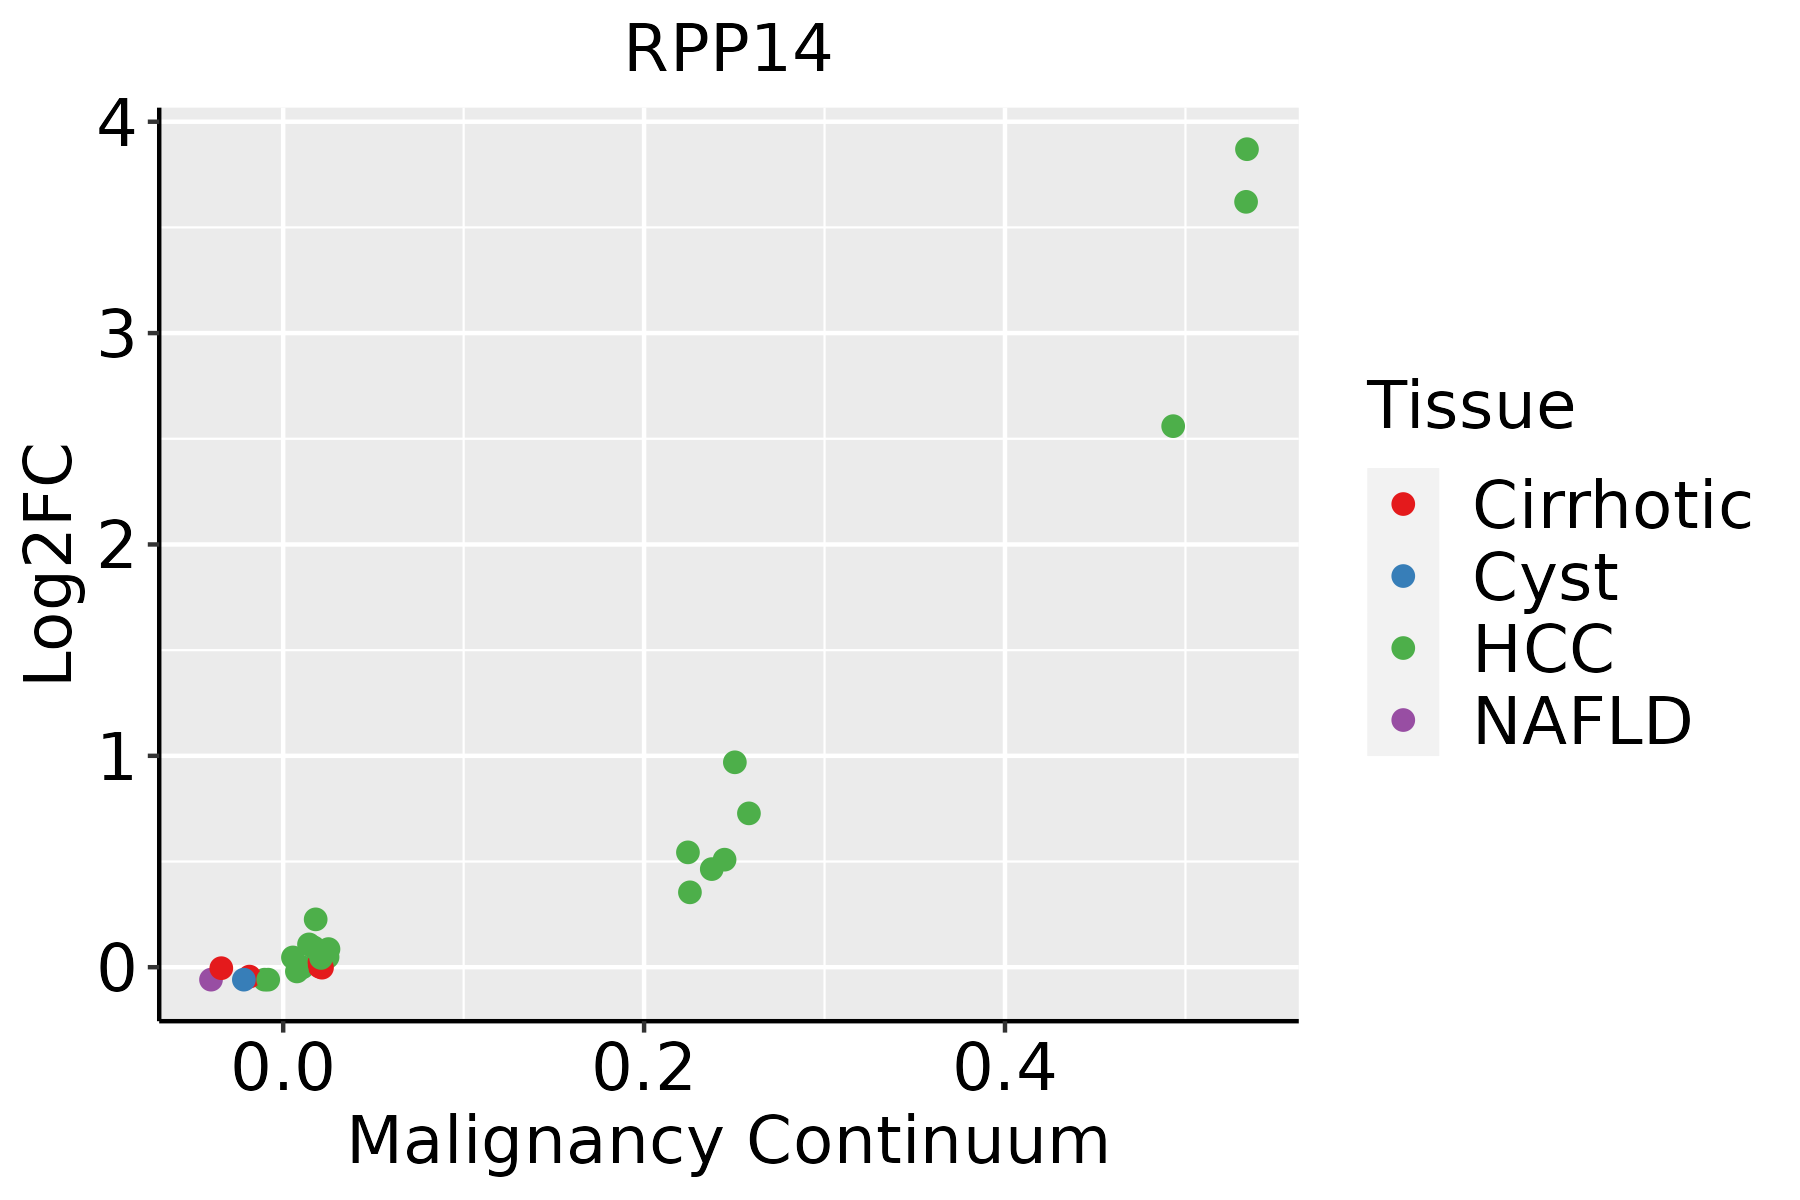 | HCC: Hepatocellular carcinoma |
| NAFLD: Non-alcoholic fatty liver disease | ||
| Skin |  | AK: Actinic keratosis |
| cSCC: Cutaneous squamous cell carcinoma | ||
| SCCIS:squamous cell carcinoma in situ |
| ∗log2FC in expression of this searched gene in stem-like cells from each diseased tissue sample relative to stem-like cells in normal samples in each tissue plotted against the malignancy continuum. Samples are colored based on if they are from different disease stage. |
Top |
Malignant transformation related pathway analysis |
| Find out the enriched GO biological processes and KEGG pathways involved in transition from healthy to precancer to cancer |
| Tissue | Disease Stage | Enriched GO biological Processes |
| Colorectum | AD |  |
| Colorectum | SER |  |
| Colorectum | MSS |  |
| Colorectum | MSI-H |  |
| Colorectum | FAP |  |
| ∗Top 15 enriched GO BP terms are showed in the bar plot of each disease state in each tissue. Each row represents a significant GO biological process which is colored according to the -log10(p.adjust). |
| Page: 1 2 3 4 5 6 7 8 9 |
| GO ID | Tissue | Disease Stage | Description | Gene Ratio | Bg Ratio | pvalue | p.adjust | Count |
| GO:00344702 | Liver | HCC | ncRNA processing | 293/7958 | 395/18723 | 4.26e-38 | 6.76e-35 | 293 |
| GO:00346601 | Liver | HCC | ncRNA metabolic process | 332/7958 | 485/18723 | 1.48e-31 | 7.80e-29 | 332 |
| GO:00905011 | Liver | HCC | RNA phosphodiester bond hydrolysis | 101/7958 | 152/18723 | 1.99e-09 | 5.63e-08 | 101 |
| GO:0008033 | Liver | HCC | tRNA processing | 87/7958 | 127/18723 | 2.66e-09 | 7.23e-08 | 87 |
| GO:0090305 | Liver | HCC | nucleic acid phosphodiester bond hydrolysis | 152/7958 | 261/18723 | 1.90e-07 | 3.46e-06 | 152 |
| GO:0006399 | Liver | HCC | tRNA metabolic process | 108/7958 | 179/18723 | 1.07e-06 | 1.59e-05 | 108 |
| GO:0000966 | Liver | HCC | RNA 5'-end processing | 20/7958 | 23/18723 | 1.37e-05 | 1.51e-04 | 20 |
| GO:0034471 | Liver | HCC | ncRNA 5'-end processing | 18/7958 | 21/18723 | 5.78e-05 | 5.34e-04 | 18 |
| GO:0090502 | Liver | HCC | RNA phosphodiester bond hydrolysis, endonucleolytic | 52/7958 | 82/18723 | 1.06e-04 | 9.08e-04 | 52 |
| GO:0099116 | Liver | HCC | tRNA 5'-end processing | 14/7958 | 16/18723 | 2.73e-04 | 1.98e-03 | 14 |
| GO:0001682 | Liver | HCC | tRNA 5'-leader removal | 11/7958 | 13/18723 | 2.38e-03 | 1.16e-02 | 11 |
| GO:003447017 | Skin | cSCC | ncRNA processing | 215/4864 | 395/18723 | 6.83e-34 | 4.28e-31 | 215 |
| GO:003466013 | Skin | cSCC | ncRNA metabolic process | 234/4864 | 485/18723 | 1.37e-26 | 4.77e-24 | 234 |
| GO:00905014 | Skin | cSCC | RNA phosphodiester bond hydrolysis | 71/4864 | 152/18723 | 2.72e-08 | 7.41e-07 | 71 |
| GO:00903054 | Skin | cSCC | nucleic acid phosphodiester bond hydrolysis | 97/4864 | 261/18723 | 4.08e-05 | 4.34e-04 | 97 |
| GO:00991164 | Skin | cSCC | tRNA 5'-end processing | 11/4864 | 16/18723 | 4.08e-04 | 3.18e-03 | 11 |
| GO:00009664 | Skin | cSCC | RNA 5'-end processing | 14/4864 | 23/18723 | 4.32e-04 | 3.34e-03 | 14 |
| GO:00344714 | Skin | cSCC | ncRNA 5'-end processing | 13/4864 | 21/18723 | 5.53e-04 | 4.05e-03 | 13 |
| GO:00080334 | Skin | cSCC | tRNA processing | 49/4864 | 127/18723 | 1.20e-03 | 7.81e-03 | 49 |
| GO:00016824 | Skin | cSCC | tRNA 5'-leader removal | 9/4864 | 13/18723 | 1.33e-03 | 8.50e-03 | 9 |
| Page: 1 2 |
| Pathway ID | Tissue | Disease Stage | Description | Gene Ratio | Bg Ratio | pvalue | p.adjust | qvalue | Count |
| Page: 1 |
Top |
Cell-cell communication analysis |
| Identification of potential cell-cell interactions between two cell types and their ligand-receptor pairs for different disease states |
| Ligand | Receptor | LRpair | Pathway | Tissue | Disease Stage |
| Page: 1 |
Top |
Single-cell gene regulatory network inference analysis |
| Find out the significant the regulons (TFs) and the target genes of each regulon across cell types for different disease states |
| TF | Cell Type | Tissue | Disease Stage | Target Gene | RSS | Regulon Activity |
| ∗The dot plots of a searched regulon are shown for all cell subpopulations in each disease state of each tissue based on the regulon specific score inferred using pySCENIC and by calculating the average expression. |
| Page: 1 |
Top |
Somatic mutation of malignant transformation related genes |
| Annotation of somatic variants for genes involved in malignant transformation |
| Hugo Symbol | Variant Class | Variant Classification | dbSNP RS | HGVSc | HGVSp | HGVSp Short | SWISSPROT | BIOTYPE | SIFT | PolyPhen | Tumor Sample Barcode | Tissue | Histology | Sex | Age | Stage | Therapy Types | Drugs | Outcome |
| RPP14 | SNV | Missense_Mutation | rs773275466 | c.137C>T | p.Ser46Leu | p.S46L | O95059 | protein_coding | tolerated(0.32) | benign(0.007) | TCGA-A8-A09G-01 | Breast | breast invasive carcinoma | Female | >=65 | III/IV | Unknown | Unknown | SD |
| RPP14 | SNV | Missense_Mutation | c.331N>A | p.Leu111Ile | p.L111I | O95059 | protein_coding | deleterious(0.01) | probably_damaging(0.998) | TCGA-AA-3977-01 | Colorectum | colon adenocarcinoma | Male | >=65 | I/II | Unknown | Unknown | SD | |
| RPP14 | SNV | Missense_Mutation | c.331N>A | p.Leu111Ile | p.L111I | O95059 | protein_coding | deleterious(0.01) | probably_damaging(0.998) | TCGA-AG-A002-01 | Colorectum | rectum adenocarcinoma | Male | <65 | I/II | Unknown | Unknown | SD | |
| RPP14 | SNV | Missense_Mutation | novel | c.155N>C | p.Phe52Ser | p.F52S | O95059 | protein_coding | deleterious(0.01) | possibly_damaging(0.598) | TCGA-A5-A1OF-01 | Endometrium | uterine corpus endometrioid carcinoma | Female | <65 | I/II | Unknown | Unknown | SD |
| RPP14 | SNV | Missense_Mutation | novel | c.173N>T | p.Ala58Val | p.A58V | O95059 | protein_coding | tolerated(0.05) | probably_damaging(0.947) | TCGA-AP-A0LM-01 | Endometrium | uterine corpus endometrioid carcinoma | Female | <65 | III/IV | Chemotherapy | cisplatin | SD |
| RPP14 | SNV | Missense_Mutation | c.29G>T | p.Arg10Ile | p.R10I | O95059 | protein_coding | deleterious(0) | probably_damaging(0.998) | TCGA-B5-A0JY-01 | Endometrium | uterine corpus endometrioid carcinoma | Female | <65 | III/IV | Chemotherapy | doxorubicin | SD | |
| RPP14 | SNV | Missense_Mutation | novel | c.136N>C | p.Ser46Pro | p.S46P | O95059 | protein_coding | tolerated(0.12) | possibly_damaging(0.691) | TCGA-B5-A3FA-01 | Endometrium | uterine corpus endometrioid carcinoma | Female | >=65 | I/II | Unknown | Unknown | SD |
| RPP14 | insertion | In_Frame_Ins | novel | c.246_247insCTCTTCATA | p.Leu82_Val83insLeuPheIle | p.L82_V83insLFI | O95059 | protein_coding | TCGA-AX-A06B-01 | Endometrium | uterine corpus endometrioid carcinoma | Female | >=65 | I/II | Unknown | Unknown | SD | ||
| RPP14 | insertion | In_Frame_Ins | novel | c.337_338insTCACTAATTGTCCAACATGTTTTCCTACTA | p.Ala113delinsValThrAsnCysProThrCysPheProThrThr | p.A113delinsVTNCPTCFPTT | O95059 | protein_coding | TCGA-B5-A11I-01 | Endometrium | uterine corpus endometrioid carcinoma | Female | >=65 | III/IV | Chemotherapy | paclitaxel | PD | ||
| RPP14 | SNV | Missense_Mutation | c.30N>C | p.Arg10Ser | p.R10S | O95059 | protein_coding | deleterious(0) | probably_damaging(0.997) | TCGA-BR-8680-01 | Stomach | stomach adenocarcinoma | Male | <65 | III/IV | Chemotherapy | oxaliplatin | CR |
| Page: 1 |
Top |
Related drugs of malignant transformation related genes |
| Identification of chemicals and drugs interact with genes involved in malignant transfromation |
| (DGIdb 4.0) |
| Entrez ID | Symbol | Category | Interaction Types | Drug Claim Name | Drug Name | PMIDs |
| Page: 1 |

Copyright 2023-Present -The University of Texas Health Science Center at Houston |