
|
|||||
|
 | |
| |
| |
| |
| |
| |
|
Gene: RPN2 |
Gene summary for RPN2 |
| Gene information | Species | Human | Gene symbol | RPN2 | Gene ID | 6185 |
| Gene name | ribophorin II | |
| Gene Alias | RIBIIR | |
| Cytomap | 20q11.23 | |
| Gene Type | protein-coding | GO ID | GO:0006464 | UniProtAcc | P04844 |
Top |
Malignant transformation analysis |
| Identification of the aberrant gene expression in precancerous and cancerous lesions by comparing the gene expression of stem-like cells in diseased tissues with normal stem cells |
| Entrez ID | Symbol | Replicates | Species | Organ | Tissue | Adj P-value | Log2FC | Malignancy |
| 6185 | RPN2 | HTA11_3410_2000001011 | Human | Colorectum | AD | 1.50e-03 | -7.01e-02 | 0.0155 |
| 6185 | RPN2 | HTA11_1938_2000001011 | Human | Colorectum | AD | 2.65e-02 | 3.03e-01 | -0.0811 |
| 6185 | RPN2 | HTA11_347_2000001011 | Human | Colorectum | AD | 4.46e-09 | 3.87e-01 | -0.1954 |
| 6185 | RPN2 | HTA11_696_2000001011 | Human | Colorectum | AD | 3.79e-03 | 3.70e-01 | -0.1464 |
| 6185 | RPN2 | HTA11_1391_2000001011 | Human | Colorectum | AD | 2.81e-07 | 6.32e-01 | -0.059 |
| 6185 | RPN2 | HTA11_99999970781_79442 | Human | Colorectum | MSS | 2.92e-07 | 4.86e-01 | 0.294 |
| 6185 | RPN2 | HTA11_99999965062_69753 | Human | Colorectum | MSI-H | 8.90e-04 | 1.21e+00 | 0.3487 |
| 6185 | RPN2 | HTA11_99999965104_69814 | Human | Colorectum | MSS | 2.27e-14 | 9.98e-01 | 0.281 |
| 6185 | RPN2 | HTA11_99999971662_82457 | Human | Colorectum | MSS | 7.67e-33 | 1.38e+00 | 0.3859 |
| 6185 | RPN2 | HTA11_99999973899_84307 | Human | Colorectum | MSS | 4.81e-02 | 5.87e-01 | 0.2585 |
| 6185 | RPN2 | HTA11_99999974143_84620 | Human | Colorectum | MSS | 1.62e-18 | 7.68e-01 | 0.3005 |
| 6185 | RPN2 | A015-C-203 | Human | Colorectum | FAP | 4.89e-10 | -1.37e-01 | -0.1294 |
| 6185 | RPN2 | A001-C-108 | Human | Colorectum | FAP | 8.26e-05 | -9.29e-02 | -0.0272 |
| 6185 | RPN2 | A002-C-205 | Human | Colorectum | FAP | 2.40e-05 | 4.04e-02 | -0.1236 |
| 6185 | RPN2 | A015-C-006 | Human | Colorectum | FAP | 1.08e-03 | -1.91e-01 | -0.0994 |
| 6185 | RPN2 | A015-C-106 | Human | Colorectum | FAP | 1.03e-03 | -2.07e-01 | -0.0511 |
| 6185 | RPN2 | A002-C-114 | Human | Colorectum | FAP | 2.14e-03 | -5.73e-02 | -0.1561 |
| 6185 | RPN2 | A015-C-104 | Human | Colorectum | FAP | 3.62e-11 | 2.64e-03 | -0.1899 |
| 6185 | RPN2 | A001-C-014 | Human | Colorectum | FAP | 2.84e-03 | -6.22e-02 | 0.0135 |
| 6185 | RPN2 | A002-C-016 | Human | Colorectum | FAP | 4.00e-06 | -4.27e-02 | 0.0521 |
| Page: 1 2 3 4 5 6 7 8 9 10 |
| Tissue | Expression Dynamics | Abbreviation |
| Colorectum (GSE201348) |  | FAP: Familial adenomatous polyposis |
| CRC: Colorectal cancer | ||
| Colorectum (HTA11) |  | AD: Adenomas |
| SER: Sessile serrated lesions | ||
| MSI-H: Microsatellite-high colorectal cancer | ||
| MSS: Microsatellite stable colorectal cancer | ||
| Endometrium | 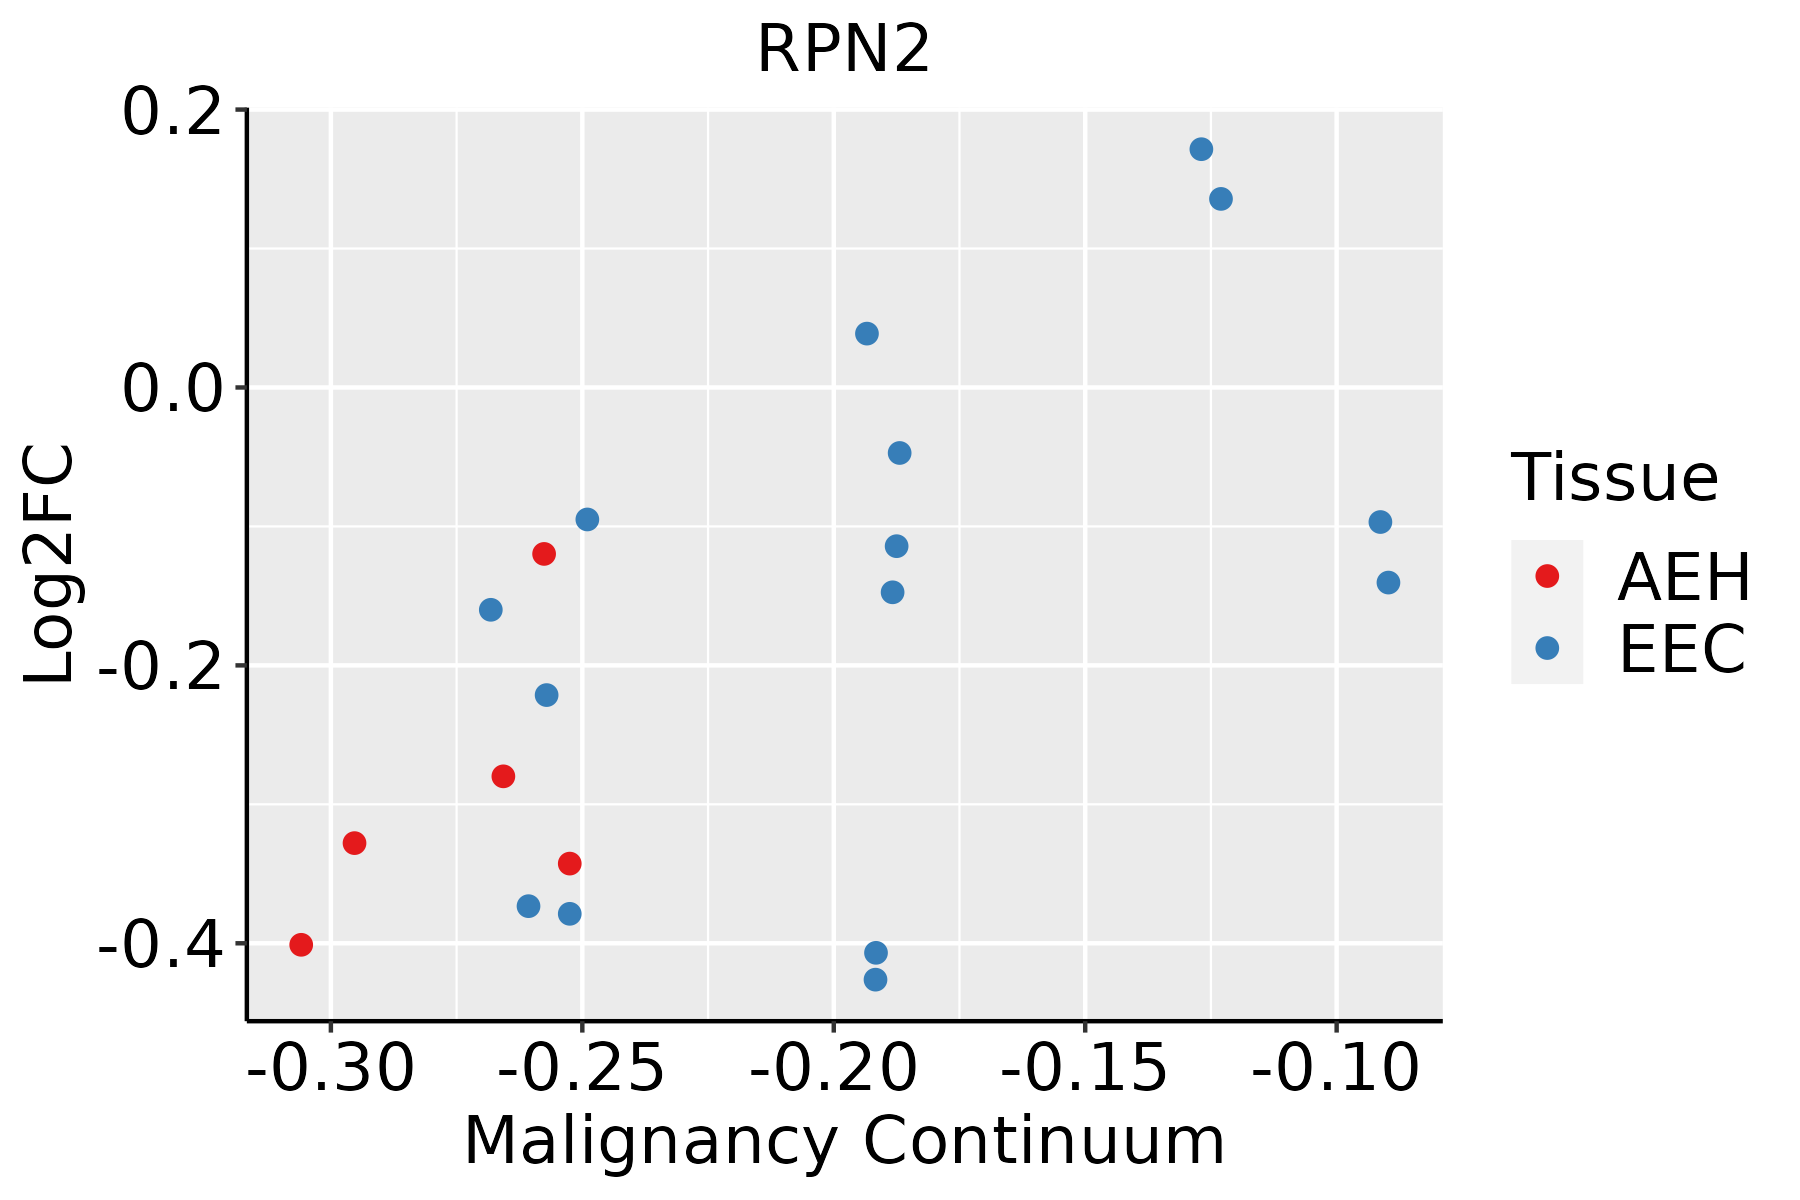 | AEH: Atypical endometrial hyperplasia |
| EEC: Endometrioid Cancer | ||
| Esophagus | 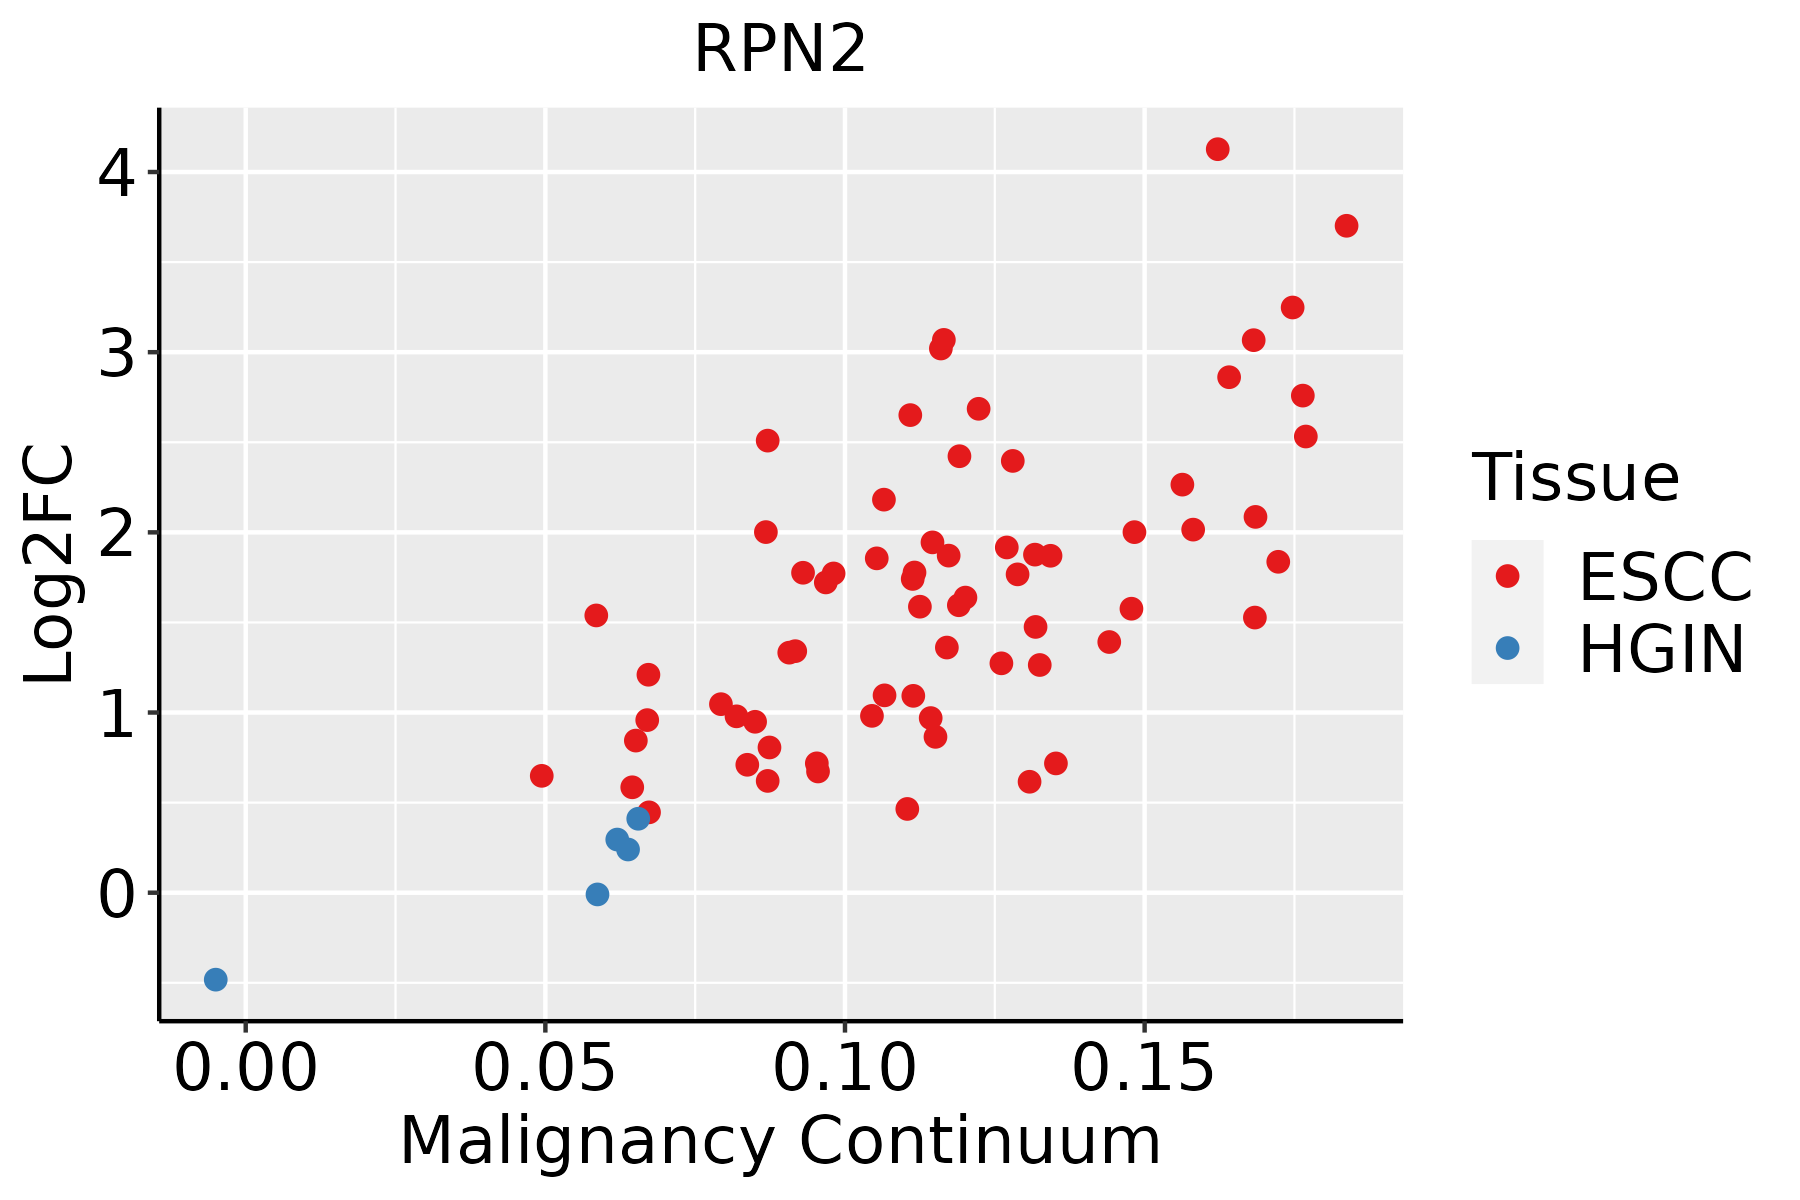 | ESCC: Esophageal squamous cell carcinoma |
| HGIN: High-grade intraepithelial neoplasias | ||
| LGIN: Low-grade intraepithelial neoplasias | ||
| Liver | 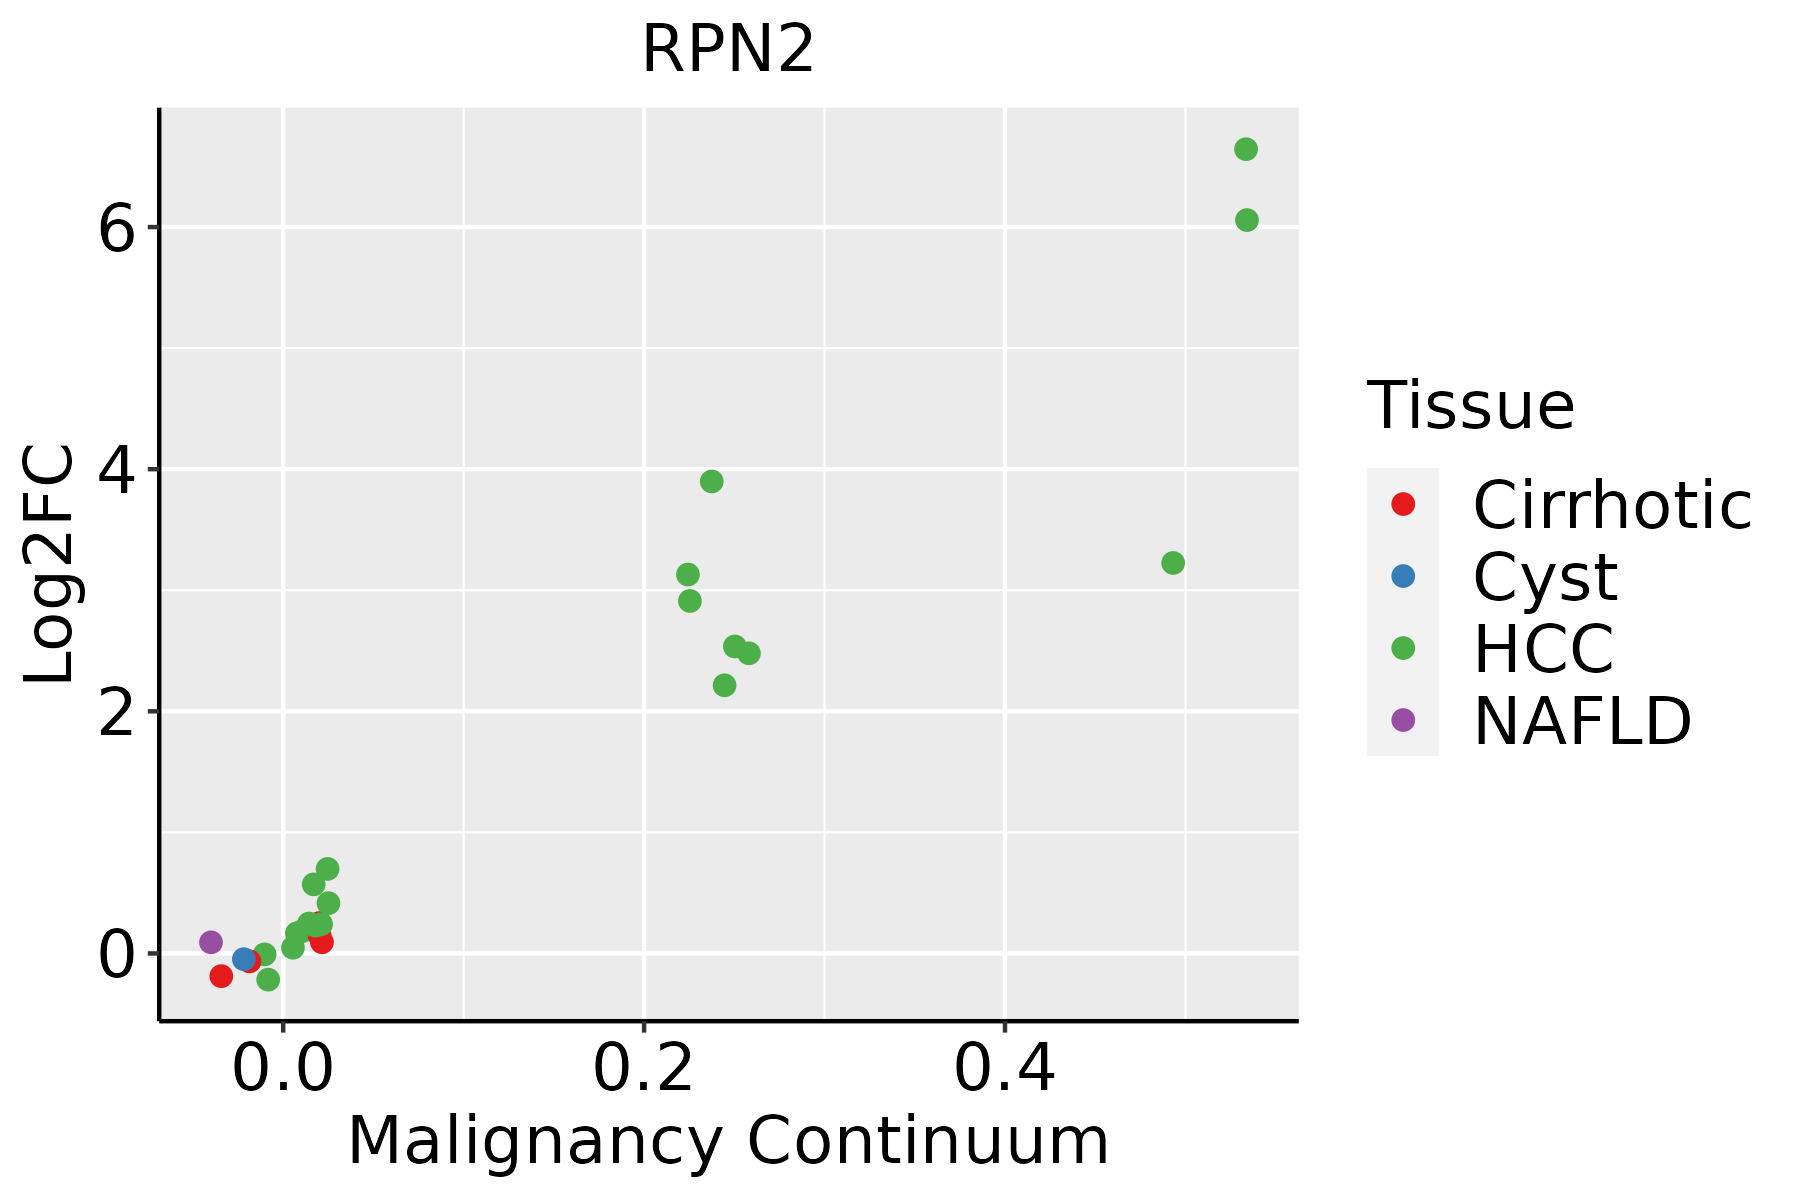 | HCC: Hepatocellular carcinoma |
| NAFLD: Non-alcoholic fatty liver disease | ||
| Oral Cavity | 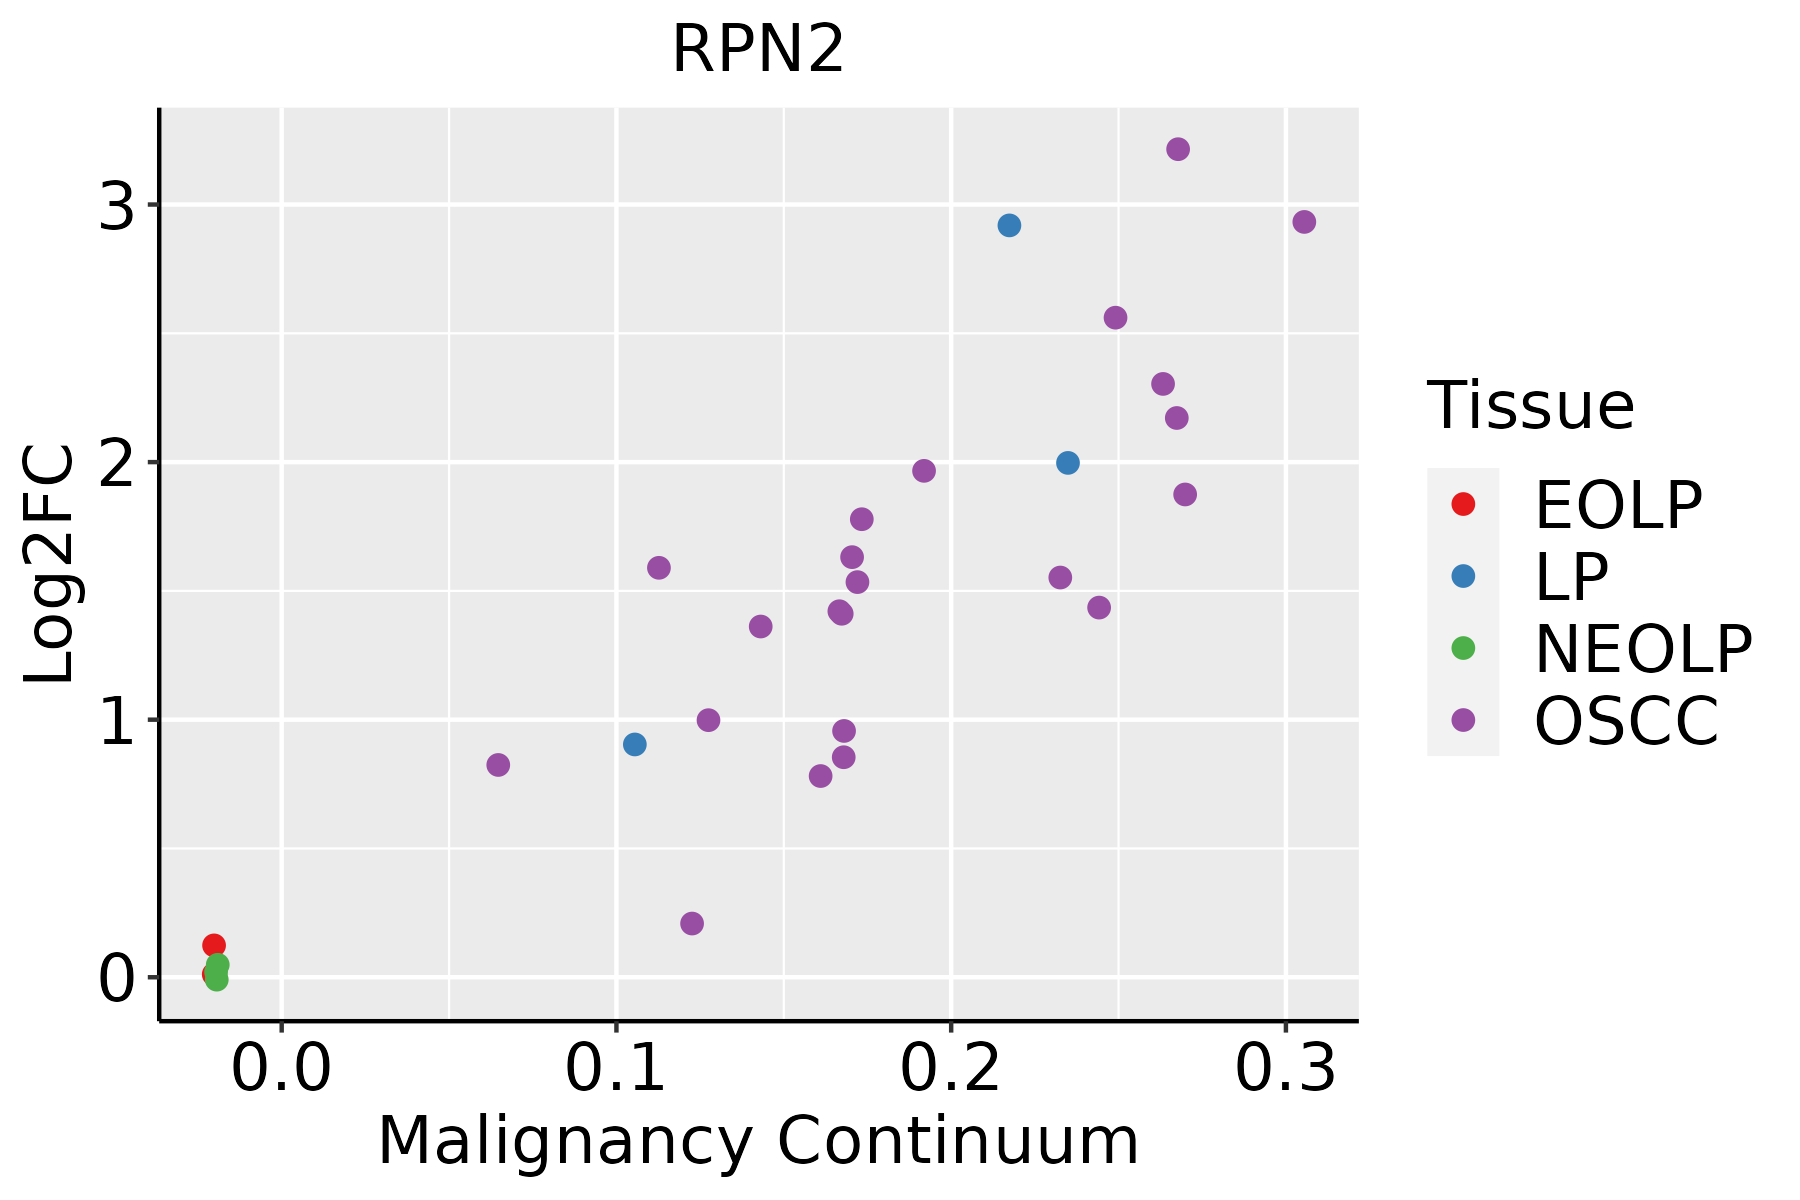 | EOLP: Erosive Oral lichen planus |
| LP: leukoplakia | ||
| NEOLP: Non-erosive oral lichen planus | ||
| OSCC: Oral squamous cell carcinoma | ||
| Prostate | 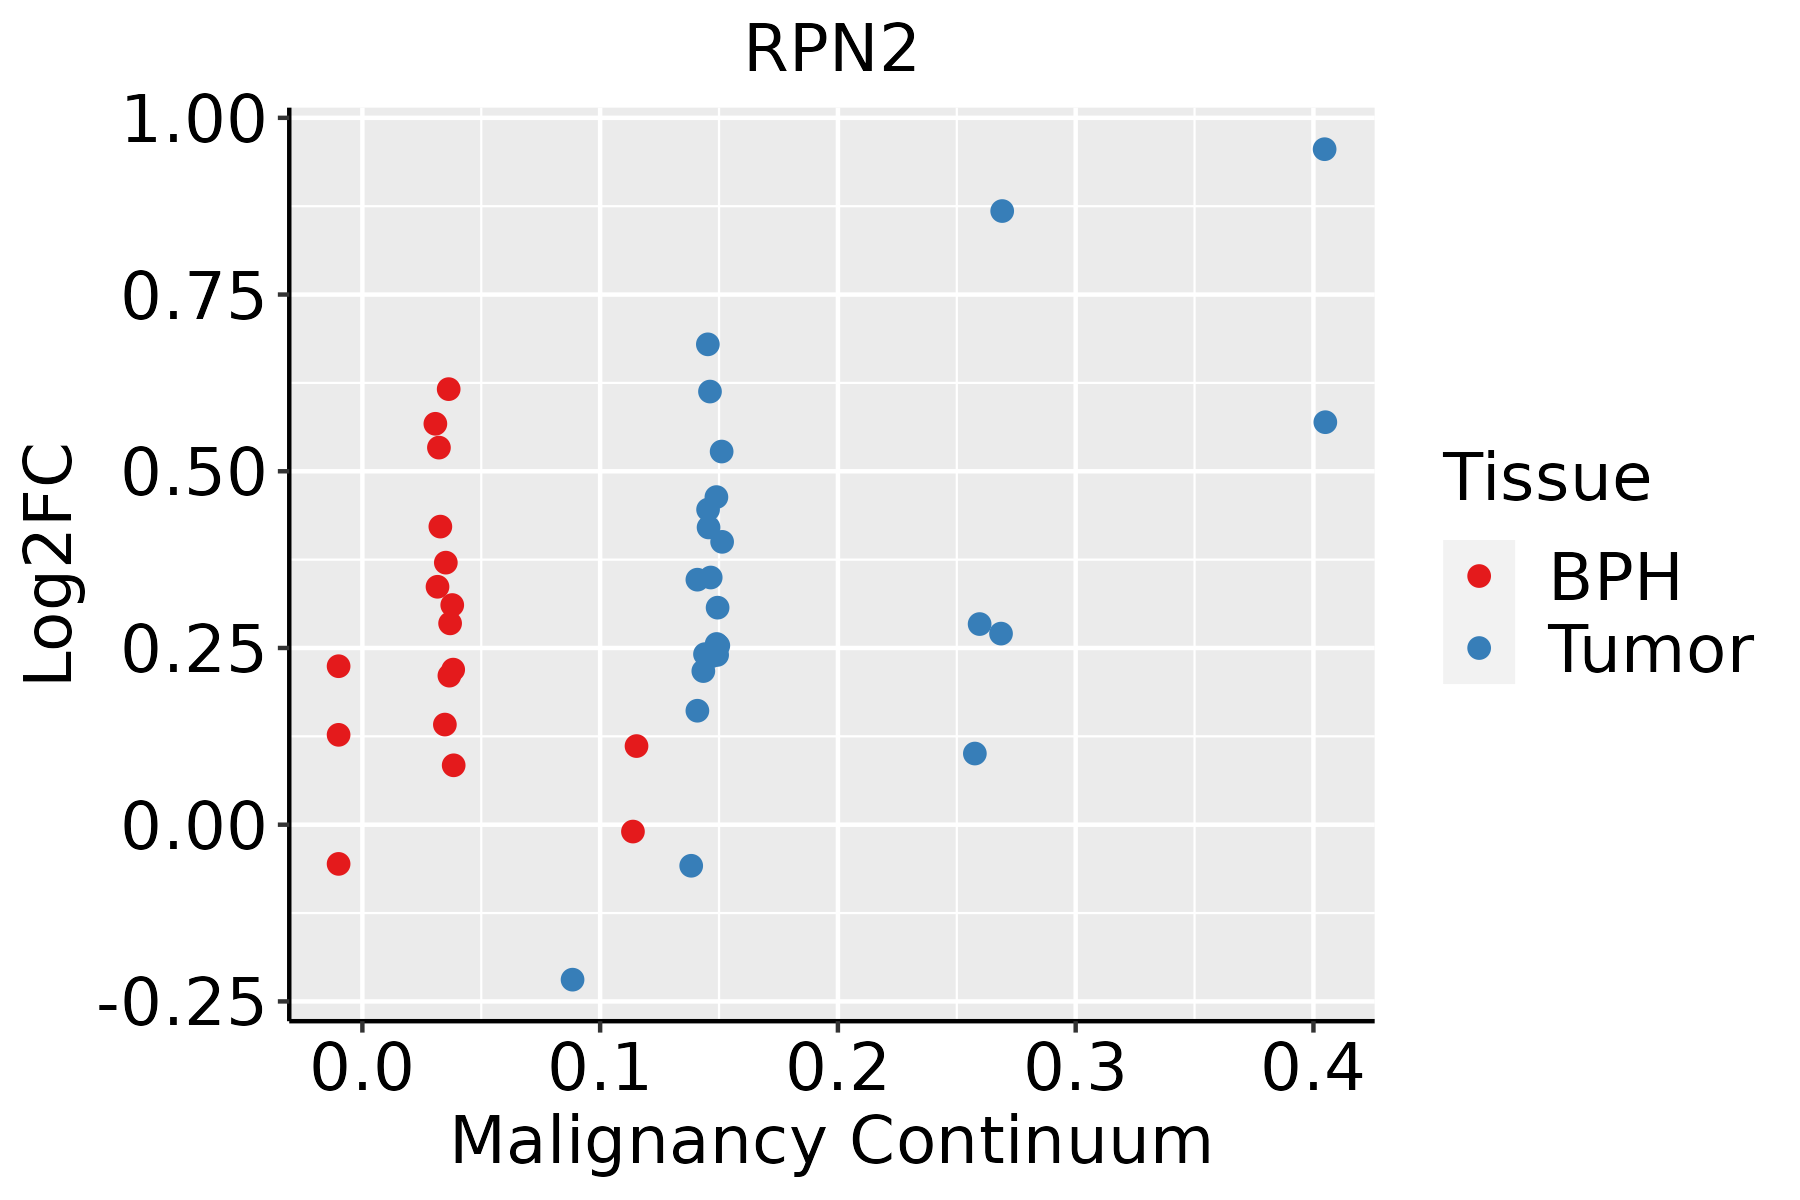 | BPH: Benign Prostatic Hyperplasia |
| Skin | 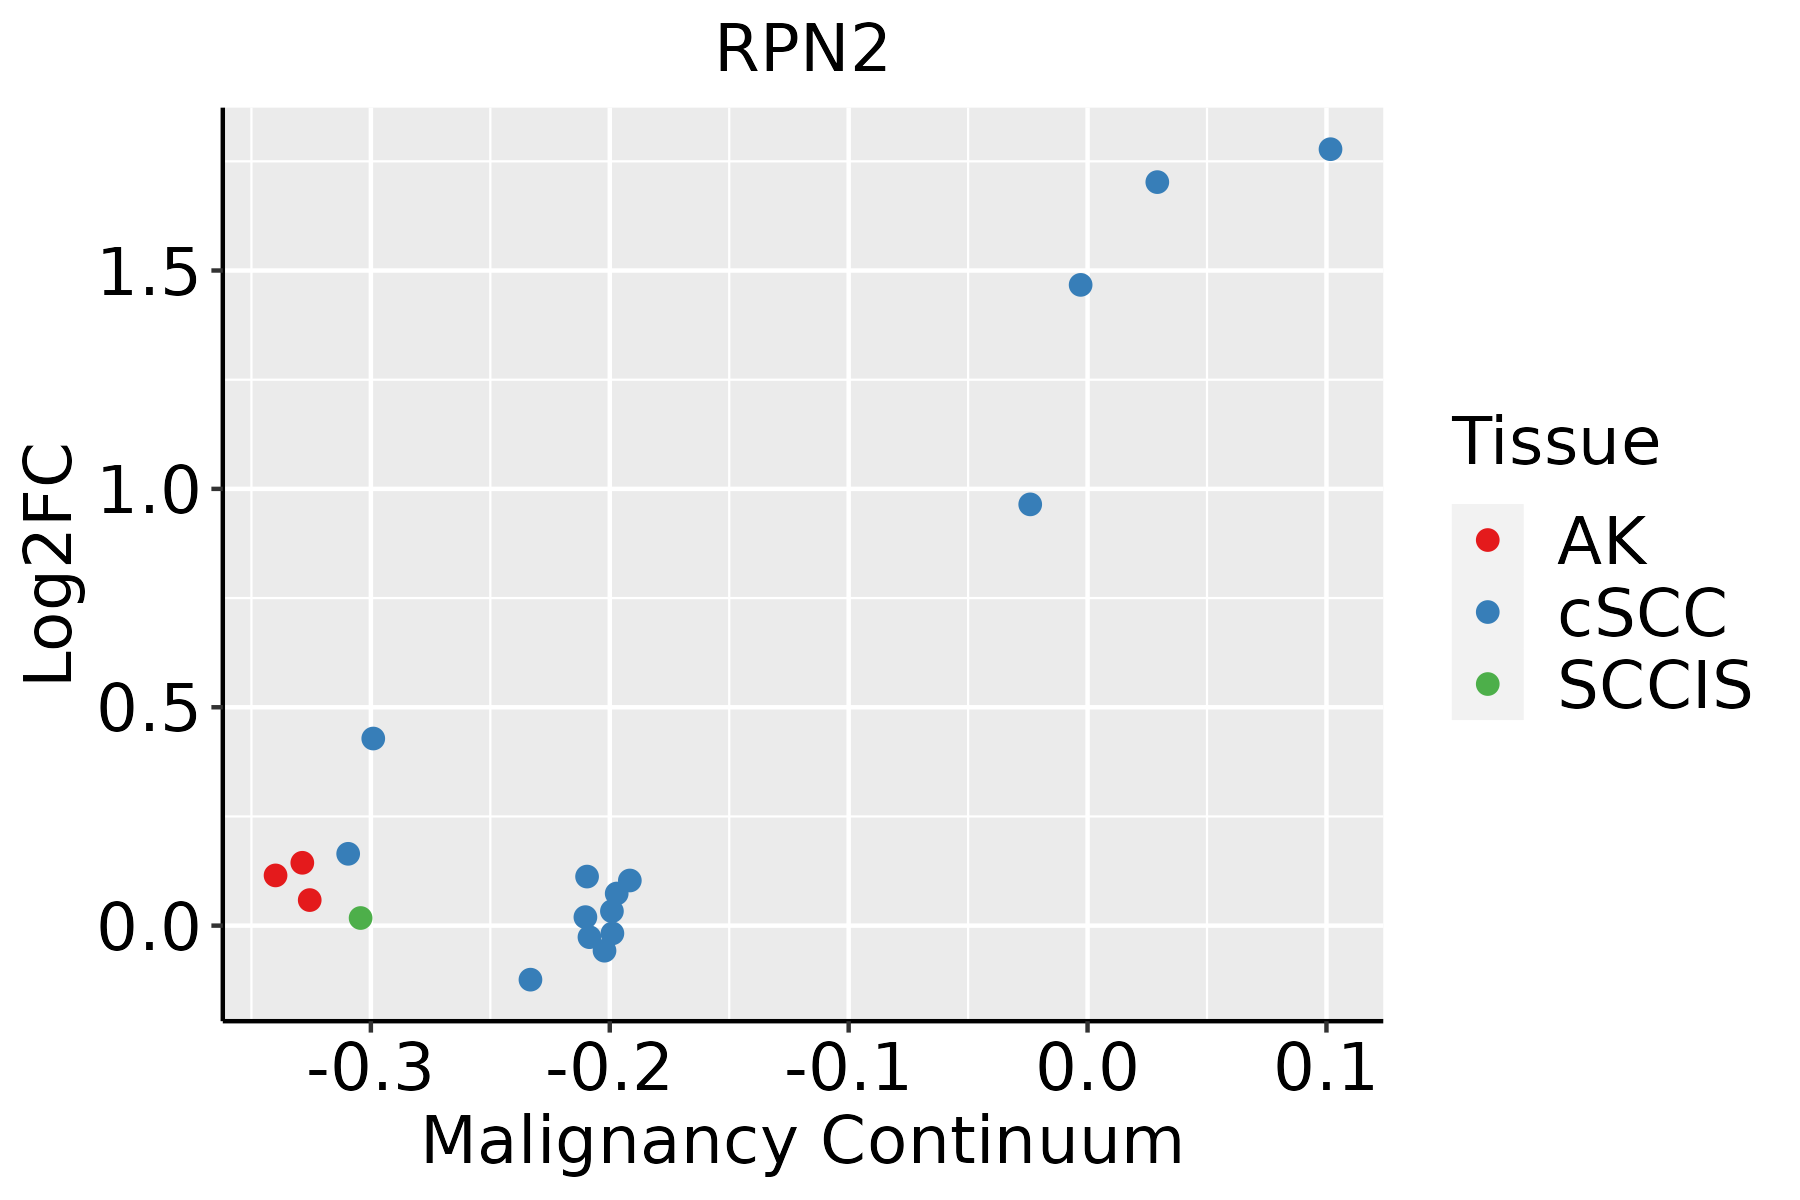 | AK: Actinic keratosis |
| cSCC: Cutaneous squamous cell carcinoma | ||
| SCCIS:squamous cell carcinoma in situ | ||
| Thyroid | 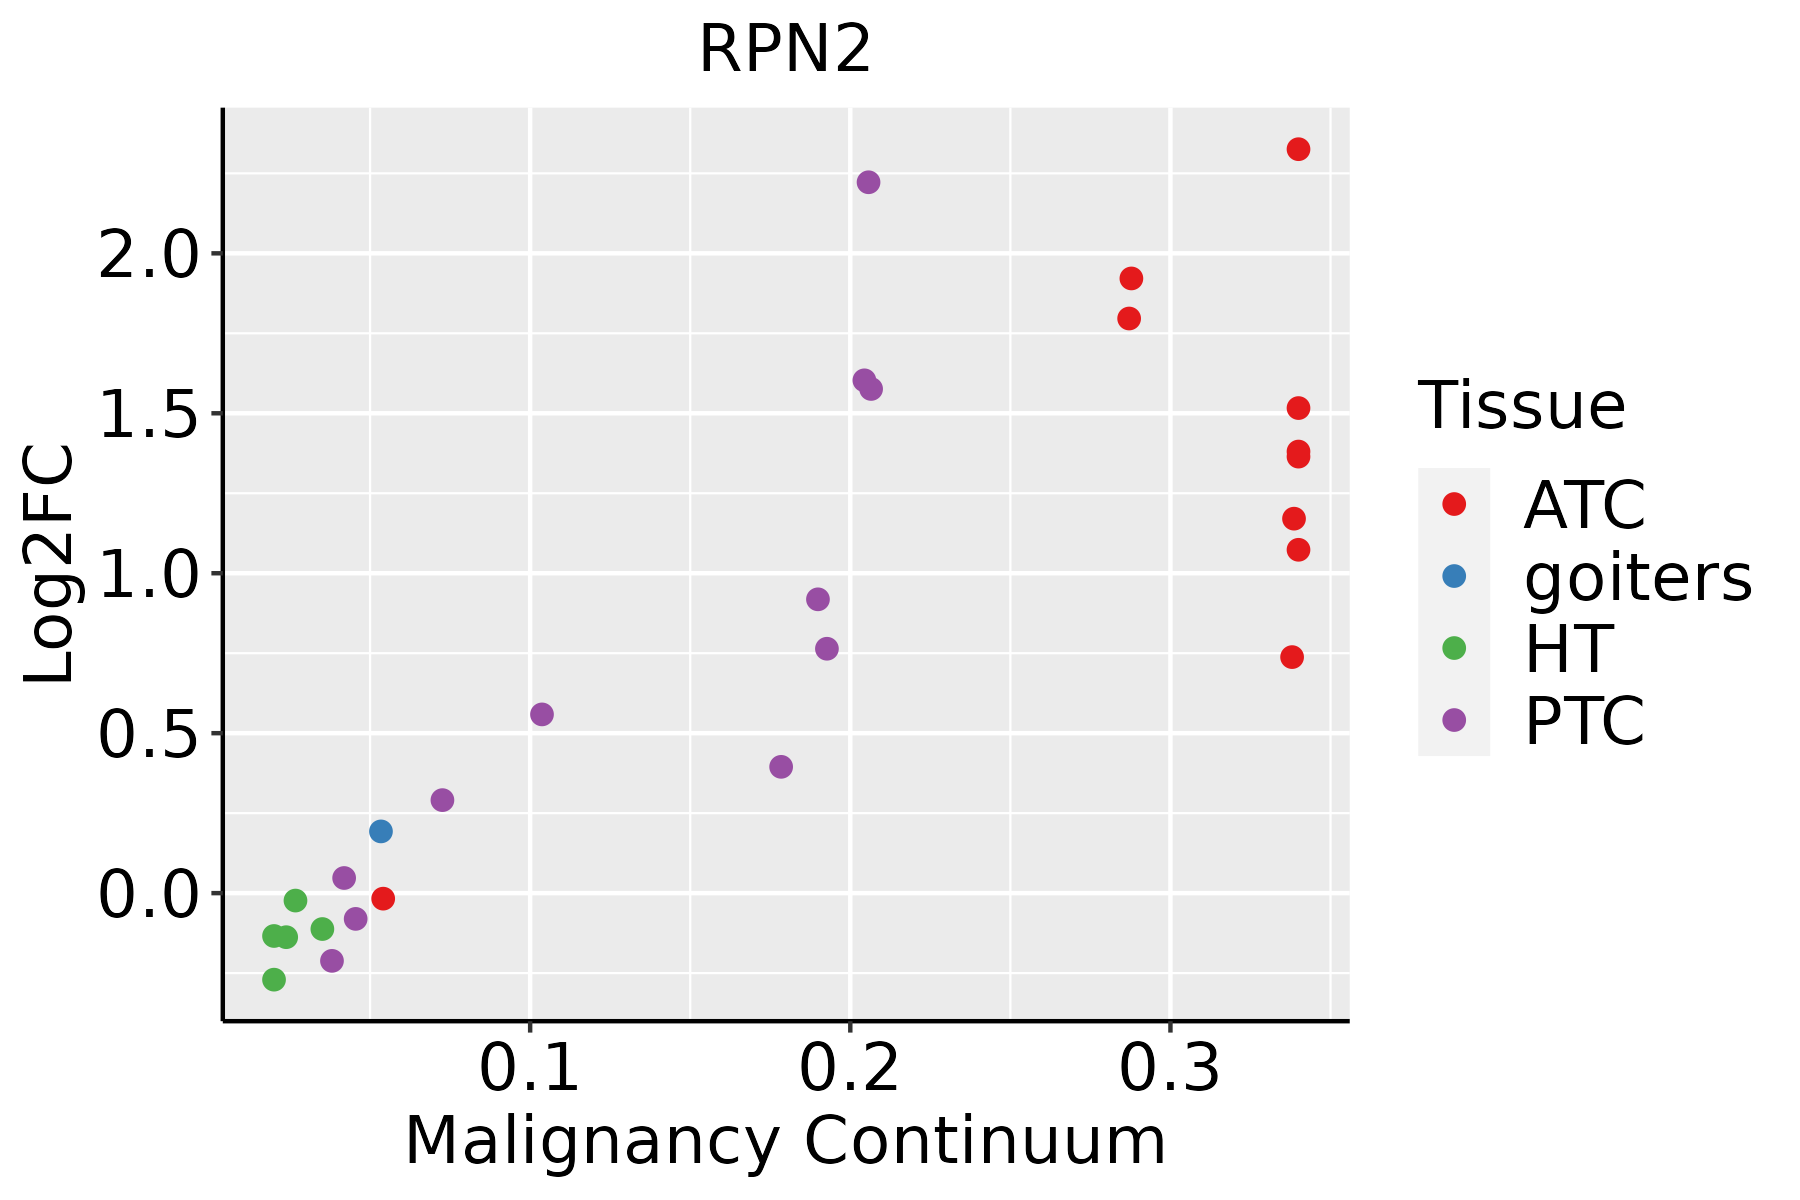 | ATC: Anaplastic thyroid cancer |
| HT: Hashimoto's thyroiditis | ||
| PTC: Papillary thyroid cancer |
| ∗log2FC in expression of this searched gene in stem-like cells from each diseased tissue sample relative to stem-like cells in normal samples in each tissue plotted against the malignancy continuum. Samples are colored based on if they are from different disease stage. |
Top |
Malignant transformation related pathway analysis |
| Find out the enriched GO biological processes and KEGG pathways involved in transition from healthy to precancer to cancer |
| Tissue | Disease Stage | Enriched GO biological Processes |
| Colorectum | AD |  |
| Colorectum | SER |  |
| Colorectum | MSS |  |
| Colorectum | MSI-H |  |
| Colorectum | FAP |  |
| ∗Top 15 enriched GO BP terms are showed in the bar plot of each disease state in each tissue. Each row represents a significant GO biological process which is colored according to the -log10(p.adjust). |
| Page: 1 2 3 4 5 6 7 8 9 |
| GO ID | Tissue | Disease Stage | Description | Gene Ratio | Bg Ratio | pvalue | p.adjust | Count |
| GO:0018279 | Colorectum | AD | protein N-linked glycosylation via asparagine | 15/3918 | 23/18723 | 5.47e-06 | 1.40e-04 | 15 |
| GO:0018196 | Colorectum | AD | peptidyl-asparagine modification | 15/3918 | 24/18723 | 1.18e-05 | 2.62e-04 | 15 |
| GO:0009410 | Colorectum | AD | response to xenobiotic stimulus | 128/3918 | 462/18723 | 2.69e-04 | 3.31e-03 | 128 |
| GO:0007568 | Colorectum | AD | aging | 98/3918 | 339/18723 | 2.77e-04 | 3.39e-03 | 98 |
| GO:0006487 | Colorectum | AD | protein N-linked glycosylation | 25/3918 | 65/18723 | 9.12e-04 | 8.71e-03 | 25 |
| GO:0006486 | Colorectum | AD | protein glycosylation | 64/3918 | 226/18723 | 4.86e-03 | 3.27e-02 | 64 |
| GO:0043413 | Colorectum | AD | macromolecule glycosylation | 64/3918 | 226/18723 | 4.86e-03 | 3.27e-02 | 64 |
| GO:0070085 | Colorectum | AD | glycosylation | 67/3918 | 240/18723 | 5.78e-03 | 3.67e-02 | 67 |
| GO:00182792 | Colorectum | MSS | protein N-linked glycosylation via asparagine | 13/3467 | 23/18723 | 5.21e-05 | 9.31e-04 | 13 |
| GO:00181962 | Colorectum | MSS | peptidyl-asparagine modification | 13/3467 | 24/18723 | 9.44e-05 | 1.49e-03 | 13 |
| GO:00075681 | Colorectum | MSS | aging | 90/3467 | 339/18723 | 1.51e-04 | 2.19e-03 | 90 |
| GO:00064871 | Colorectum | MSS | protein N-linked glycosylation | 23/3467 | 65/18723 | 9.47e-04 | 9.54e-03 | 23 |
| GO:00094101 | Colorectum | MSS | response to xenobiotic stimulus | 110/3467 | 462/18723 | 2.36e-03 | 1.92e-02 | 110 |
| GO:00182793 | Colorectum | MSI-H | protein N-linked glycosylation via asparagine | 7/1319 | 23/18723 | 7.62e-04 | 1.42e-02 | 7 |
| GO:00181963 | Colorectum | MSI-H | peptidyl-asparagine modification | 7/1319 | 24/18723 | 1.01e-03 | 1.73e-02 | 7 |
| GO:00182794 | Colorectum | FAP | protein N-linked glycosylation via asparagine | 10/2622 | 23/18723 | 5.68e-04 | 6.33e-03 | 10 |
| GO:00075682 | Colorectum | FAP | aging | 69/2622 | 339/18723 | 7.66e-04 | 8.12e-03 | 69 |
| GO:00181964 | Colorectum | FAP | peptidyl-asparagine modification | 10/2622 | 24/18723 | 8.53e-04 | 8.79e-03 | 10 |
| GO:00064861 | Colorectum | FAP | protein glycosylation | 48/2622 | 226/18723 | 1.85e-03 | 1.57e-02 | 48 |
| GO:00434131 | Colorectum | FAP | macromolecule glycosylation | 48/2622 | 226/18723 | 1.85e-03 | 1.57e-02 | 48 |
| Page: 1 2 3 4 5 6 |
| Pathway ID | Tissue | Disease Stage | Description | Gene Ratio | Bg Ratio | pvalue | p.adjust | qvalue | Count |
| hsa04141 | Colorectum | AD | Protein processing in endoplasmic reticulum | 80/2092 | 174/8465 | 5.96e-10 | 1.25e-08 | 7.96e-09 | 80 |
| hsa00510 | Colorectum | AD | N-Glycan biosynthesis | 21/2092 | 53/8465 | 1.15e-02 | 4.24e-02 | 2.71e-02 | 21 |
| hsa041411 | Colorectum | AD | Protein processing in endoplasmic reticulum | 80/2092 | 174/8465 | 5.96e-10 | 1.25e-08 | 7.96e-09 | 80 |
| hsa005101 | Colorectum | AD | N-Glycan biosynthesis | 21/2092 | 53/8465 | 1.15e-02 | 4.24e-02 | 2.71e-02 | 21 |
| hsa041414 | Colorectum | MSS | Protein processing in endoplasmic reticulum | 75/1875 | 174/8465 | 3.78e-10 | 8.44e-09 | 5.17e-09 | 75 |
| hsa005102 | Colorectum | MSS | N-Glycan biosynthesis | 20/1875 | 53/8465 | 7.17e-03 | 2.83e-02 | 1.73e-02 | 20 |
| hsa00513 | Colorectum | MSS | Various types of N-glycan biosynthesis | 16/1875 | 42/8465 | 1.39e-02 | 4.53e-02 | 2.77e-02 | 16 |
| hsa041415 | Colorectum | MSS | Protein processing in endoplasmic reticulum | 75/1875 | 174/8465 | 3.78e-10 | 8.44e-09 | 5.17e-09 | 75 |
| hsa005103 | Colorectum | MSS | N-Glycan biosynthesis | 20/1875 | 53/8465 | 7.17e-03 | 2.83e-02 | 1.73e-02 | 20 |
| hsa005131 | Colorectum | MSS | Various types of N-glycan biosynthesis | 16/1875 | 42/8465 | 1.39e-02 | 4.53e-02 | 2.77e-02 | 16 |
| hsa041416 | Colorectum | MSI-H | Protein processing in endoplasmic reticulum | 46/797 | 174/8465 | 4.53e-11 | 9.78e-10 | 8.19e-10 | 46 |
| hsa041417 | Colorectum | MSI-H | Protein processing in endoplasmic reticulum | 46/797 | 174/8465 | 4.53e-11 | 9.78e-10 | 8.19e-10 | 46 |
| hsa041418 | Colorectum | FAP | Protein processing in endoplasmic reticulum | 50/1404 | 174/8465 | 3.64e-05 | 3.68e-04 | 2.24e-04 | 50 |
| hsa041419 | Colorectum | FAP | Protein processing in endoplasmic reticulum | 50/1404 | 174/8465 | 3.64e-05 | 3.68e-04 | 2.24e-04 | 50 |
| hsa0414126 | Endometrium | AEH | Protein processing in endoplasmic reticulum | 62/1197 | 174/8465 | 5.97e-13 | 1.39e-11 | 1.01e-11 | 62 |
| hsa04141111 | Endometrium | AEH | Protein processing in endoplasmic reticulum | 62/1197 | 174/8465 | 5.97e-13 | 1.39e-11 | 1.01e-11 | 62 |
| hsa0414127 | Endometrium | EEC | Protein processing in endoplasmic reticulum | 64/1237 | 174/8465 | 2.17e-13 | 5.09e-12 | 3.80e-12 | 64 |
| hsa0414136 | Endometrium | EEC | Protein processing in endoplasmic reticulum | 64/1237 | 174/8465 | 2.17e-13 | 5.09e-12 | 3.80e-12 | 64 |
| hsa04141211 | Esophagus | ESCC | Protein processing in endoplasmic reticulum | 147/4205 | 174/8465 | 3.29e-22 | 1.10e-19 | 5.64e-20 | 147 |
| hsa0051023 | Esophagus | ESCC | N-Glycan biosynthesis | 39/4205 | 53/8465 | 3.26e-04 | 1.15e-03 | 5.89e-04 | 39 |
| Page: 1 2 3 |
Top |
Cell-cell communication analysis |
| Identification of potential cell-cell interactions between two cell types and their ligand-receptor pairs for different disease states |
| Ligand | Receptor | LRpair | Pathway | Tissue | Disease Stage |
| Page: 1 |
Top |
Single-cell gene regulatory network inference analysis |
| Find out the significant the regulons (TFs) and the target genes of each regulon across cell types for different disease states |
| TF | Cell Type | Tissue | Disease Stage | Target Gene | RSS | Regulon Activity |
| ∗The dot plots of a searched regulon are shown for all cell subpopulations in each disease state of each tissue based on the regulon specific score inferred using pySCENIC and by calculating the average expression. |
| Page: 1 |
Top |
Somatic mutation of malignant transformation related genes |
| Annotation of somatic variants for genes involved in malignant transformation |
| Hugo Symbol | Variant Class | Variant Classification | dbSNP RS | HGVSc | HGVSp | HGVSp Short | SWISSPROT | BIOTYPE | SIFT | PolyPhen | Tumor Sample Barcode | Tissue | Histology | Sex | Age | Stage | Therapy Types | Drugs | Outcome |
| RPN2 | insertion | Frame_Shift_Ins | novel | c.1232_1233insT | p.Gln412ProfsTer17 | p.Q412Pfs*17 | P04844 | protein_coding | TCGA-A2-A0EV-01 | Breast | breast invasive carcinoma | Female | >=65 | I/II | Unknown | Unknown | SD | ||
| RPN2 | insertion | Frame_Shift_Ins | novel | c.1234_1235insTTGATCCTGACTTAGACTATAAACCAGTGGATTTGGCA | p.Gln412LeufsTer23 | p.Q412Lfs*23 | P04844 | protein_coding | TCGA-A2-A0EV-01 | Breast | breast invasive carcinoma | Female | >=65 | I/II | Unknown | Unknown | SD | ||
| RPN2 | insertion | Nonsense_Mutation | novel | c.1457_1458insGTGGATTCAATGTTAGGCCCAGGGAGAATCTTGAAATT | p.Asp487TrpfsTer5 | p.D487Wfs*5 | P04844 | protein_coding | TCGA-AR-A0TY-01 | Breast | breast invasive carcinoma | Female | <65 | I/II | Unspecific | Paclitaxel | PD | ||
| RPN2 | SNV | Missense_Mutation | novel | c.579N>C | p.Glu193Asp | p.E193D | P04844 | protein_coding | tolerated(0.68) | benign(0.12) | TCGA-AA-A01D-01 | Colorectum | colon adenocarcinoma | Female | <65 | III/IV | Chemotherapy | capecitabine | PD |
| RPN2 | SNV | Missense_Mutation | rs146095088 | c.166N>A | p.Val56Met | p.V56M | P04844 | protein_coding | deleterious(0.04) | possibly_damaging(0.804) | TCGA-CM-4743-01 | Colorectum | colon adenocarcinoma | Male | >=65 | I/II | Chemotherapy | capecitabine | SD |
| RPN2 | SNV | Missense_Mutation | c.125A>G | p.Asp42Gly | p.D42G | P04844 | protein_coding | tolerated(0.26) | benign(0.08) | TCGA-CM-5861-01 | Colorectum | colon adenocarcinoma | Female | <65 | I/II | Unknown | Unknown | PD | |
| RPN2 | SNV | Missense_Mutation | novel | c.367A>G | p.Thr123Ala | p.T123A | P04844 | protein_coding | tolerated(0.88) | benign(0) | TCGA-F5-6814-01 | Colorectum | rectum adenocarcinoma | Male | <65 | I/II | Unknown | Unknown | SD |
| RPN2 | deletion | Frame_Shift_Del | c.583delN | p.Gly196AlafsTer41 | p.G196Afs*41 | P04844 | protein_coding | TCGA-F4-6703-01 | Colorectum | colon adenocarcinoma | Male | <65 | I/II | Unknown | Unknown | SD | |||
| RPN2 | SNV | Missense_Mutation | c.1304T>C | p.Phe435Ser | p.F435S | P04844 | protein_coding | deleterious(0) | probably_damaging(1) | TCGA-A5-A0VQ-01 | Endometrium | uterine corpus endometrioid carcinoma | Female | <65 | I/II | Chemotherapy | carboplatin | SD | |
| RPN2 | SNV | Missense_Mutation | novel | c.1020N>C | p.Lys340Asn | p.K340N | P04844 | protein_coding | deleterious(0) | probably_damaging(0.979) | TCGA-A5-A1OF-01 | Endometrium | uterine corpus endometrioid carcinoma | Female | <65 | I/II | Unknown | Unknown | SD |
| Page: 1 2 3 4 5 |
Top |
Related drugs of malignant transformation related genes |
| Identification of chemicals and drugs interact with genes involved in malignant transfromation |
| (DGIdb 4.0) |
| Entrez ID | Symbol | Category | Interaction Types | Drug Claim Name | Drug Name | PMIDs |
| Page: 1 |

Copyright 2023-Present -The University of Texas Health Science Center at Houston |